| Param | Original file | Final file |
|---|---|---|
| Filename | modeM0/AS1G08_006T03_9000001732_11738cztM0_level2.evt | modeM0/AS1G08_006T03_9000001732_11738cztM0_level2_quad_clean.evt |
| Size (bytes) | 543,853,440 | 117,233,280 |
| Size | 518.7 MB | 111.8 MB |
| Events in quadrant A | 3,798,093 | 788,443 |
| Events in quadrant B | 5,430,544 | 760,758 |
| Events in quadrant C | 3,093,485 | 808,416 |
| Events in quadrant D | 3,726,888 | 758,346 |
| Mode M0 | |||
|---|---|---|---|
| Quadrant | BADHDUFLAG | Total packets | Discarded packets |
| A | 0 | 15277 | 3 |
| B | 0 | 20239 | 2 |
| C | 0 | 12993 | 2 |
| D | 0 | 15074 | 2 |
| Mode M9 | |||
|---|---|---|---|
| Quadrant | BADHDUFLAG | Total packets | Discarded packets |
| A | 0 | 18 | 0 |
| B | 0 | 18 | 0 |
| C | 0 | 18 | 0 |
| D | 0 | 19 | 0 |
| Mode SS | |||
|---|---|---|---|
| Quadrant | BADHDUFLAG | Total packets | Discarded packets |
| A | 0 | 126 | 0 |
| B | 0 | 126 | 0 |
| C | 0 | 126 | 0 |
| D | 0 | 126 | 0 |
| Quadrant | Total seconds | Saturated seconds | Saturation percentage |
|---|---|---|---|
| A | 6223 | 85 | 1.365901% |
| B | 6223 | 871 | 13.996465% |
| C | 6223 | 24 | 0.385666% |
| D | 6223 | 54 | 0.867749% |
Noise dominated data is calculated using 1-second bins in cleaned event files. If a bin has >2000 counts, and if more than 50% of those come from <1% of pixels, then it is considered to be noise-dominated and hence unusable.
| Quadrant | # 1 sec bins | Bins with >0 counts | Bins with >2000 counts | High rate bins dominated by noise | Noise dominated (total time) | Noise dominated (detector-on time) | Marked lightcurve |
|---|---|---|---|---|---|---|---|
| A | 7575 | 6226 | 16 | 16 | 0.21% | 0.26% | 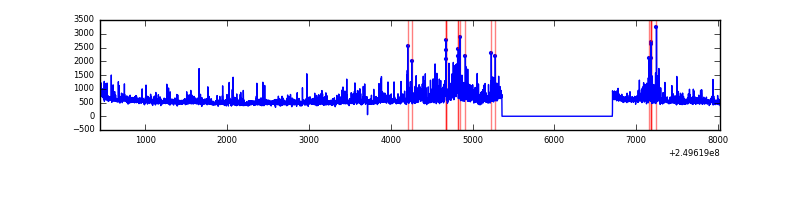 |
| B | 7575 | 6226 | 604 | 604 | 7.97% | 9.70% | 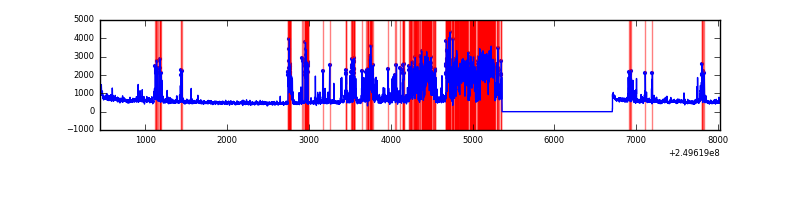 |
| C | 7575 | 6226 | 0 | 0 | 0.00% | 0.00% | 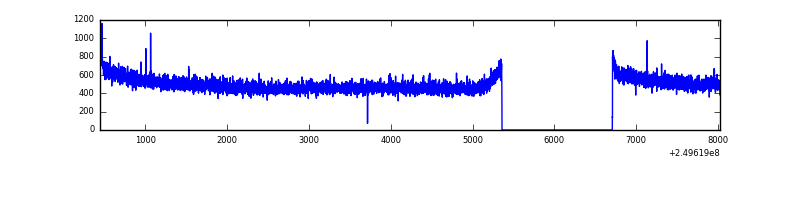 |
| D | 7575 | 6226 | 18 | 18 | 0.24% | 0.29% | 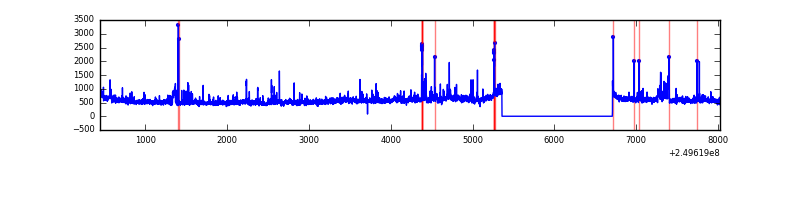 |
Top three noisy pixels from each quadrant. If the there are fewer than three noisy pixels in the level2.evt file, extra rows are filled as -1
| Pixel properties | Quadrant properties | ||||||
|---|---|---|---|---|---|---|---|
| Quadrant | DetID | PixID | Counts | Sigma | Mean | Median | Sigma |
| A | 13 | 251 | 314877 | 1998.64 | 792 | 778 | 157.2 |
| A | 1 | 162 | 129604 | 819.73 | 792 | 778 | 157.2 |
| A | 8 | 15 | 83210 | 524.52 | 792 | 778 | 157.2 |
| B | 3 | 64 | 1165849 | 8468.63 | 759 | 745 | 137.6 |
| B | 4 | 239 | 798394 | 5797.76 | 759 | 745 | 137.6 |
| B | 15 | 204 | 236567 | 1714.09 | 759 | 745 | 137.6 |
| C | 13 | 61 | 5887 | 28.48 | 792 | 796 | 178.7 |
| C | 12 | 4 | 2909 | 11.82 | 792 | 796 | 178.7 |
| C | 3 | 202 | 1985 | 6.65 | 792 | 796 | 178.7 |
| D | 8 | 195 | 416599 | 2264.62 | 779 | 762 | 183.6 |
| D | 1 | 52 | 158389 | 858.43 | 779 | 762 | 183.6 |
| D | 5 | 222 | 82039 | 442.63 | 779 | 762 | 183.6 |
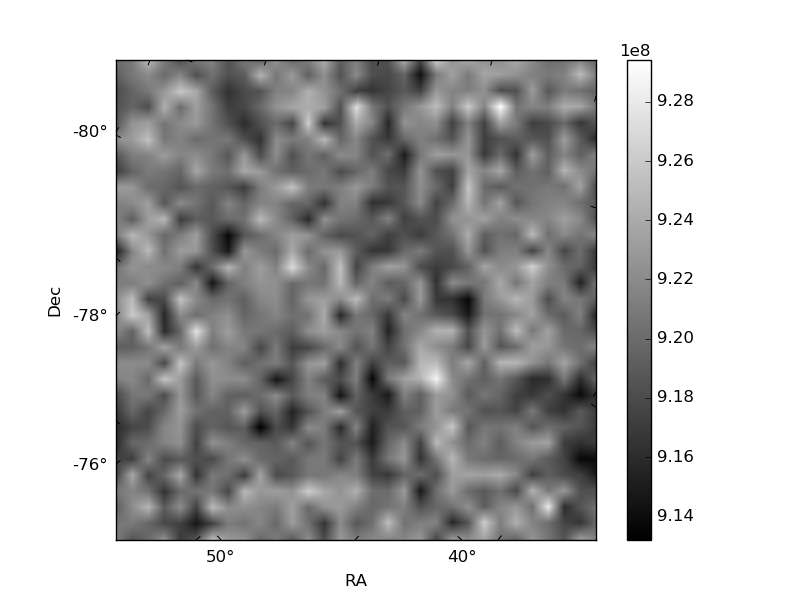
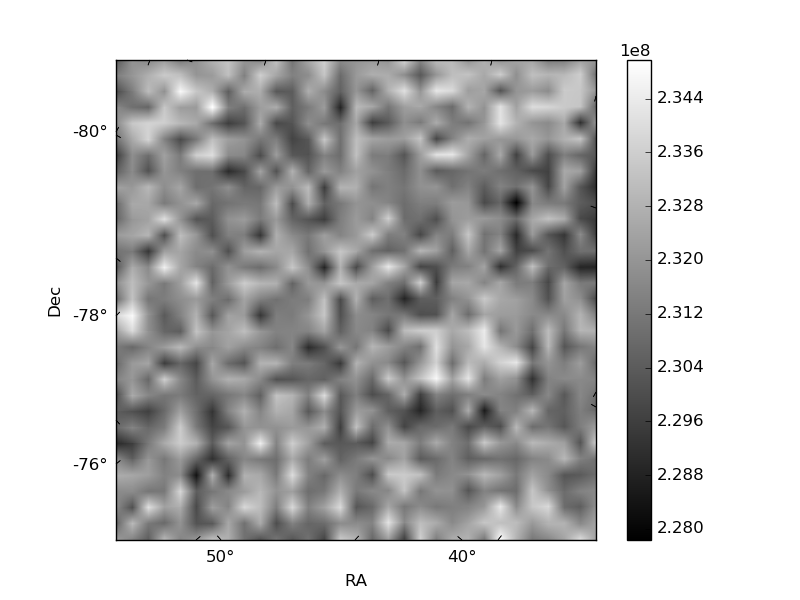
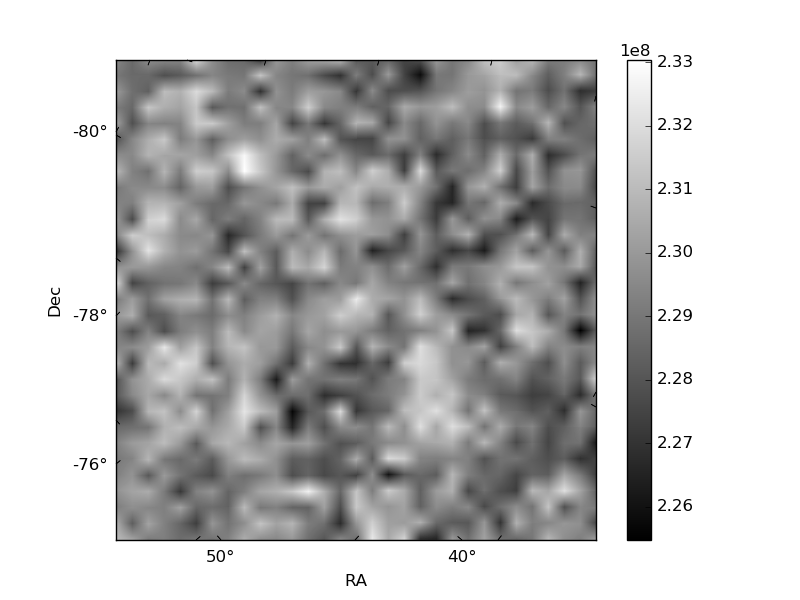
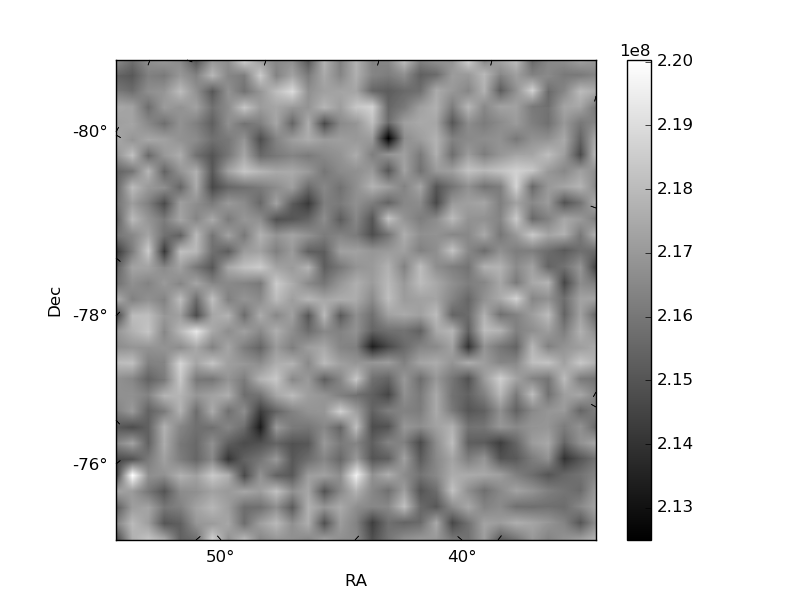
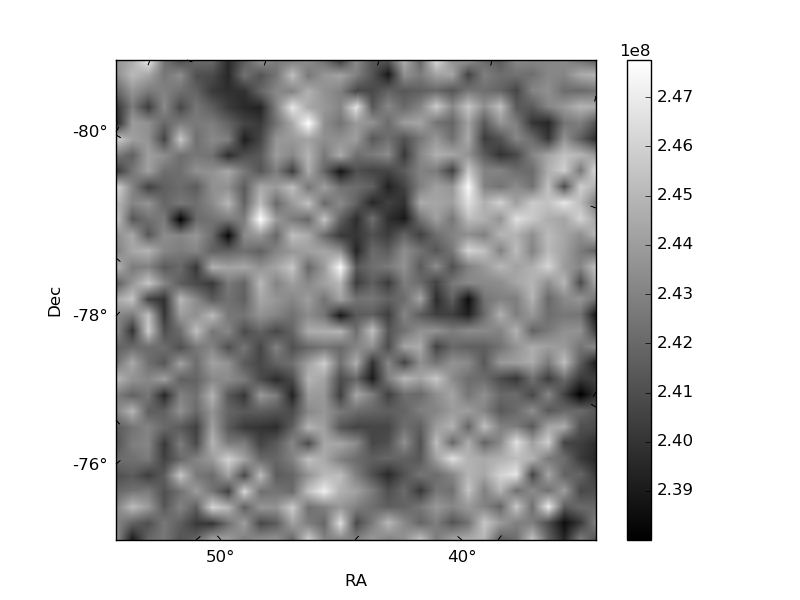
Histogram calculated using DETX and DETY for each event in the final _common_clean file
| Quadrant A | 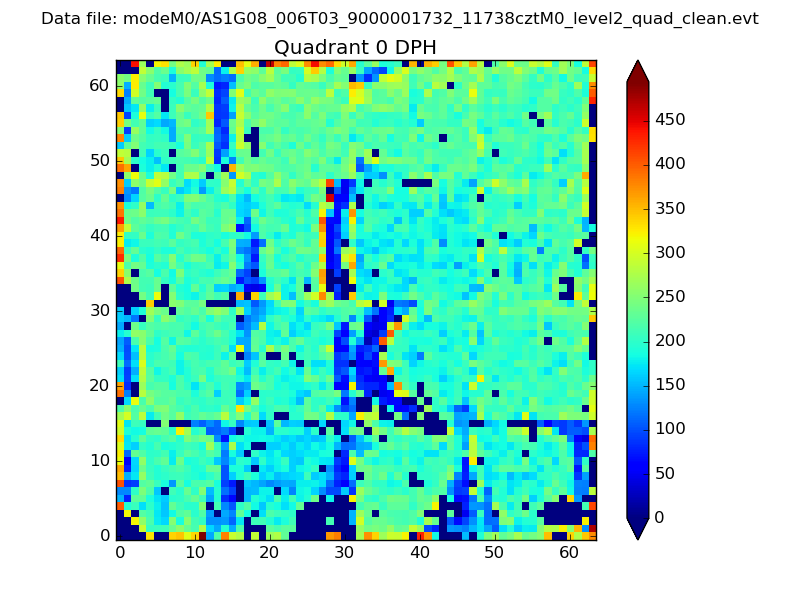 |
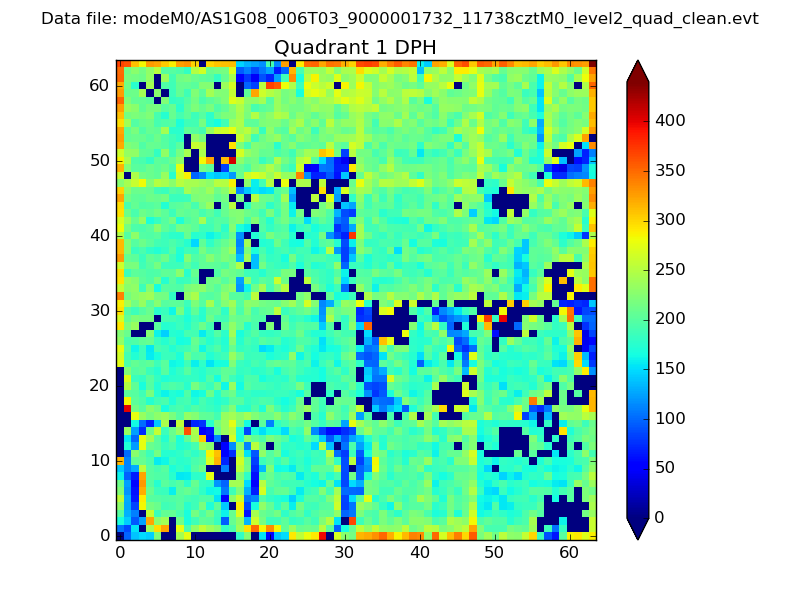 |
Quadrant B |
|---|---|---|---|
| Quadrant D | 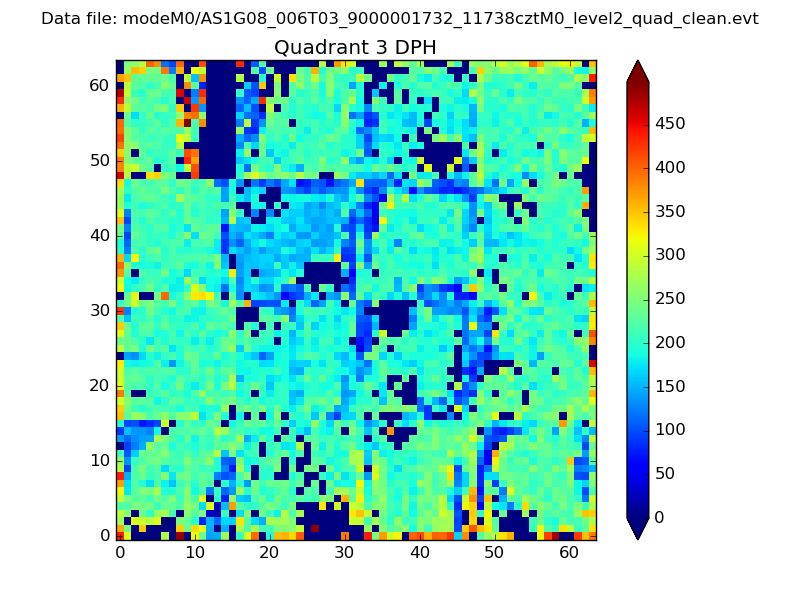 |
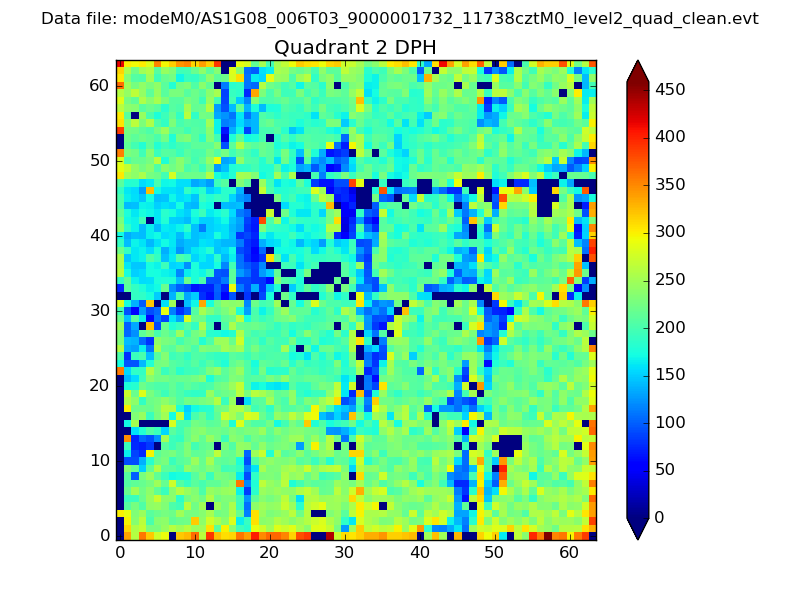 |
Quadrant C |
| Plot type | Count rate plots | Images |
|---|---|---|
| Comparison with Poisson distribution Blue bars denote a histogram of data divided into 1 sec bins. Red curve is a Poisson curve with rate = median count rate of data. |
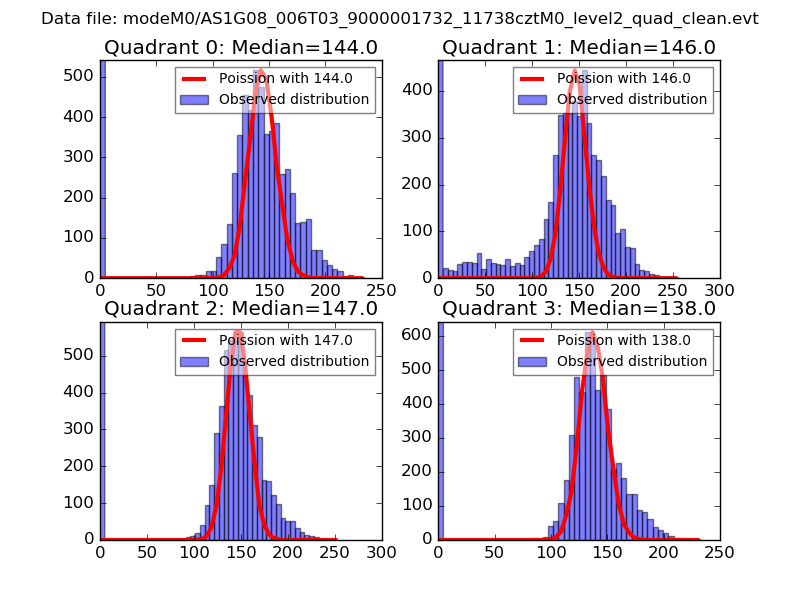 |
 |
| Quadrant-wise count rates Data is divided into 100 sec bins |
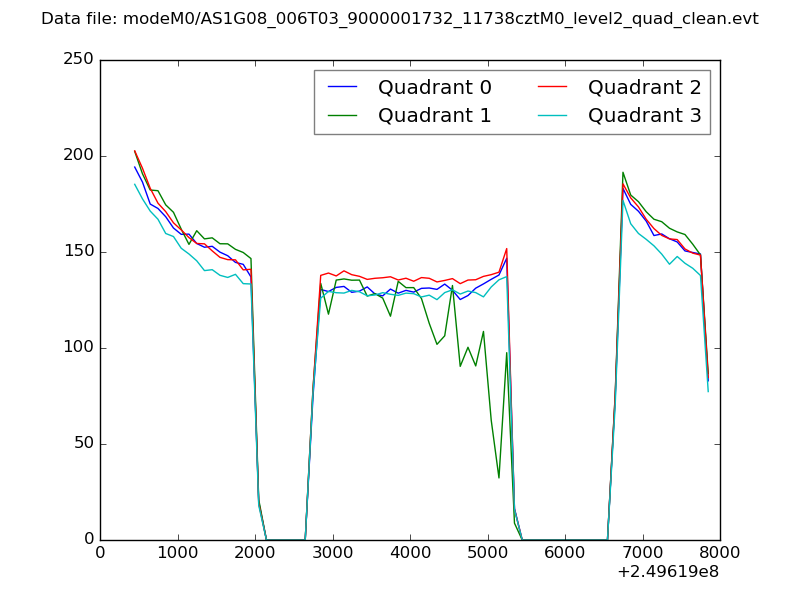 |
|
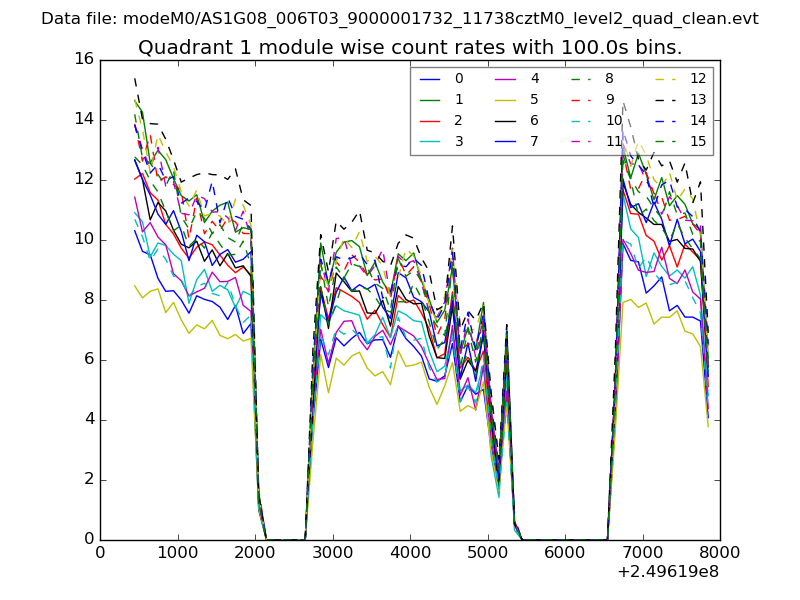
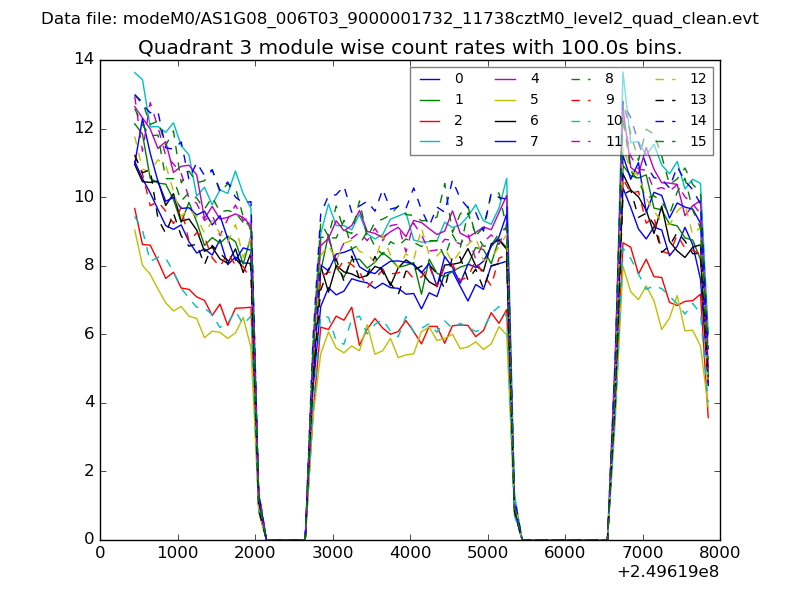
| Module-wise count rates for Quadrant A Data is divided into 100 sec bins |
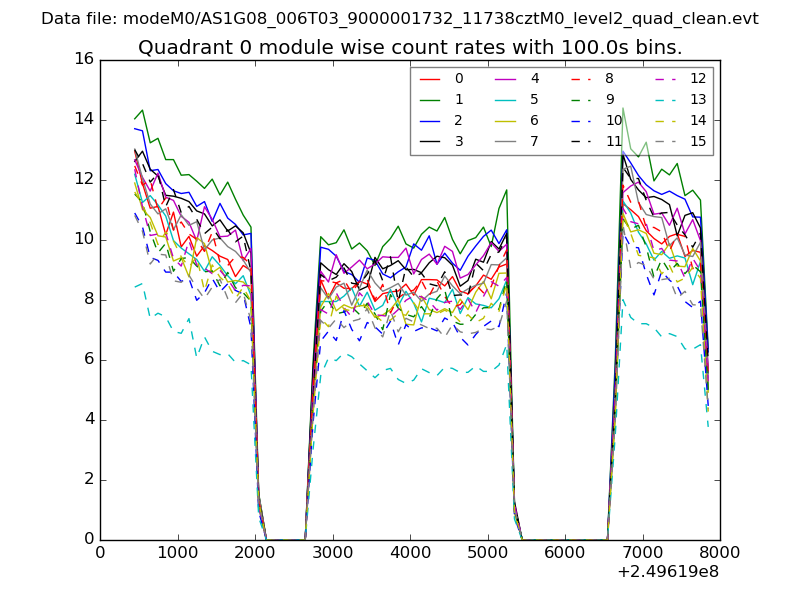 |
 |
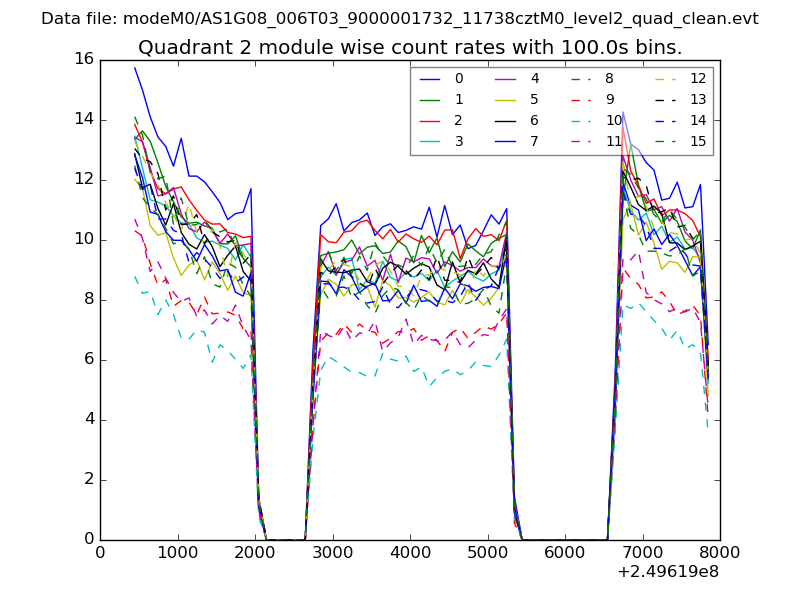
| Module-wise count rates for Quadrant B Data is divided into 100 sec bins |
 |
 |
| Module-wise count rates for Quadrant C Data is divided into 100 sec bins |
 |
 |
| Module-wise count rates for Quadrant D Data is divided into 100 sec bins |
 |
 |
| Parameter | Plot |
|---|---|
| CZT HV Monitor | 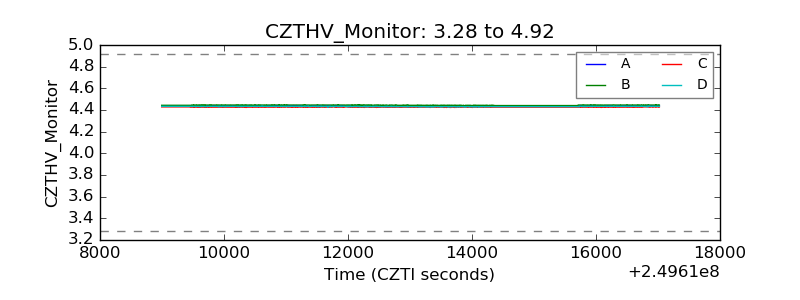 |
| D_VDD | 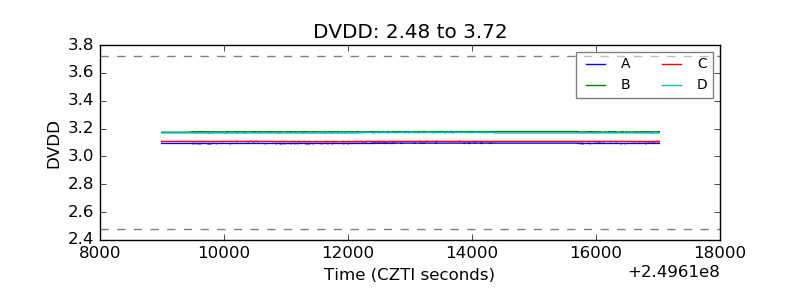 |
| Temperature 1 | 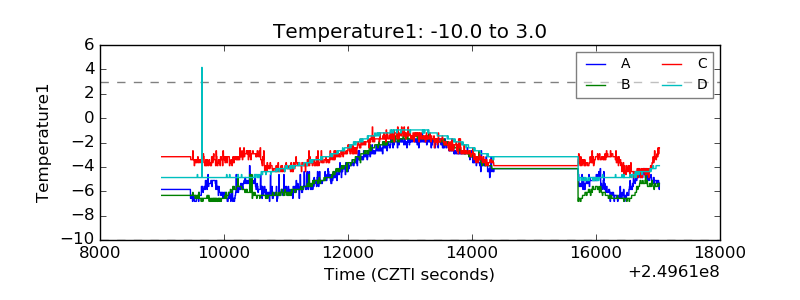 |
| Veto HV Monitor |  |
| Veto LLD | 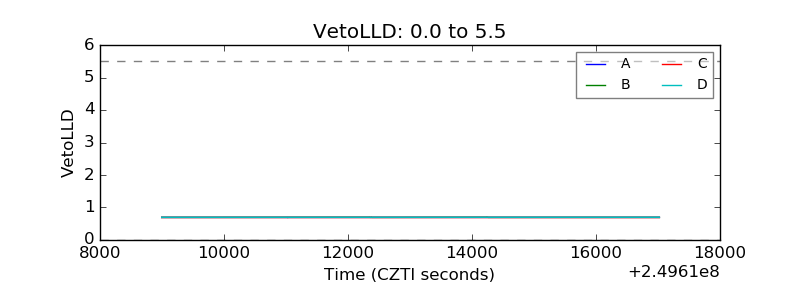 |
| Alpha Counter | 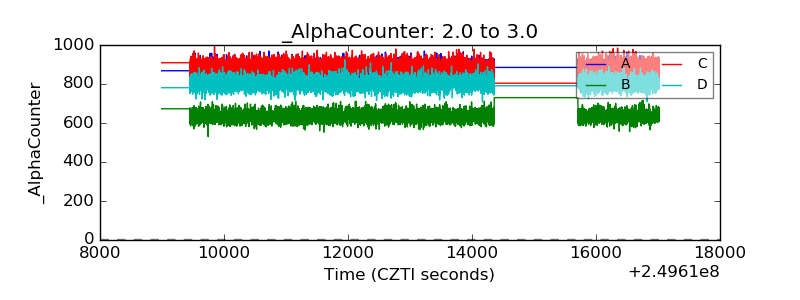 |
| _CPM_Rate | 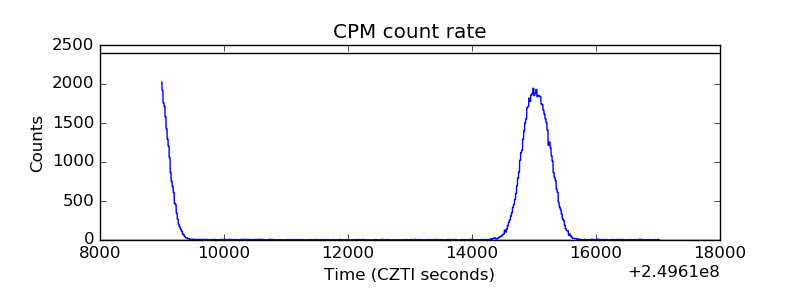 |
| CZT Counter | 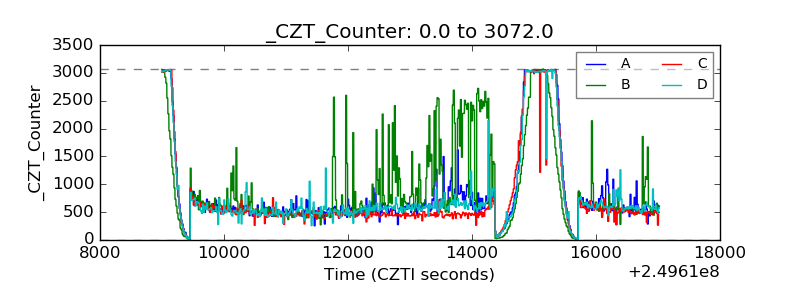 |
| +2.5 Volts monitor |  |
| +5 Volts monitor |  |
| _ROLL_ROT | 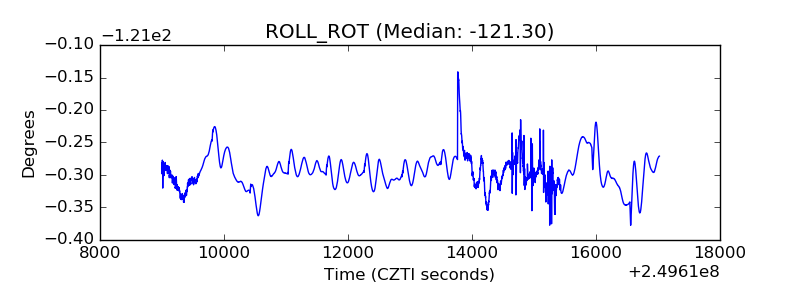 |
| _Roll_DEC | 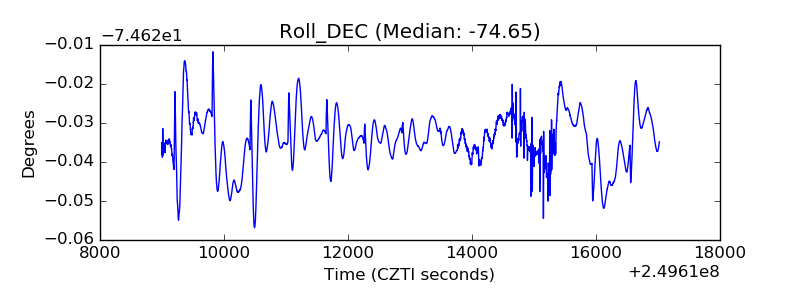 |
| _Roll_RA | 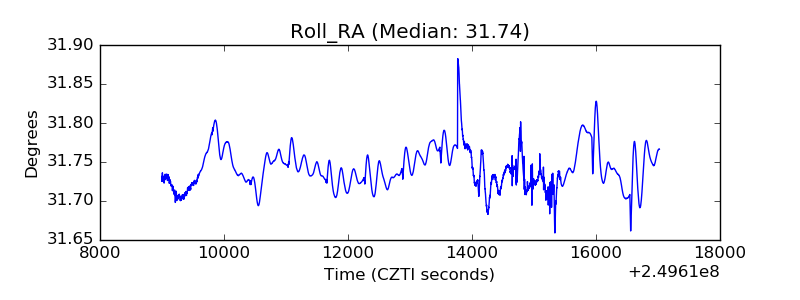 |
| Veto Counter | 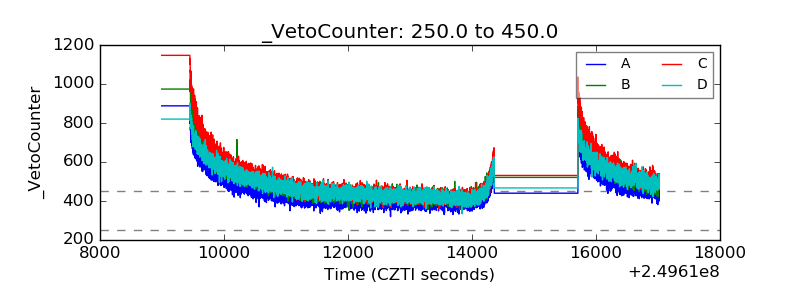 |