| Param | Original file | Final file |
|---|---|---|
| Filename | modeM0/AS1G08_006T03_9000001732_11739cztM0_level2.evt | modeM0/AS1G08_006T03_9000001732_11739cztM0_level2_quad_clean.evt |
| Size (bytes) | 484,560,000 | 98,982,720 |
| Size | 462.1 MB | 94.4 MB |
| Events in quadrant A | 3,568,839 | 648,557 |
| Events in quadrant B | 4,251,982 | 652,330 |
| Events in quadrant C | 2,824,950 | 663,416 |
| Events in quadrant D | 3,631,167 | 623,240 |
| Mode M0 | |||
|---|---|---|---|
| Quadrant | BADHDUFLAG | Total packets | Discarded packets |
| A | 0 | 14444 | 2 |
| B | 0 | 16386 | 1 |
| C | 0 | 12004 | 1 |
| D | 0 | 14633 | 1 |
| Mode M9 | |||
|---|---|---|---|
| Quadrant | BADHDUFLAG | Total packets | Discarded packets |
| A | 0 | 13 | 0 |
| B | 0 | 13 | 0 |
| C | 0 | 13 | 0 |
| D | 0 | 13 | 0 |
| Mode SS | |||
|---|---|---|---|
| Quadrant | BADHDUFLAG | Total packets | Discarded packets |
| A | 0 | 120 | 0 |
| B | 0 | 120 | 0 |
| C | 0 | 120 | 0 |
| D | 0 | 120 | 0 |
| Quadrant | Total seconds | Saturated seconds | Saturation percentage |
|---|---|---|---|
| A | 5866 | 89 | 1.517218% |
| B | 5866 | 326 | 5.557450% |
| C | 5866 | 34 | 0.579611% |
| D | 5866 | 74 | 1.261507% |
Noise dominated data is calculated using 1-second bins in cleaned event files. If a bin has >2000 counts, and if more than 50% of those come from <1% of pixels, then it is considered to be noise-dominated and hence unusable.
| Quadrant | # 1 sec bins | Bins with >0 counts | Bins with >2000 counts | High rate bins dominated by noise | Noise dominated (total time) | Noise dominated (detector-on time) | Marked lightcurve |
|---|---|---|---|---|---|---|---|
| A | 7167 | 5868 | 17 | 17 | 0.24% | 0.29% |  |
| B | 7167 | 5868 | 167 | 167 | 2.33% | 2.85% | 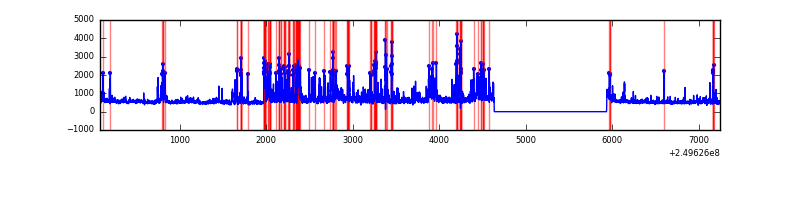 |
| C | 7167 | 5868 | 0 | 0 | 0.00% | 0.00% | 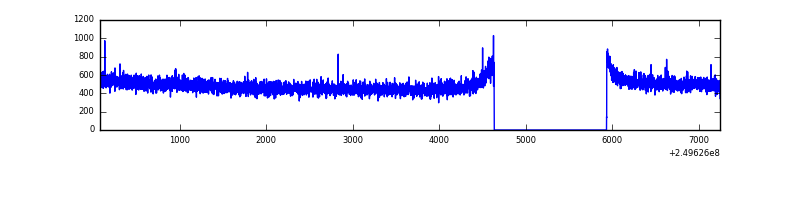 |
| D | 7167 | 5868 | 30 | 30 | 0.42% | 0.51% | 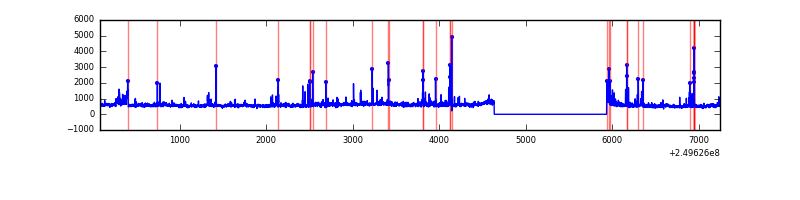 |
Top three noisy pixels from each quadrant. If the there are fewer than three noisy pixels in the level2.evt file, extra rows are filled as -1
| Pixel properties | Quadrant properties | ||||||
|---|---|---|---|---|---|---|---|
| Quadrant | DetID | PixID | Counts | Sigma | Mean | Median | Sigma |
| A | 13 | 251 | 186682 | 1276.02 | 730 | 718 | 145.7 |
| A | 9 | 143 | 148614 | 1014.81 | 730 | 718 | 145.7 |
| A | 1 | 162 | 126571 | 863.56 | 730 | 718 | 145.7 |
| B | 4 | 239 | 606409 | 4556.51 | 725 | 708 | 132.9 |
| B | 3 | 64 | 335161 | 2515.99 | 725 | 708 | 132.9 |
| B | 15 | 204 | 276458 | 2074.39 | 725 | 708 | 132.9 |
| C | 13 | 61 | 5427 | 28.72 | 723 | 727 | 163.6 |
| C | 12 | 4 | 3874 | 19.23 | 723 | 727 | 163.6 |
| C | 3 | 202 | 1852 | 6.88 | 723 | 727 | 163.6 |
| D | 8 | 195 | 557306 | 3283.39 | 714 | 697 | 169.5 |
| D | 4 | 95 | 82195 | 480.75 | 714 | 697 | 169.5 |
| D | 5 | 222 | 64496 | 376.34 | 714 | 697 | 169.5 |
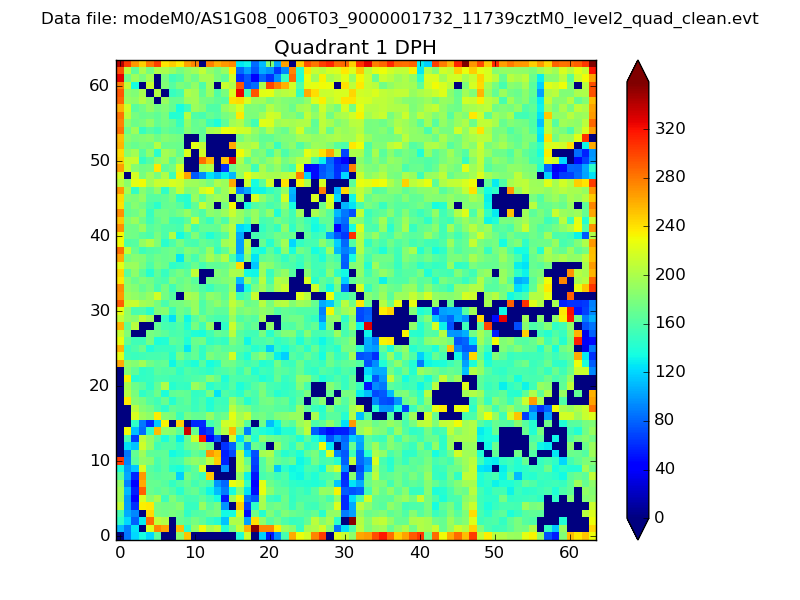
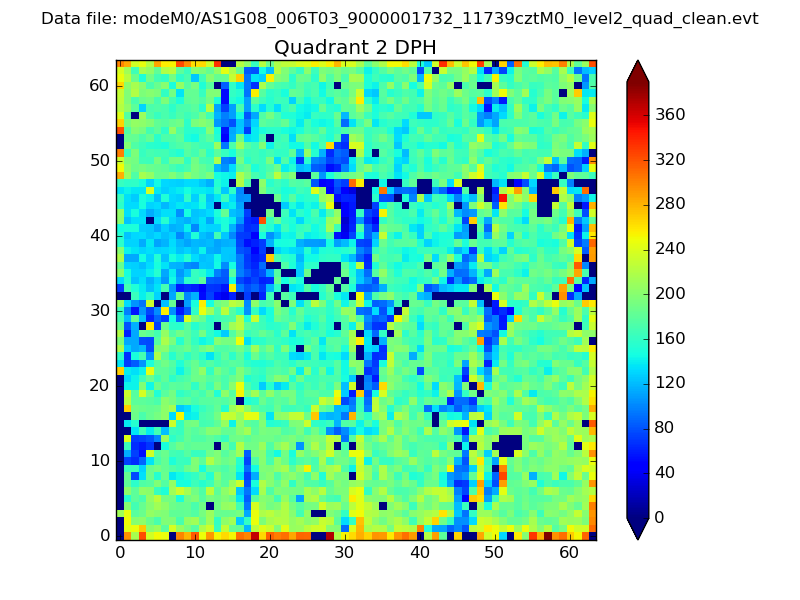
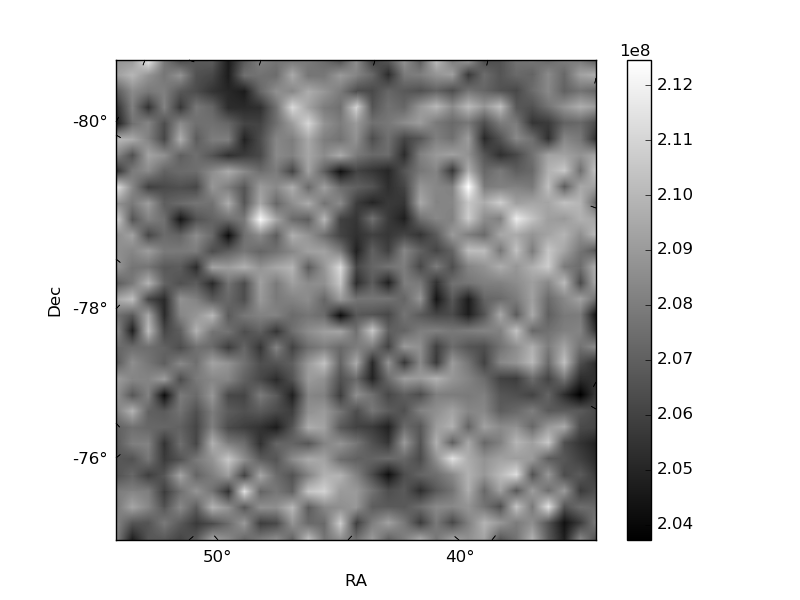
Histogram calculated using DETX and DETY for each event in the final _common_clean file
| Quadrant A | 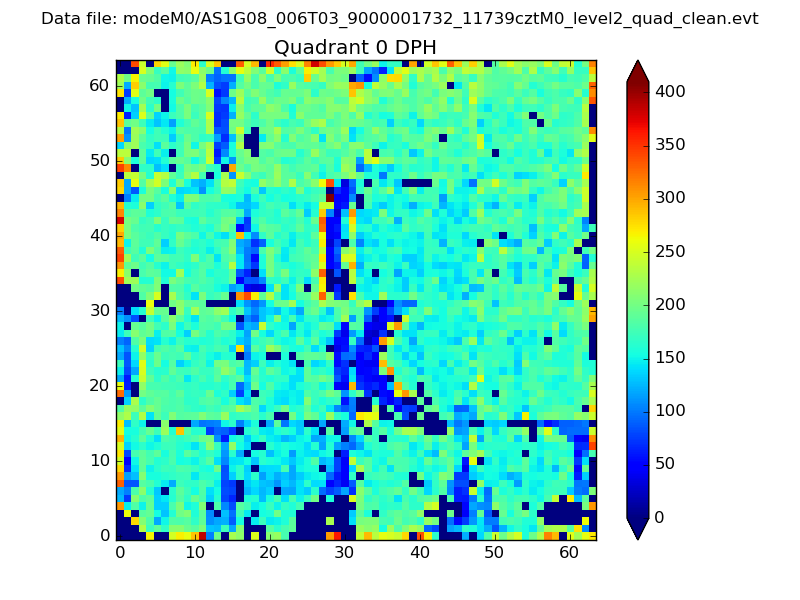 |
 |
Quadrant B |
|---|---|---|---|
| Quadrant D | 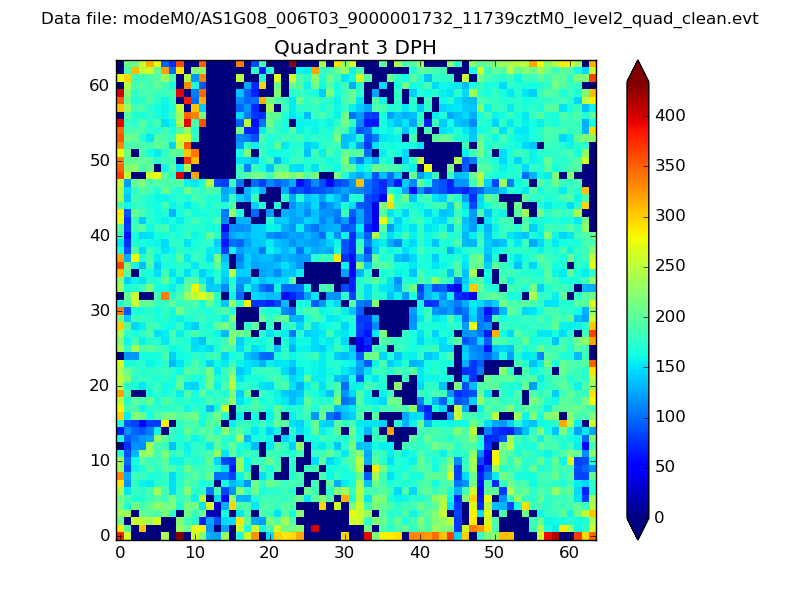 |
 |
Quadrant C |
| Plot type | Count rate plots | Images |
|---|---|---|
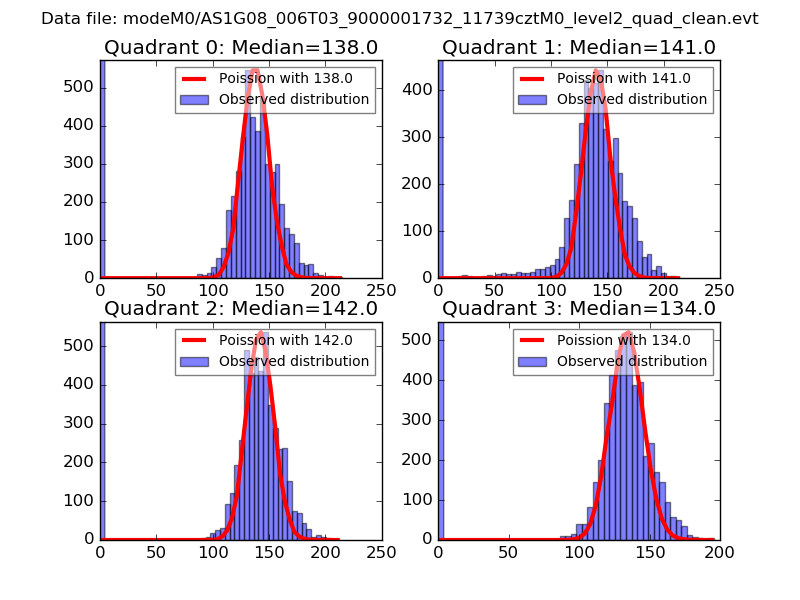
| Comparison with Poisson distribution Blue bars denote a histogram of data divided into 1 sec bins. Red curve is a Poisson curve with rate = median count rate of data. |
 |
 |
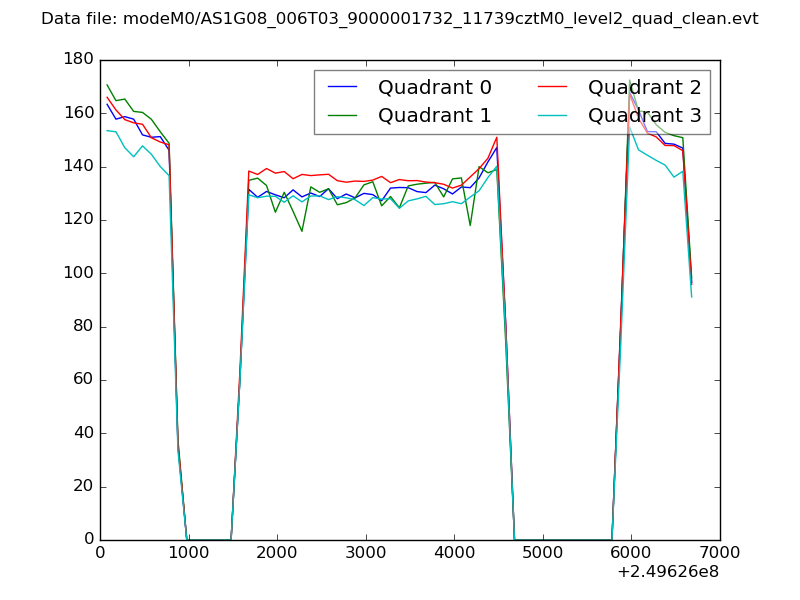
| Quadrant-wise count rates Data is divided into 100 sec bins |
 |
|
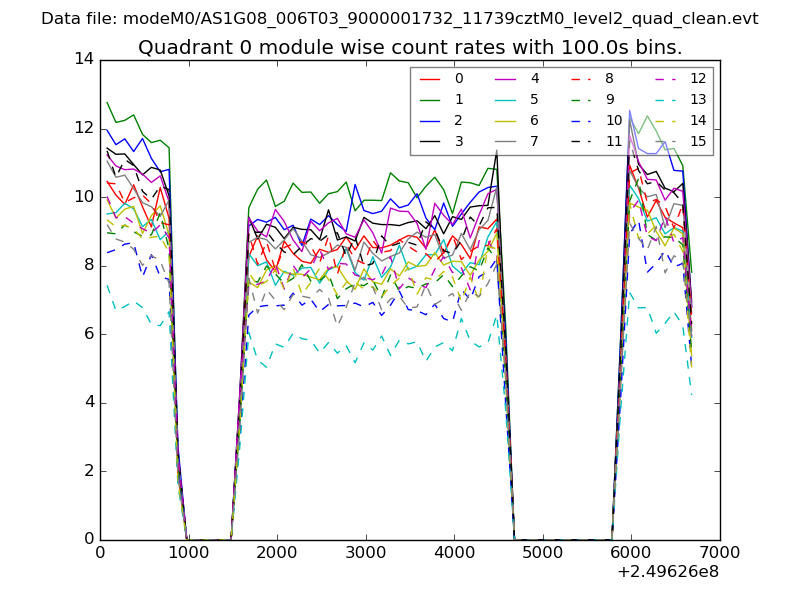
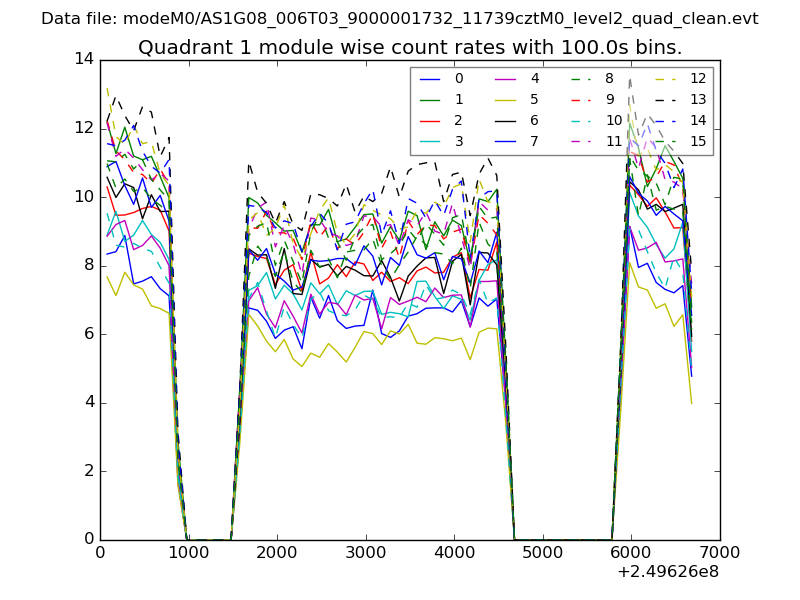
| Module-wise count rates for Quadrant A Data is divided into 100 sec bins |
 |
 |
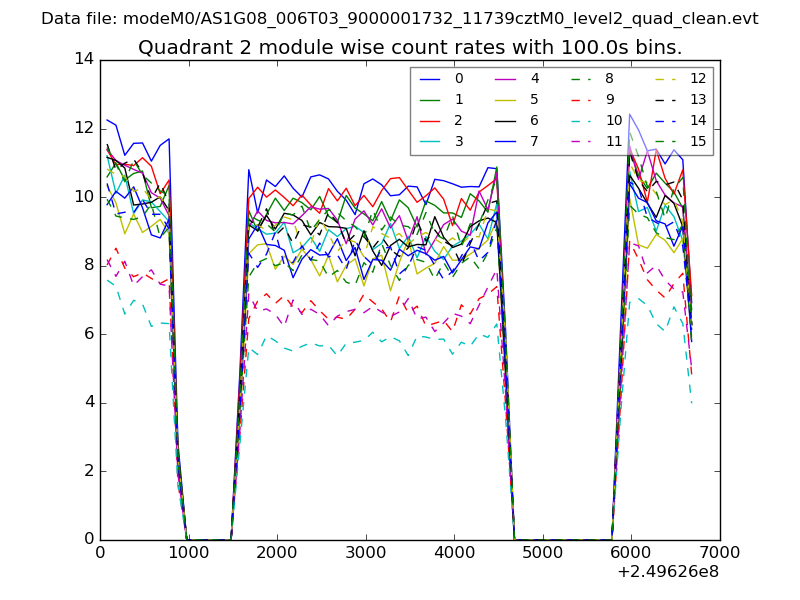
| Module-wise count rates for Quadrant B Data is divided into 100 sec bins |
 |
 |
| Module-wise count rates for Quadrant C Data is divided into 100 sec bins |
 |
 |
| Module-wise count rates for Quadrant D Data is divided into 100 sec bins |
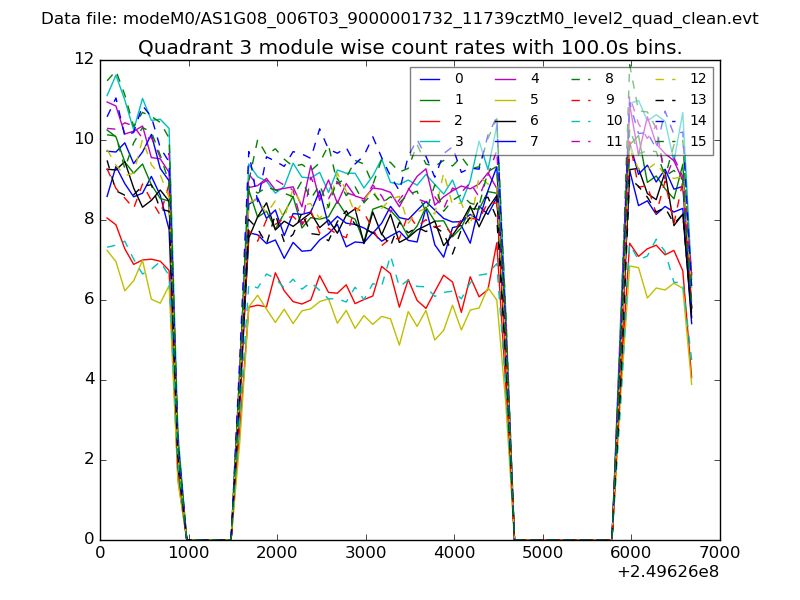 |
 |
| Parameter | Plot |
|---|---|
| CZT HV Monitor | 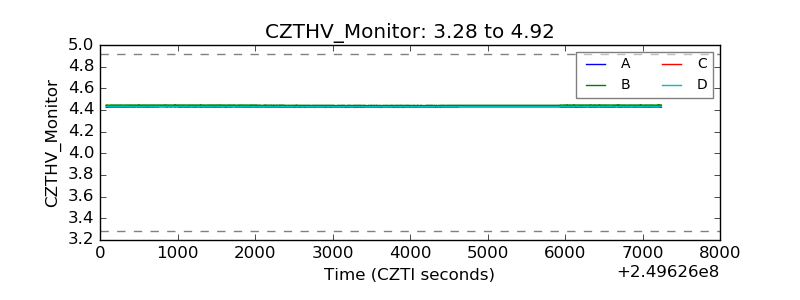 |
| D_VDD | 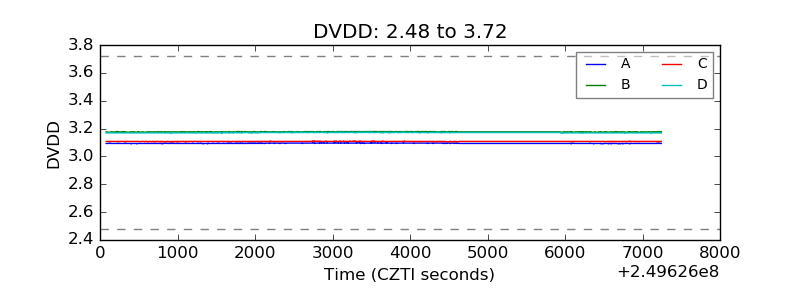 |
| Temperature 1 | 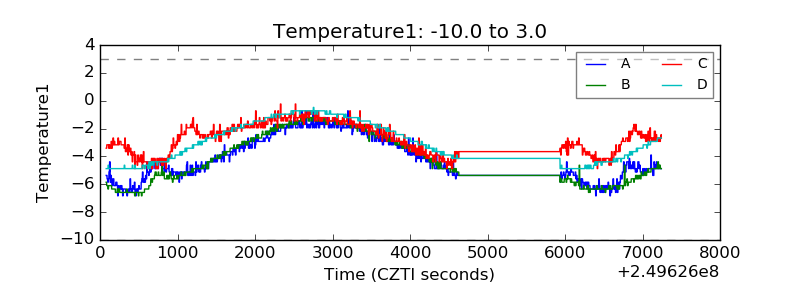 |
| Veto HV Monitor | 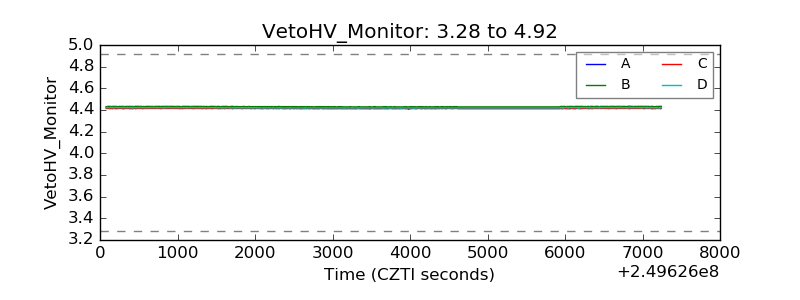 |
| Veto LLD | 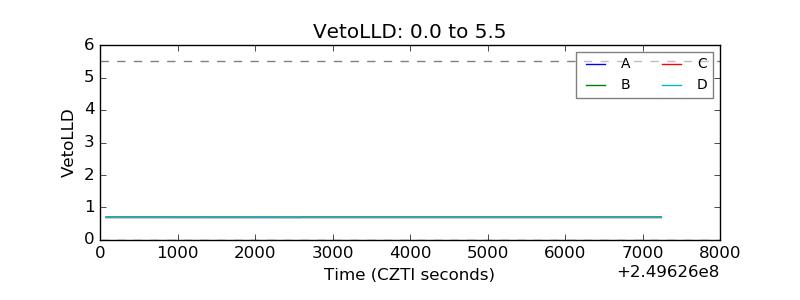 |
| Alpha Counter | 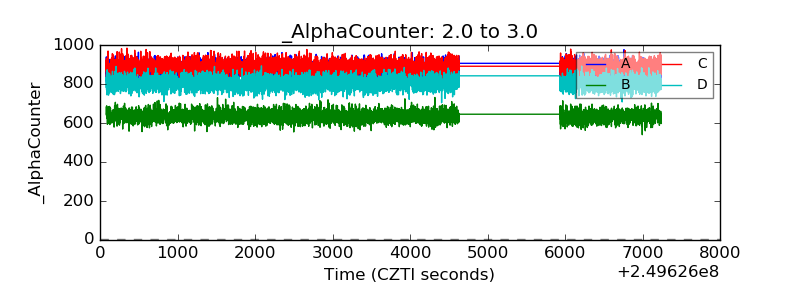 |
| _CPM_Rate | 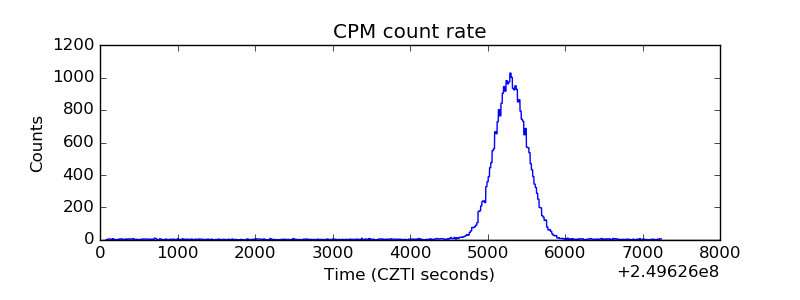 |
| CZT Counter | 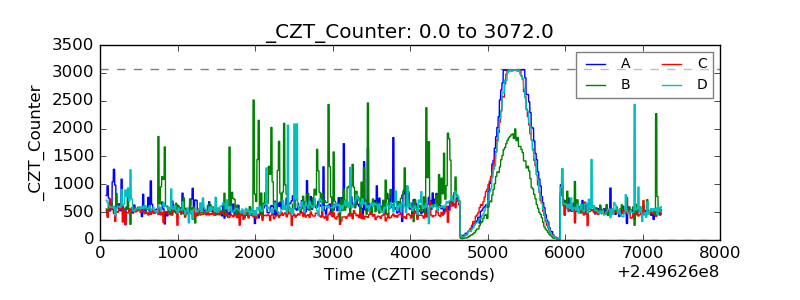 |
| +2.5 Volts monitor |  |
| +5 Volts monitor |  |
| _ROLL_ROT | 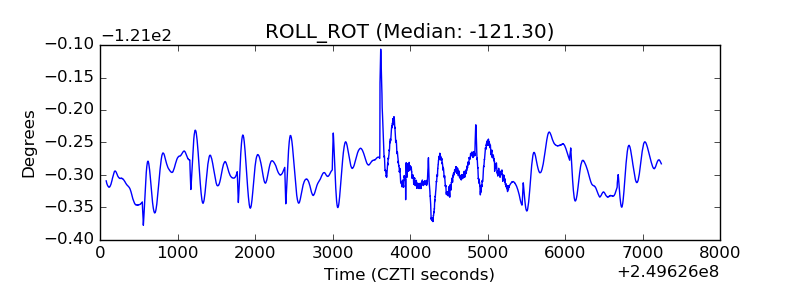 |
| _Roll_DEC | 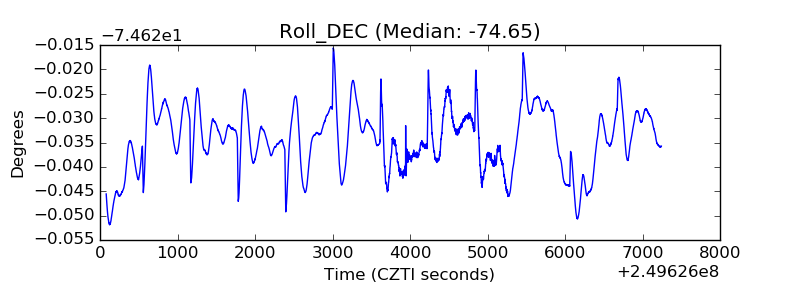 |
| _Roll_RA | 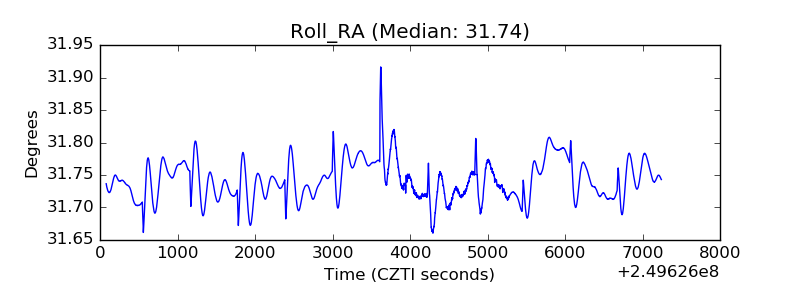 |
| Veto Counter | 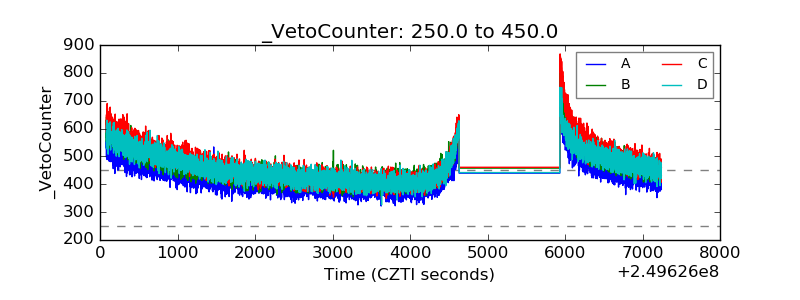 |