| Param | Original file | Final file |
|---|---|---|
| Filename | modeM0/AS1G08_006T03_9000001732_11740cztM0_level2.evt | modeM0/AS1G08_006T03_9000001732_11740cztM0_level2_quad_clean.evt |
| Size (bytes) | 334,388,160 | 68,952,960 |
| Size | 318.9 MB | 65.8 MB |
| Events in quadrant A | 2,391,769 | 451,393 |
| Events in quadrant B | 2,801,576 | 452,293 |
| Events in quadrant C | 1,900,961 | 461,959 |
| Events in quadrant D | 2,752,173 | 431,996 |
| Mode M0 | |||
|---|---|---|---|
| Quadrant | BADHDUFLAG | Total packets | Discarded packets |
| A | 0 | 9715 | 20 |
| B | 0 | 10941 | 75 |
| C | 0 | 8392 | 15 |
| D | 0 | 11113 | 43 |
| Mode M9 | |||
|---|---|---|---|
| Quadrant | BADHDUFLAG | Total packets | Discarded packets |
| A | 1 | 273359709408 | 0 |
| B | 1 | -1 | -1 |
| C | 1 | -1 | -1 |
| D | 1 | -1 | -1 |
| Mode SS | |||
|---|---|---|---|
| Quadrant | BADHDUFLAG | Total packets | Discarded packets |
| A | 0 | 82 | 0 |
| B | 0 | 82 | 0 |
| C | 0 | 82 | 0 |
| D | 0 | 82 | 0 |
| Quadrant | Total seconds | Saturated seconds | Saturation percentage |
|---|---|---|---|
| A | 4124 | 31 | 0.751697% |
| B | 4112 | 155 | 3.769455% |
| C | 4125 | 2 | 0.048485% |
| D | 4117 | 63 | 1.530240% |
Noise dominated data is calculated using 1-second bins in cleaned event files. If a bin has >2000 counts, and if more than 50% of those come from <1% of pixels, then it is considered to be noise-dominated and hence unusable.
| Quadrant | # 1 sec bins | Bins with >0 counts | Bins with >2000 counts | High rate bins dominated by noise | Noise dominated (total time) | Noise dominated (detector-on time) | Marked lightcurve |
|---|---|---|---|---|---|---|---|
| A | 4133 | 4132 | 2 | 2 | 0.05% | 0.05% | 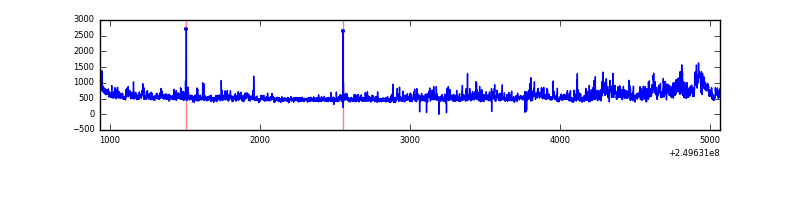 |
| B | 4133 | 4132 | 106 | 106 | 2.56% | 2.57% | 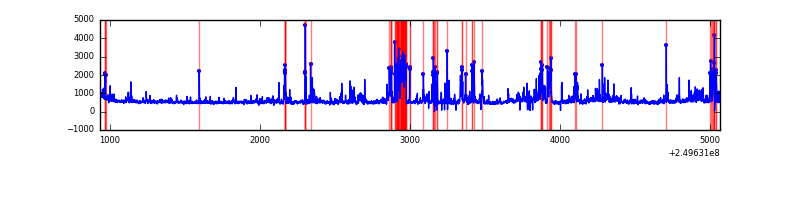 |
| C | 4133 | 4132 | 0 | 0 | 0.00% | 0.00% | 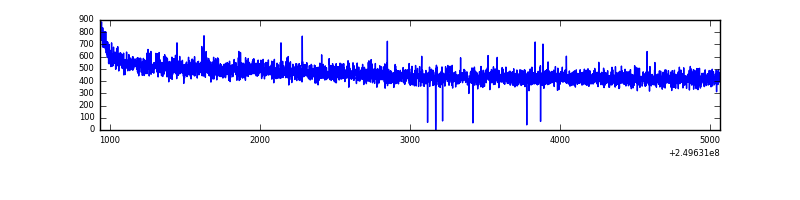 |
| D | 4133 | 4133 | 56 | 56 | 1.35% | 1.35% | 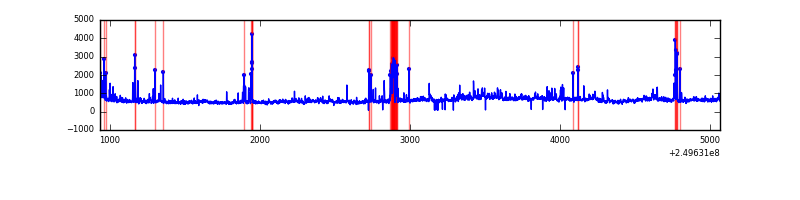 |
Top three noisy pixels from each quadrant. If the there are fewer than three noisy pixels in the level2.evt file, extra rows are filled as -1
| Pixel properties | Quadrant properties | ||||||
|---|---|---|---|---|---|---|---|
| Quadrant | DetID | PixID | Counts | Sigma | Mean | Median | Sigma |
| A | 8 | 15 | 232301 | 2301.11 | 496 | 487 | 100.7 |
| A | 1 | 162 | 81537 | 804.55 | 496 | 487 | 100.7 |
| A | 1 | 178 | 46852 | 460.24 | 496 | 487 | 100.7 |
| B | 4 | 239 | 434545 | 4776.01 | 489 | 480 | 90.9 |
| B | 15 | 204 | 191807 | 2105.17 | 489 | 480 | 90.9 |
| B | 3 | 64 | 139652 | 1531.31 | 489 | 480 | 90.9 |
| C | 13 | 61 | 3678 | 28.73 | 486 | 490 | 111.0 |
| C | 12 | 4 | 1846 | 12.22 | 486 | 490 | 111.0 |
| C | 8 | 222 | 1549 | 9.54 | 486 | 490 | 111.0 |
| D | 8 | 195 | 508721 | 4444.33 | 480 | 467 | 114.4 |
| D | 1 | 52 | 107091 | 932.35 | 480 | 467 | 114.4 |
| D | 4 | 95 | 91543 | 796.4 | 480 | 467 | 114.4 |
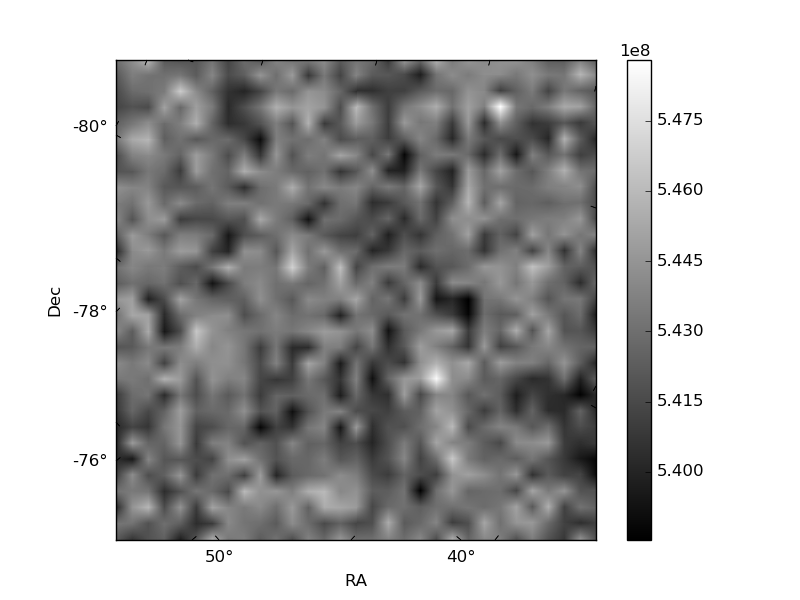
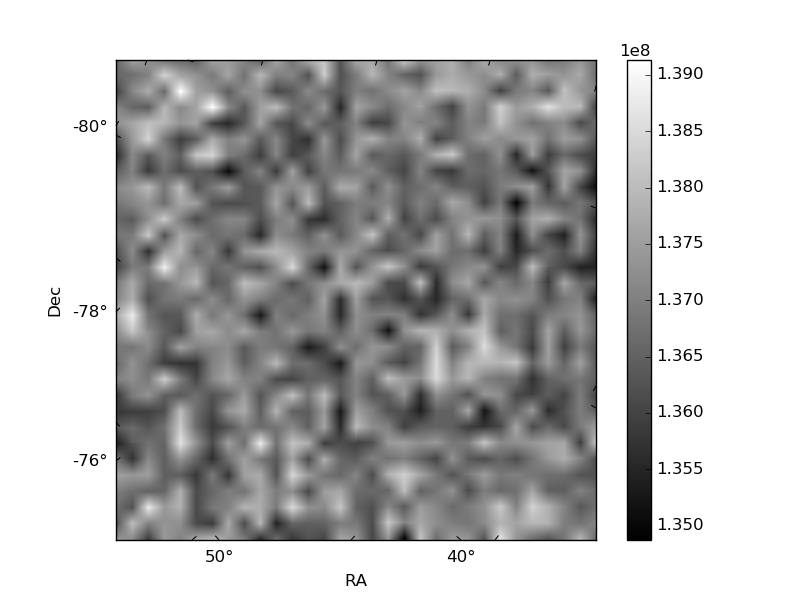
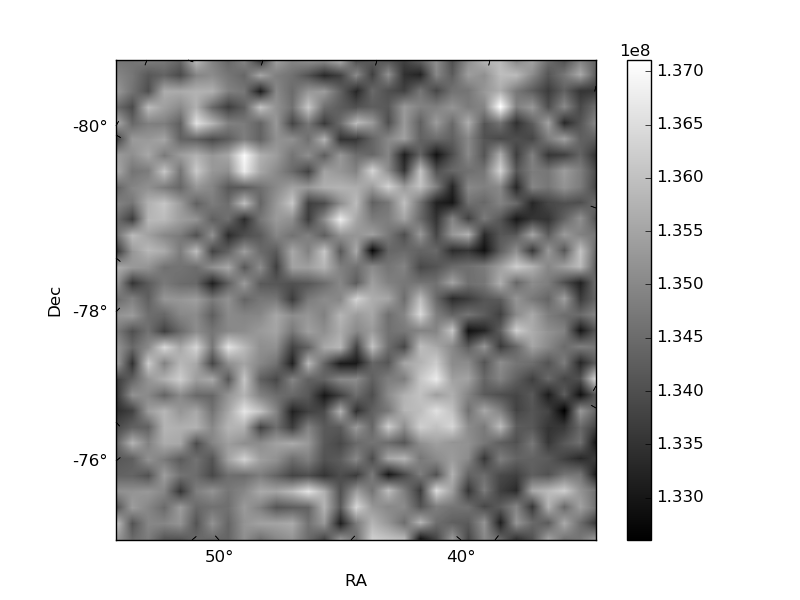
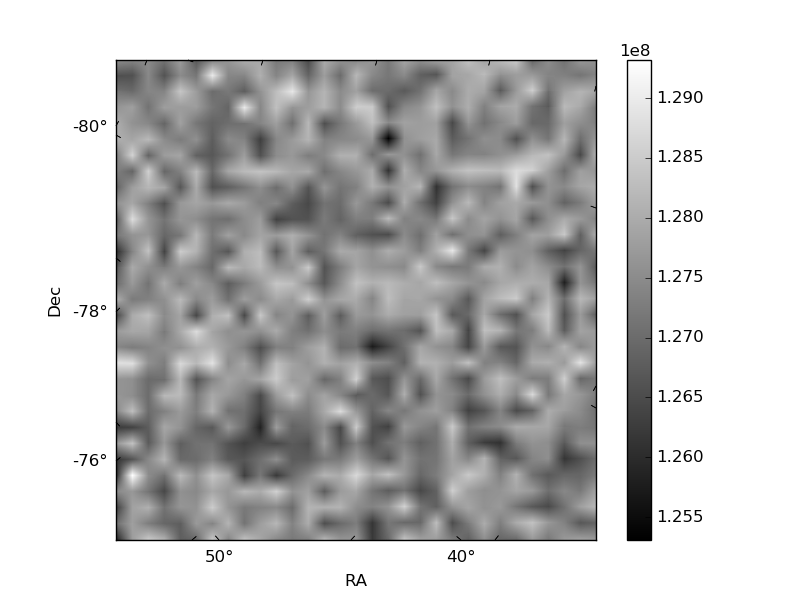
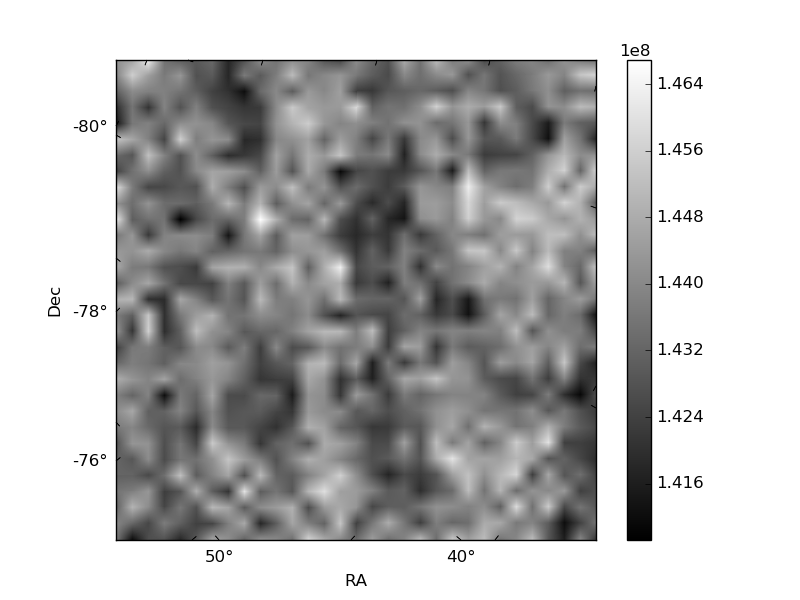
Histogram calculated using DETX and DETY for each event in the final _common_clean file
| Quadrant A | 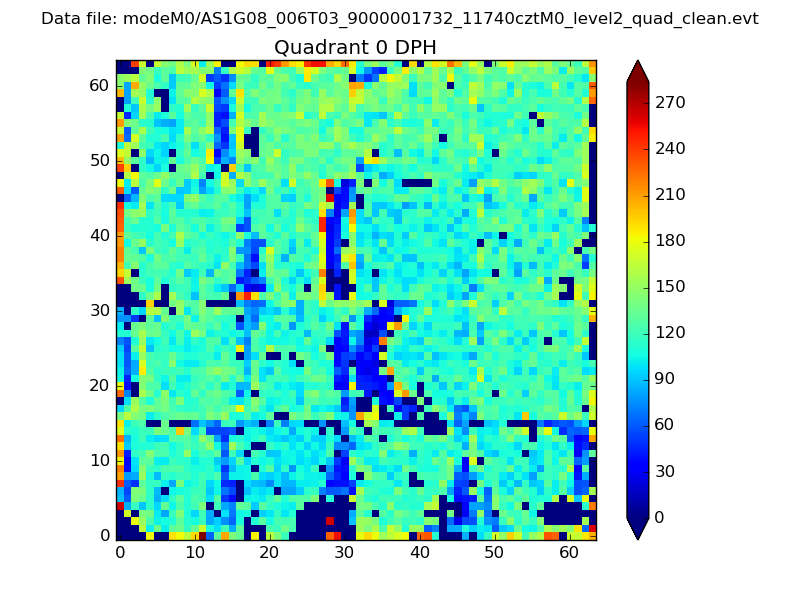 |
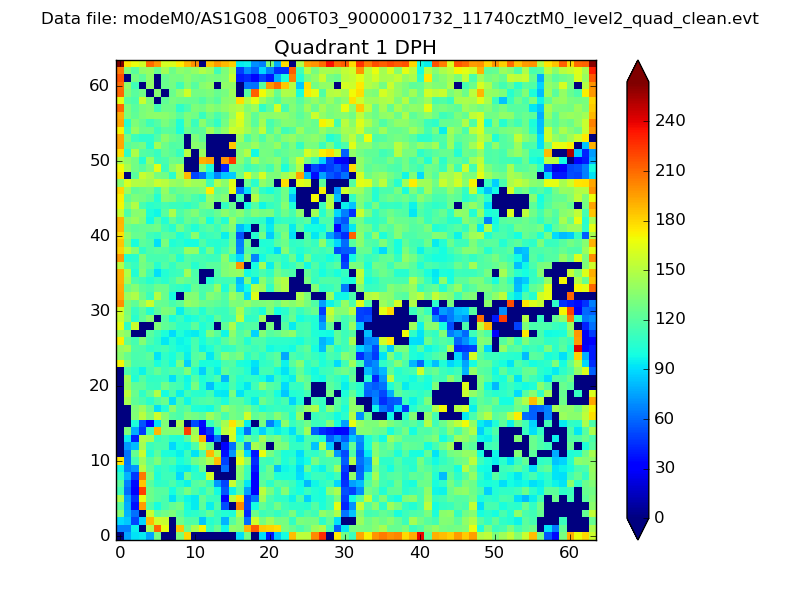 |
Quadrant B |
|---|---|---|---|
| Quadrant D | 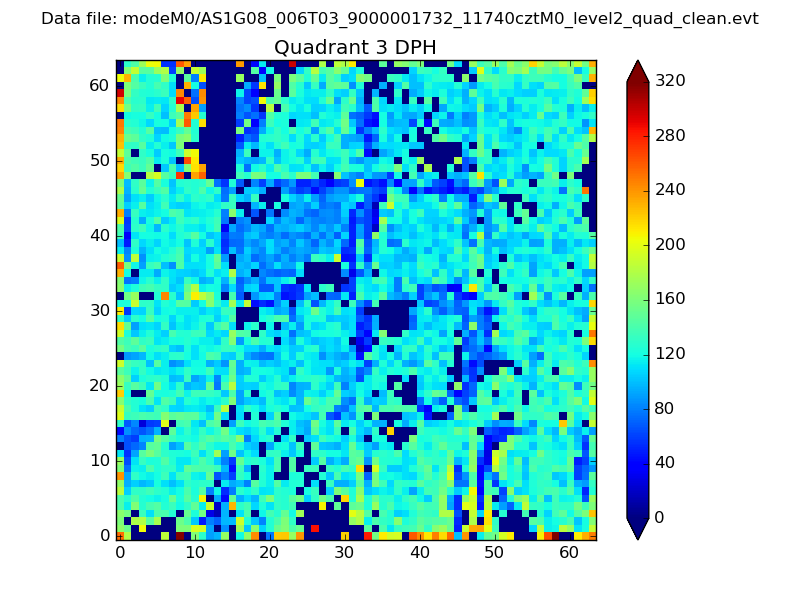 |
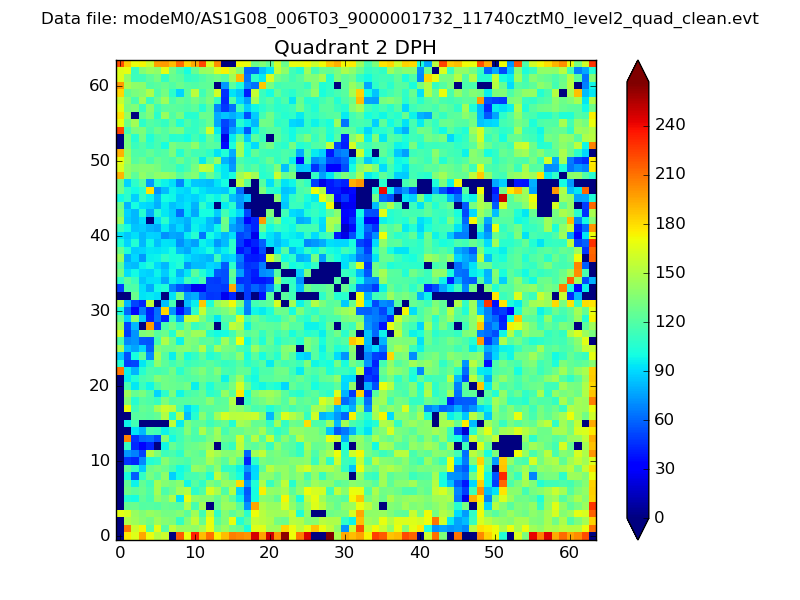 |
Quadrant C |
| Plot type | Count rate plots | Images |
|---|---|---|
| Comparison with Poisson distribution Blue bars denote a histogram of data divided into 1 sec bins. Red curve is a Poisson curve with rate = median count rate of data. |
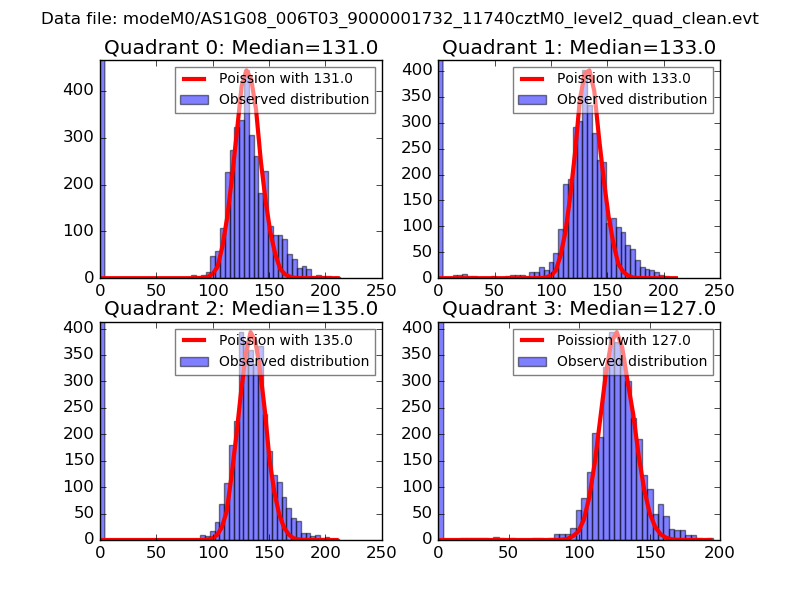 |
 |
| Quadrant-wise count rates Data is divided into 100 sec bins |
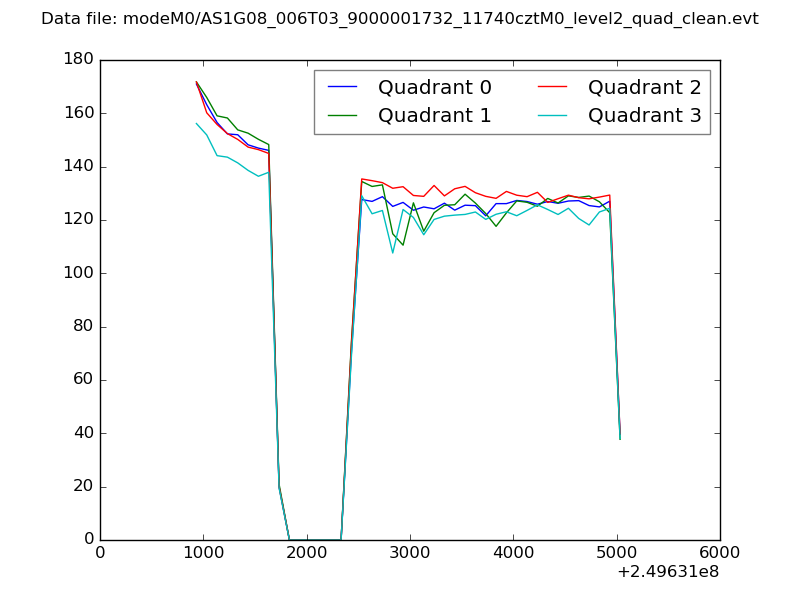 |
|
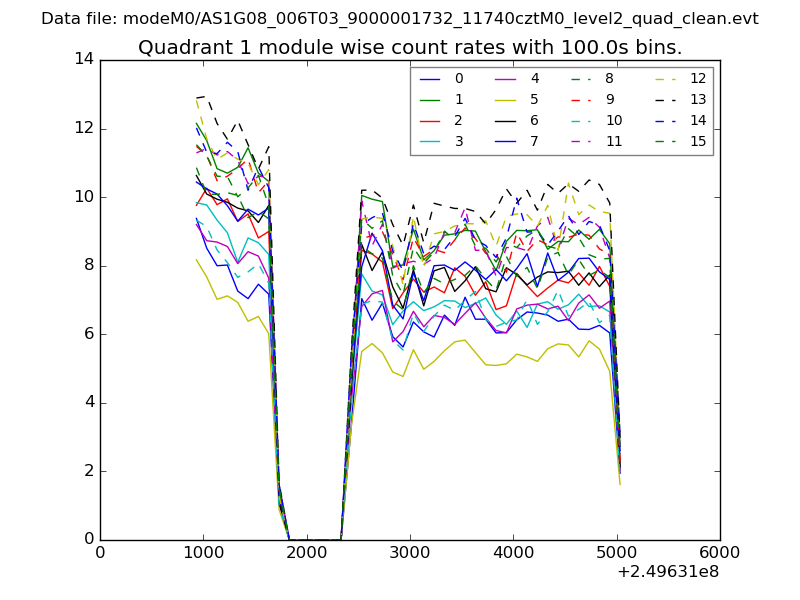
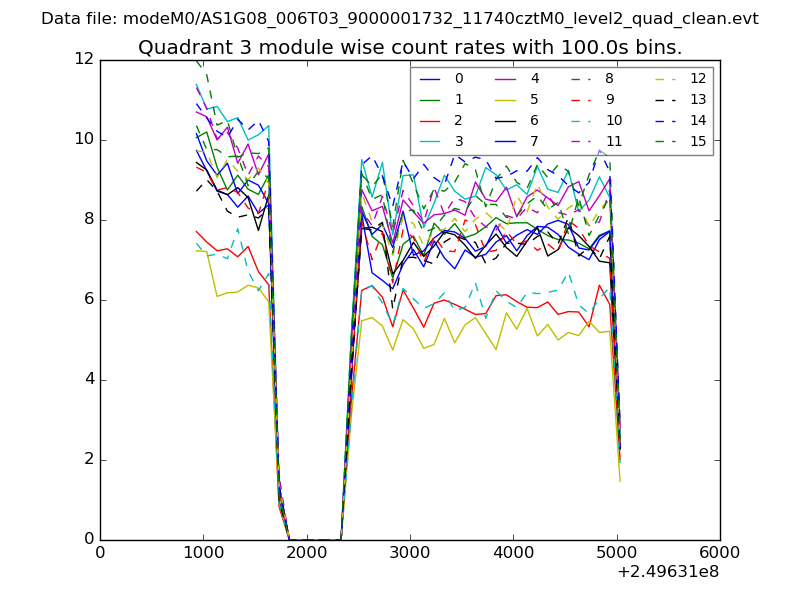
| Module-wise count rates for Quadrant A Data is divided into 100 sec bins |
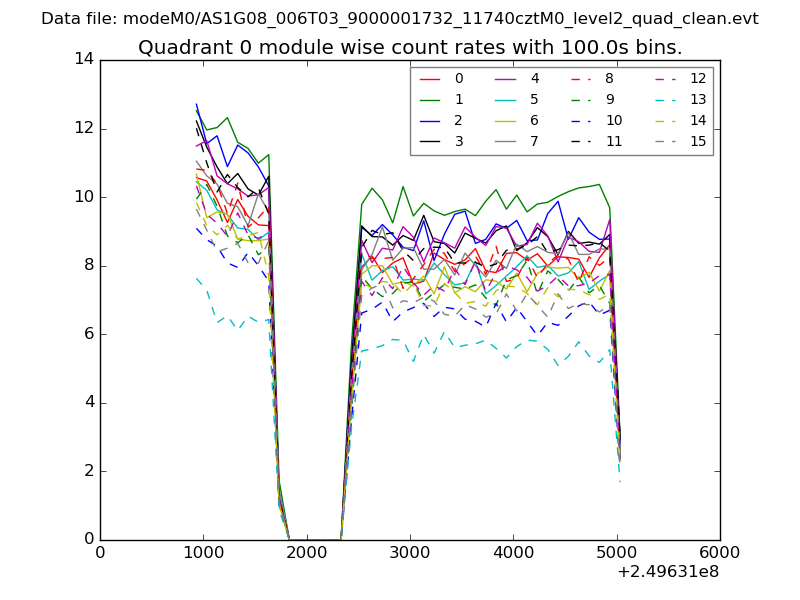 |
 |
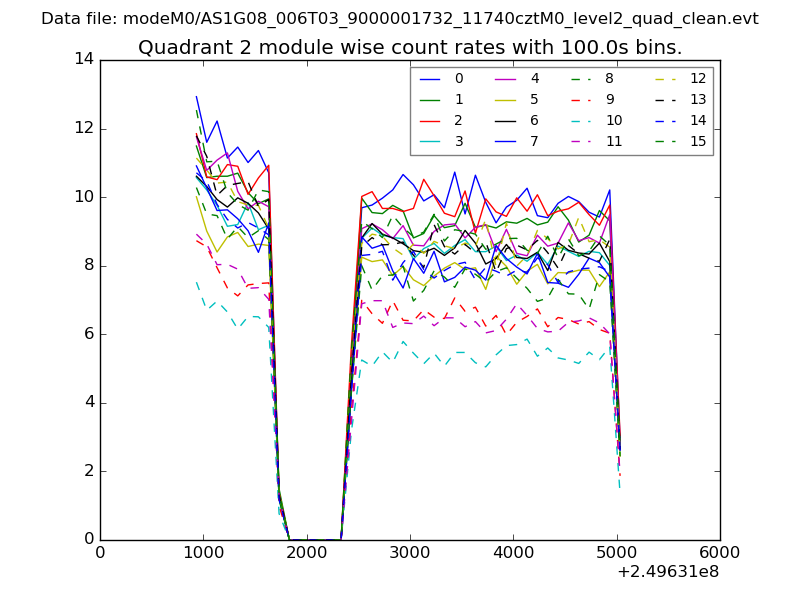
| Module-wise count rates for Quadrant B Data is divided into 100 sec bins |
 |
 |
| Module-wise count rates for Quadrant C Data is divided into 100 sec bins |
 |
 |
| Module-wise count rates for Quadrant D Data is divided into 100 sec bins |
 |
 |
| Parameter | Plot |
|---|---|
| CZT HV Monitor | 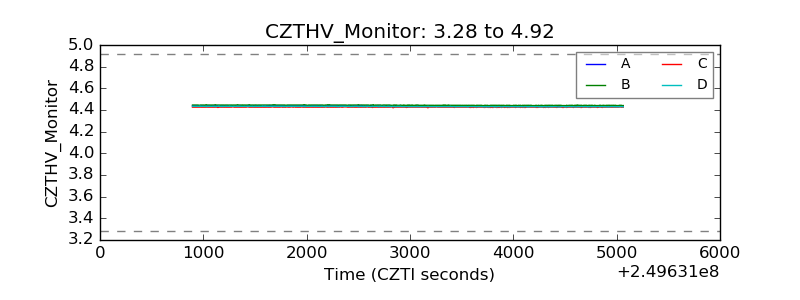 |
| D_VDD | 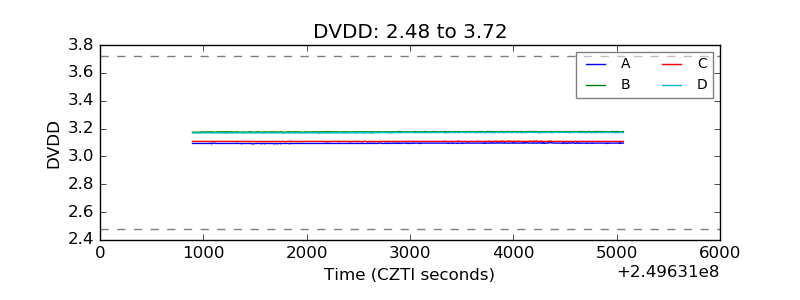 |
| Temperature 1 | 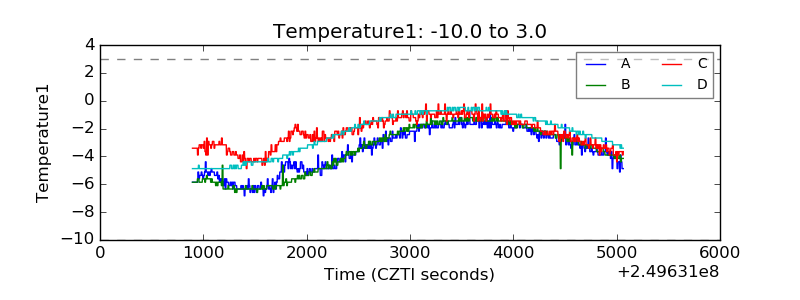 |
| Veto HV Monitor | 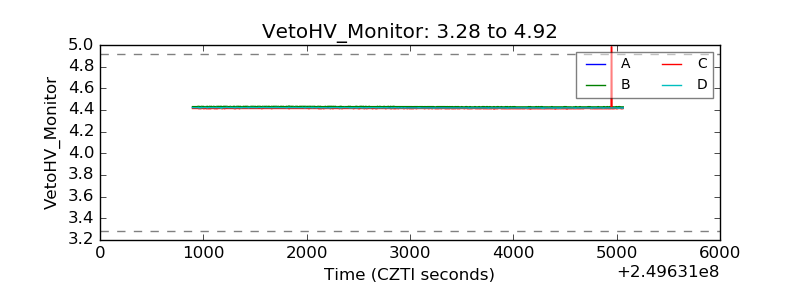 |
| Veto LLD | 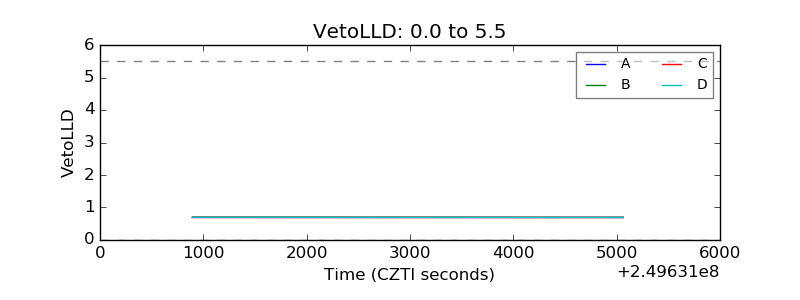 |
| Alpha Counter | 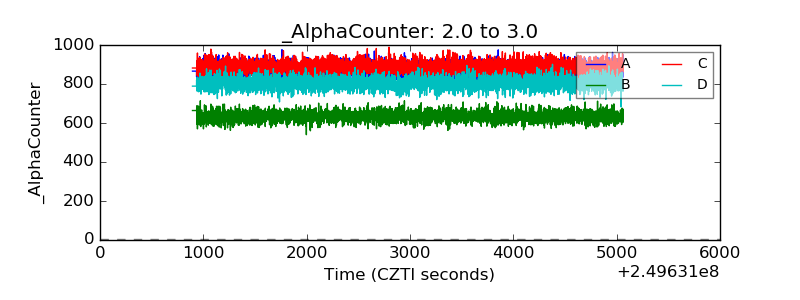 |
| _CPM_Rate | 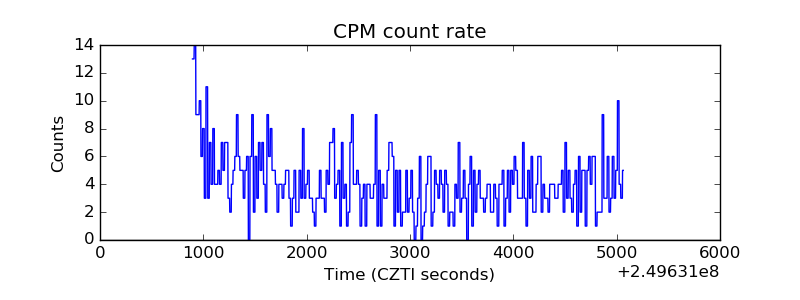 |
| CZT Counter | 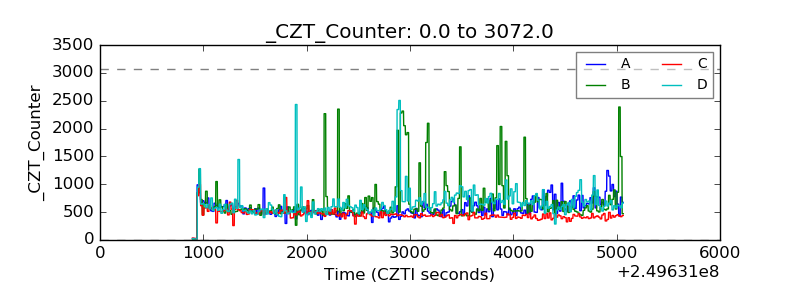 |
| +2.5 Volts monitor |  |
| +5 Volts monitor |  |
| _ROLL_ROT | 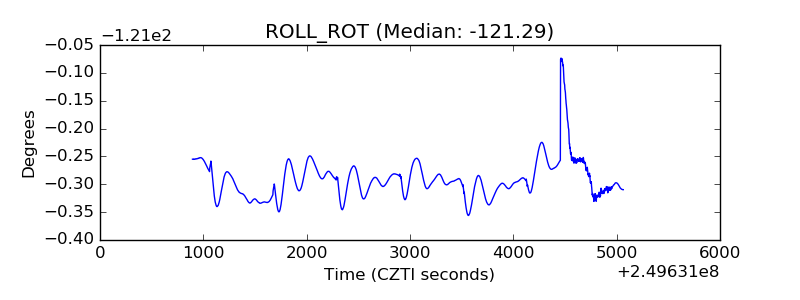 |
| _Roll_DEC | 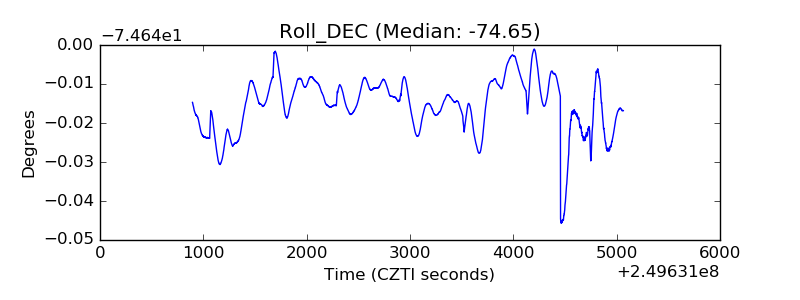 |
| _Roll_RA | 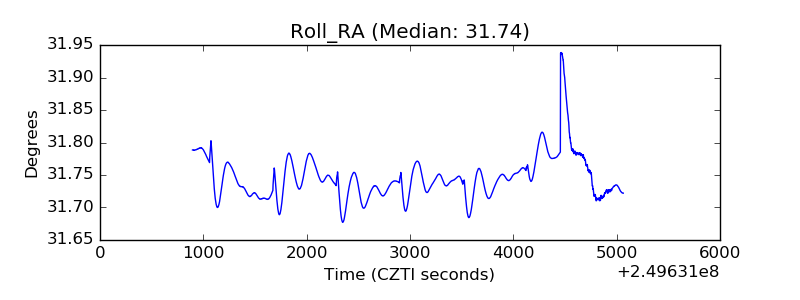 |
| Veto Counter | 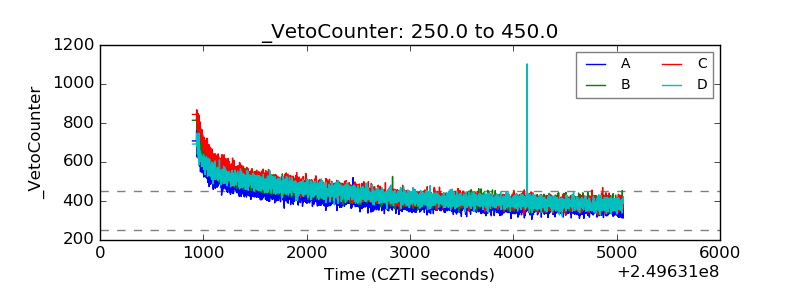 |