| Param | Original file | Final file |
|---|---|---|
| Filename | modeM0/AS1A04_113T03_9000001738cztM0_level2.fits | modeM0/AS1A04_113T03_9000001738cztM0_level2_quad_clean.evt |
| Size (bytes) | 606,954,240 | 582,160,320 |
| Size | 578.8 MB | 555.2 MB |
| Events in quadrant A | 3,699,226 | 3,544,214 |
| Events in quadrant B | 3,521,588 | 3,351,062 |
| Events in quadrant C | 3,726,954 | 3,452,288 |
| Events in quadrant D | 3,038,240 | 2,891,149 |
| Mode M0 | |||
|---|---|---|---|
| Quadrant | BADHDUFLAG | Total packets | Discarded packets |
| A | 0 | 156072 | 0 |
| B | 0 | 173330 | 0 |
| C | 0 | 132123 | 0 |
| D | 0 | 208231 | 0 |
| Mode SS | |||
|---|---|---|---|
| Quadrant | BADHDUFLAG | Total packets | Discarded packets |
| A | 0 | 1304 | 0 |
| B | 0 | 1304 | 0 |
| C | 0 | 1304 | 0 |
| D | 0 | 1304 | 0 |
| Mode M9 | |||
|---|---|---|---|
| Quadrant | BADHDUFLAG | Total packets | Discarded packets |
| A | 0 | 96 | 0 |
| B | 0 | 96 | 0 |
| C | 0 | 96 | 0 |
| D | 0 | 96 | 0 |
| Quadrant | Total seconds | Saturated seconds | Saturation percentage |
|---|---|---|---|
| A | 64023 | 1333 | 2.082064% |
| B | 64023 | 3961 | 6.186839% |
| C | 64023 | 563 | 0.879371% |
| D | 64023 | 6402 | 9.999531% |
Noise dominated data is calculated using 1-second bins in cleaned event files. If a bin has >2000 counts, and if more than 50% of those come from <1% of pixels, then it is considered to be noise-dominated and hence unusable.
| Quadrant | # 1 sec bins | Bins with >0 counts | Bins with >2000 counts | High rate bins dominated by noise | Noise dominated (total time) | Noise dominated (detector-on time) | Marked lightcurve |
|---|---|---|---|---|---|---|---|
| A | 73617 | 64023 | 0 | 0 | 0.00% | 0.00% |  |
| B | 73617 | 63979 | 0 | 0 | 0.00% | 0.00% |  |
| C | 73617 | 64023 | 0 | 0 | 0.00% | 0.00% |  |
| D | 73617 | 63980 | 0 | 0 | 0.00% | 0.00% |  |
Top three noisy pixels from each quadrant. If the there are fewer than three noisy pixels in the level2.evt file, extra rows are filled as -1
| Pixel properties | Quadrant properties | ||||||
|---|---|---|---|---|---|---|---|
| Quadrant | DetID | PixID | Counts | Sigma | Mean | Median | Sigma |
| A | 0 | 29 | 3620 | 11.26 | 963 | 902 | 241.4 |
| A | 7 | 110 | 2931 | 8.4 | 963 | 902 | 241.4 |
| A | 0 | 30 | 2814 | 7.92 | 963 | 902 | 241.4 |
| B | 2 | 9 | 3055 | 12.04 | 930 | 888 | 180.0 |
| B | 3 | 17 | 2374 | 8.25 | 930 | 888 | 180.0 |
| B | 14 | 254 | 2350 | 8.12 | 930 | 888 | 180.0 |
| C | 12 | 241 | 2681 | 7.03 | 983 | 918 | 250.7 |
| C | 2 | 191 | 2502 | 6.32 | 983 | 918 | 250.7 |
| C | 3 | 126 | 2455 | 6.13 | 983 | 918 | 250.7 |
| D | 3 | 14 | 2275 | 6.4 | 867 | 790 | 232.1 |
| D | 6 | 231 | 2267 | 6.36 | 867 | 790 | 232.1 |
| D | 6 | 38 | 2176 | 5.97 | 867 | 790 | 232.1 |
Histogram calculated using DETX and DETY for each event in the final _common_clean file
| Quadrant A | 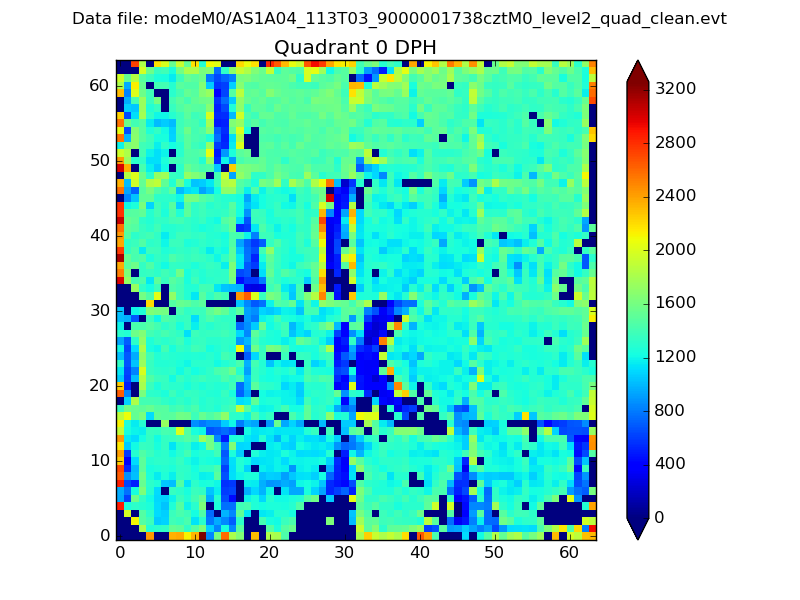 |
 |
Quadrant B |
|---|---|---|---|
| Quadrant D | 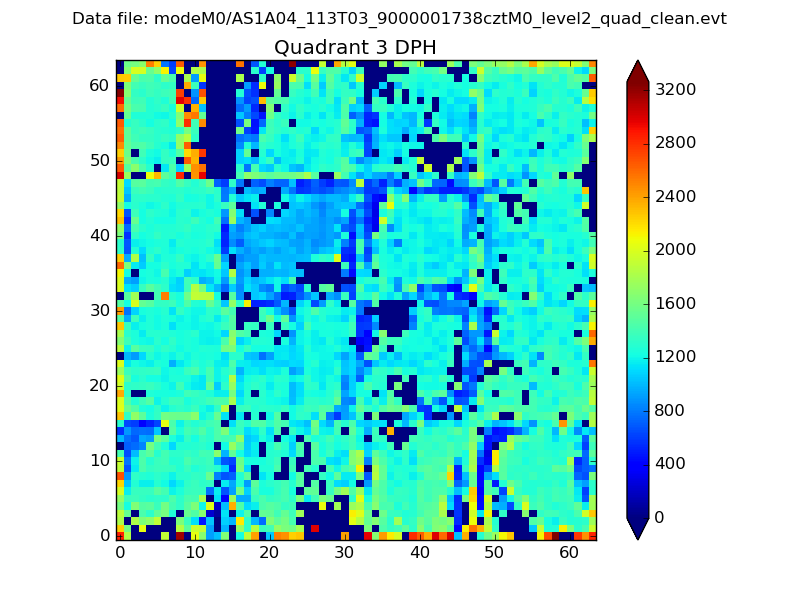 |
 |
Quadrant C |
| Plot type | Count rate plots | Images |
|---|---|---|
| Comparison with Poisson distribution Blue bars denote a histogram of data divided into 1 sec bins. Red curve is a Poisson curve with rate = median count rate of data. |
 |
 |
| Quadrant-wise count rates Data is divided into 100 sec bins |
 |
|
| Module-wise count rates for Quadrant A Data is divided into 100 sec bins |
 |
 |
| Module-wise count rates for Quadrant B Data is divided into 100 sec bins |
 |
 |
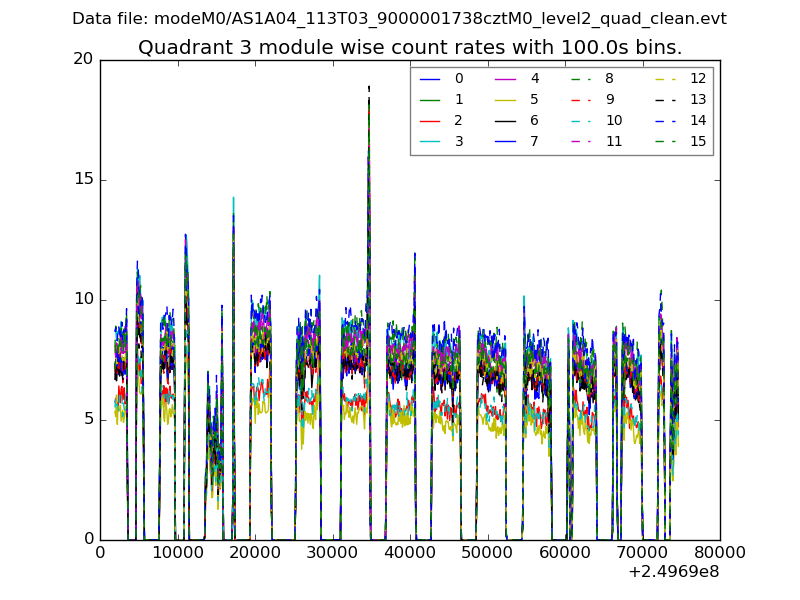
| Module-wise count rates for Quadrant C Data is divided into 100 sec bins |
 |
 |
| Module-wise count rates for Quadrant D Data is divided into 100 sec bins |
 |
 |
| Parameter | Plot |
|---|---|
| CZT HV Monitor |  |
| D_VDD | 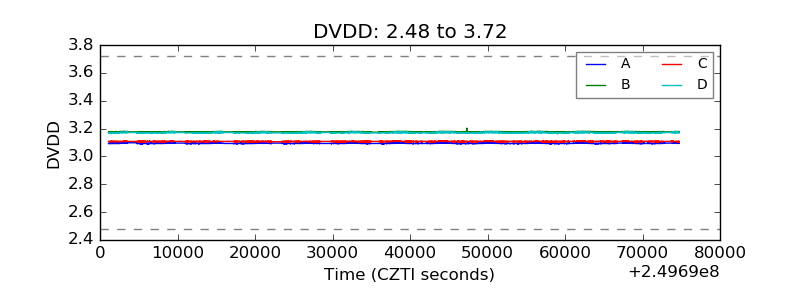 |
| Temperature 1 |  |
| Veto HV Monitor | 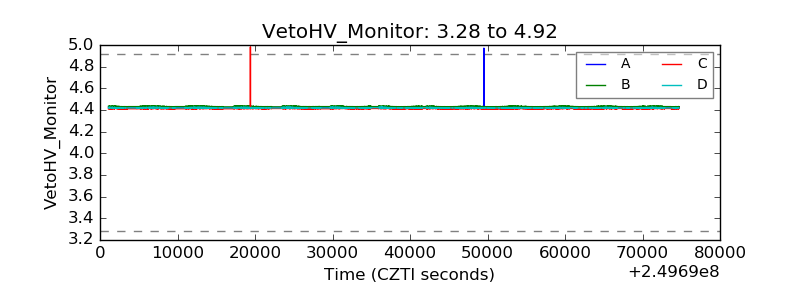 |
| Veto LLD | 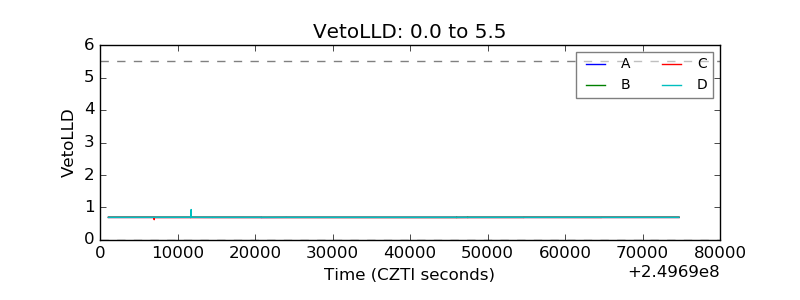 |
| Alpha Counter |  |
| _CPM_Rate |  |
| CZT Counter |  |
| +2.5 Volts monitor |  |
| +5 Volts monitor |  |
| _ROLL_ROT |  |
| _Roll_DEC | 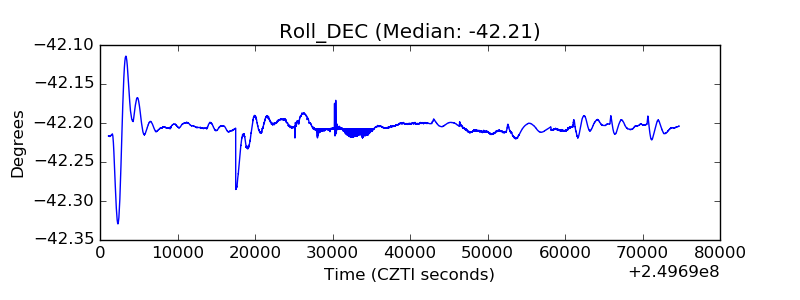 |
| _Roll_RA |  |
| Veto Counter |  |