| Param | Original file | Final file |
|---|---|---|
| Filename | modeM0/AS1A04_113T03_9000001738_11750cztM0_level2.evt | modeM0/AS1A04_113T03_9000001738_11750cztM0_level2_quad_clean.evt |
| Size (bytes) | 325,719,360 | 54,912,960 |
| Size | 310.6 MB | 52.4 MB |
| Events in quadrant A | 2,439,767 | 343,901 |
| Events in quadrant B | 2,580,669 | 352,389 |
| Events in quadrant C | 1,895,297 | 354,031 |
| Events in quadrant D | 2,676,619 | 330,426 |
| Mode M0 | |||
|---|---|---|---|
| Quadrant | BADHDUFLAG | Total packets | Discarded packets |
| A | 0 | 9830 | 2 |
| B | 0 | 10217 | 1 |
| C | 0 | 8162 | 1 |
| D | 0 | 10694 | 1 |
| Mode SS | |||
|---|---|---|---|
| Quadrant | BADHDUFLAG | Total packets | Discarded packets |
| A | 0 | 82 | 0 |
| B | 0 | 82 | 0 |
| C | 0 | 82 | 0 |
| D | 0 | 82 | 0 |
| Mode M9 | |||
|---|---|---|---|
| Quadrant | BADHDUFLAG | Total packets | Discarded packets |
| A | 0 | 12 | 0 |
| B | 0 | 12 | 0 |
| C | 0 | 12 | 0 |
| D | 0 | 12 | 0 |
| Quadrant | Total seconds | Saturated seconds | Saturation percentage |
|---|---|---|---|
| A | 3994 | 21 | 0.525789% |
| B | 3994 | 119 | 2.979469% |
| C | 3994 | 11 | 0.275413% |
| D | 3994 | 47 | 1.176765% |
Noise dominated data is calculated using 1-second bins in cleaned event files. If a bin has >2000 counts, and if more than 50% of those come from <1% of pixels, then it is considered to be noise-dominated and hence unusable.
| Quadrant | # 1 sec bins | Bins with >0 counts | Bins with >2000 counts | High rate bins dominated by noise | Noise dominated (total time) | Noise dominated (detector-on time) | Marked lightcurve |
|---|---|---|---|---|---|---|---|
| A | 5174 | 3995 | 0 | 0 | 0.00% | 0.00% | 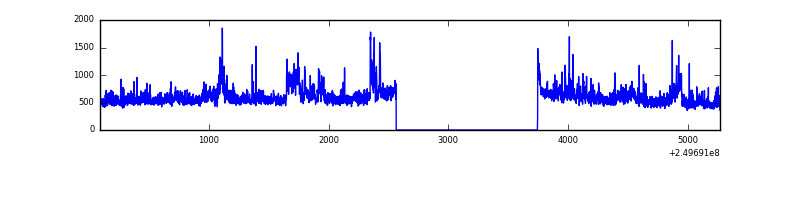 |
| B | 5174 | 3995 | 41 | 41 | 0.79% | 1.03% | 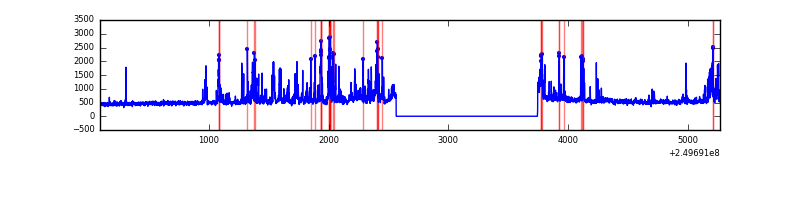 |
| C | 5174 | 3995 | 0 | 0 | 0.00% | 0.00% | 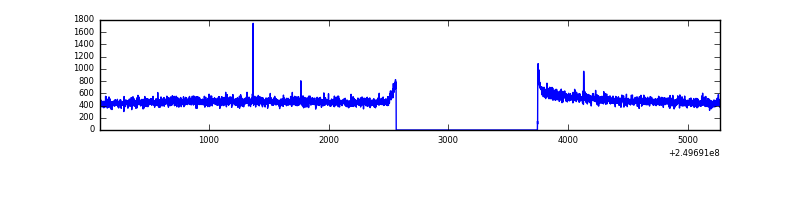 |
| D | 5174 | 3995 | 26 | 26 | 0.50% | 0.65% | 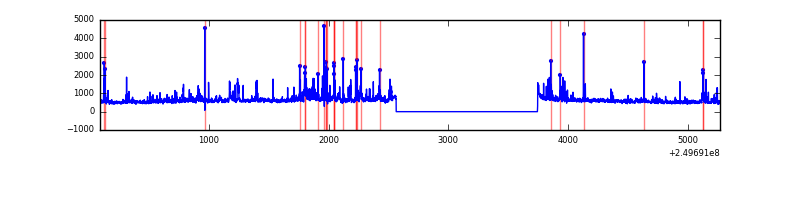 |
Top three noisy pixels from each quadrant. If the there are fewer than three noisy pixels in the level2.evt file, extra rows are filled as -1
| Pixel properties | Quadrant properties | ||||||
|---|---|---|---|---|---|---|---|
| Quadrant | DetID | PixID | Counts | Sigma | Mean | Median | Sigma |
| A | 8 | 15 | 357120 | 3512.09 | 493 | 482 | 101.5 |
| A | 1 | 162 | 53677 | 523.85 | 493 | 482 | 101.5 |
| A | 6 | 16 | 29402 | 284.8 | 493 | 482 | 101.5 |
| B | 4 | 239 | 445864 | 4733.36 | 495 | 485 | 94.1 |
| B | 15 | 204 | 61267 | 645.97 | 495 | 485 | 94.1 |
| B | 4 | 81 | 46362 | 487.57 | 495 | 485 | 94.1 |
| C | 12 | 4 | 5228 | 42.07 | 484 | 487 | 112.7 |
| C | 13 | 61 | 3638 | 27.96 | 484 | 487 | 112.7 |
| C | 14 | 234 | 1774 | 11.42 | 484 | 487 | 112.7 |
| D | 8 | 195 | 379076 | 3301.22 | 477 | 464 | 114.7 |
| D | 1 | 52 | 309151 | 2691.52 | 477 | 464 | 114.7 |
| D | 13 | 249 | 52163 | 450.78 | 477 | 464 | 114.7 |
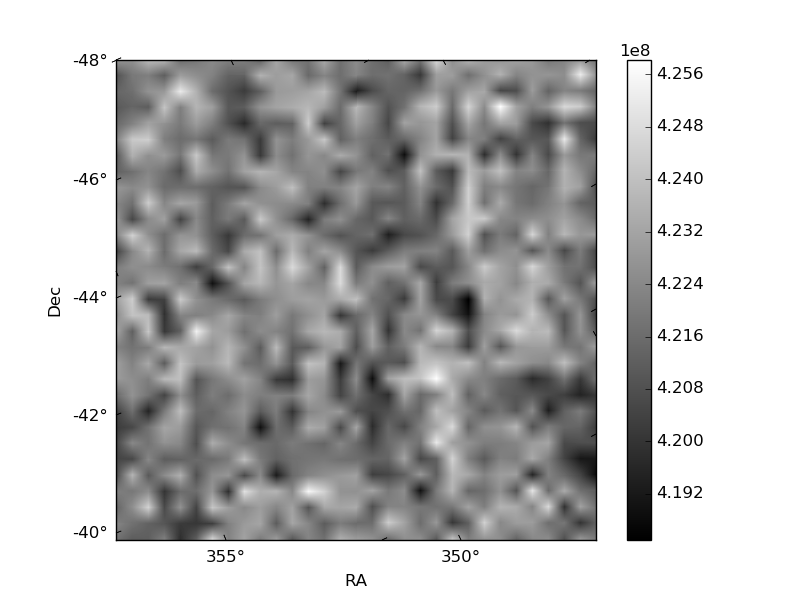
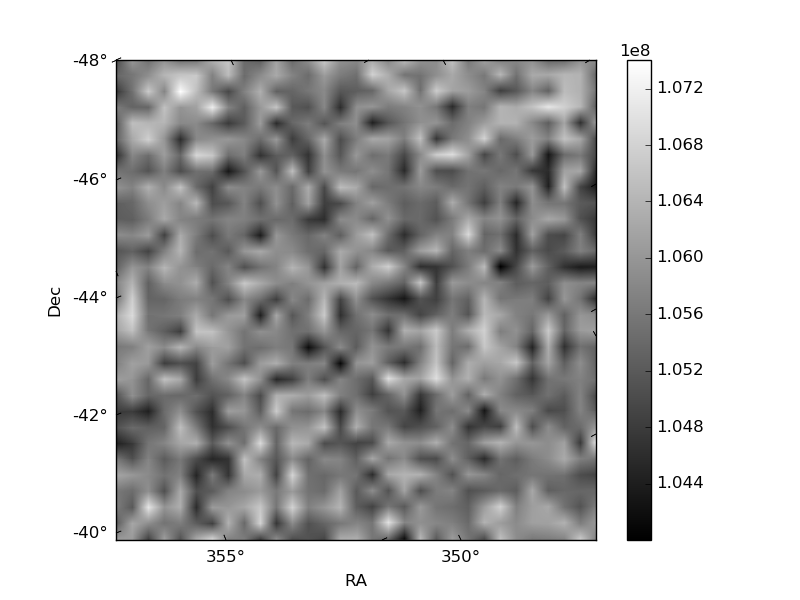
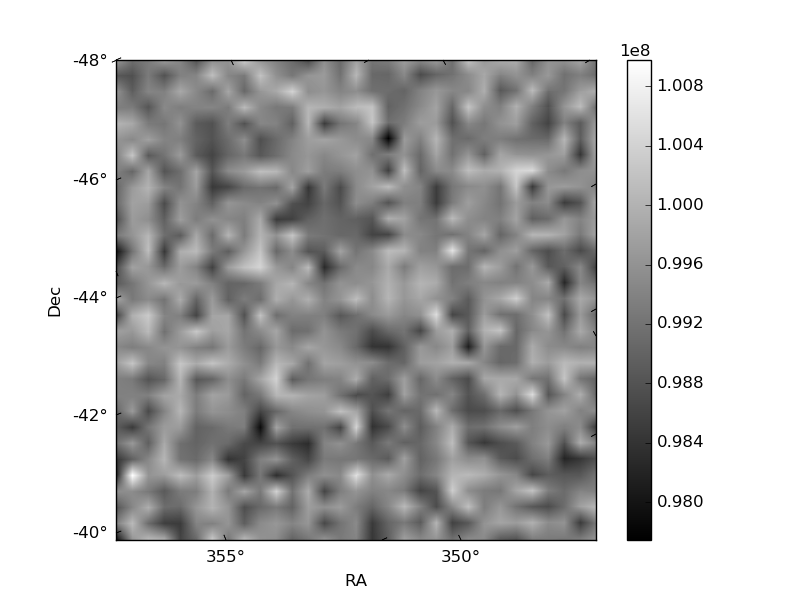
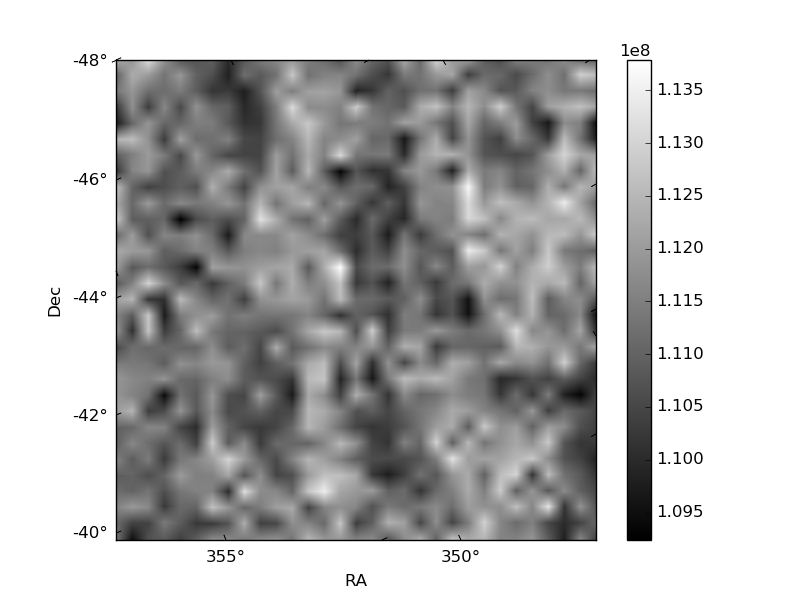
Histogram calculated using DETX and DETY for each event in the final _common_clean file
| Quadrant A | 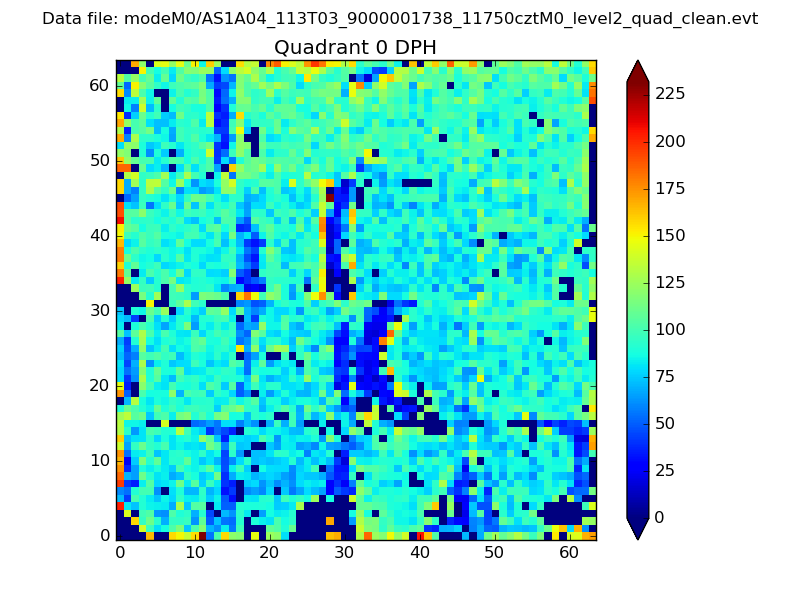 |
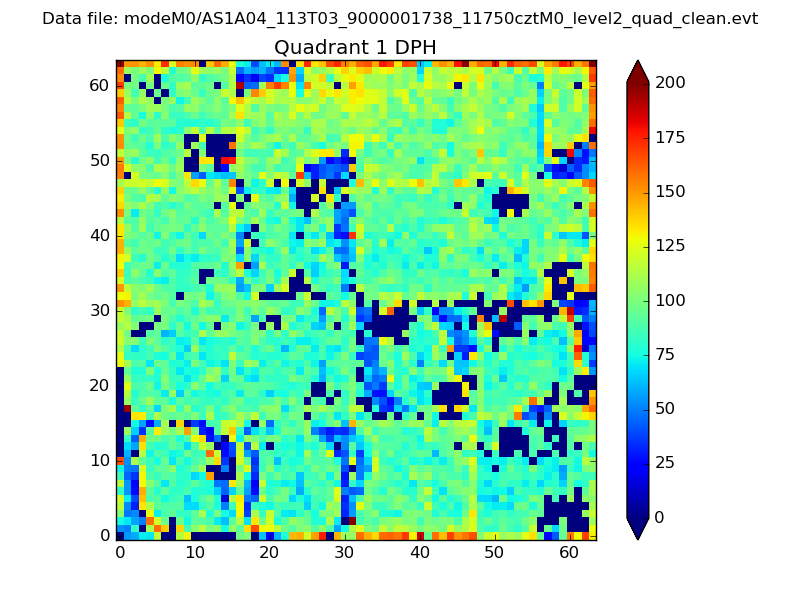 |
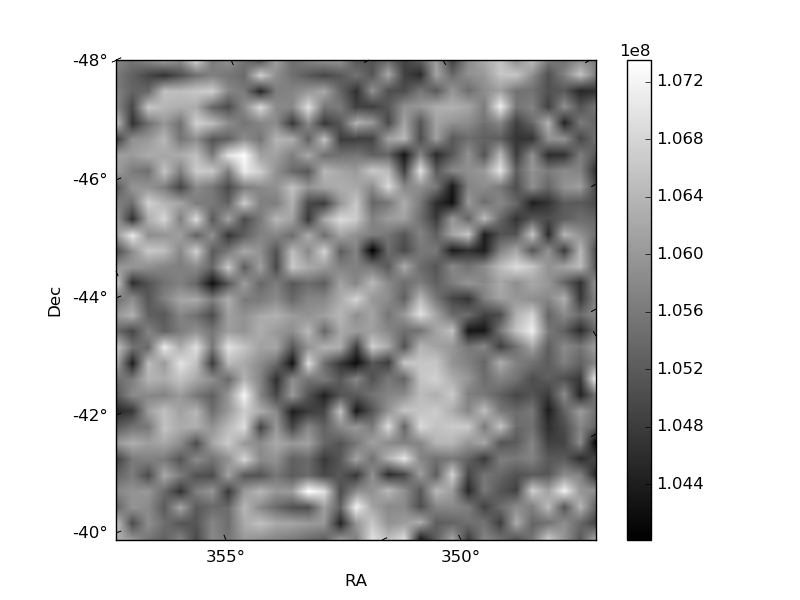
Quadrant B |
|---|---|---|---|
| Quadrant D | 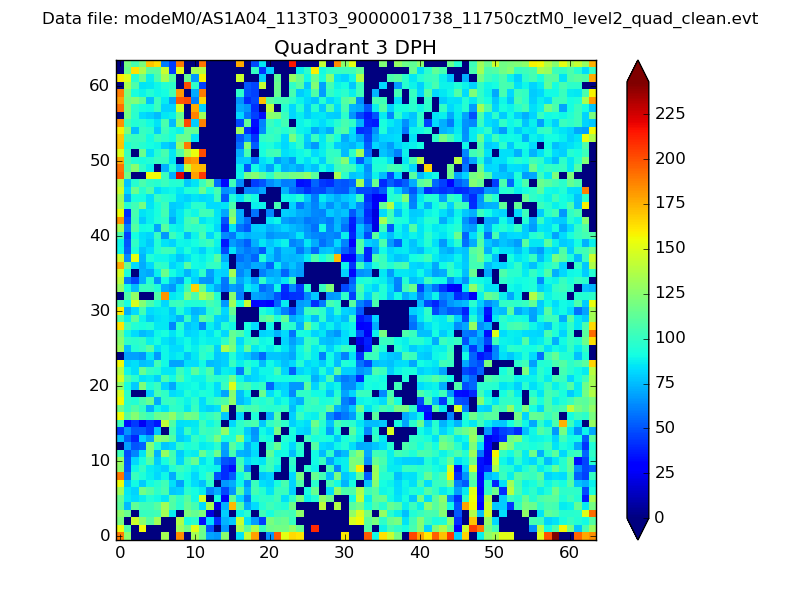 |
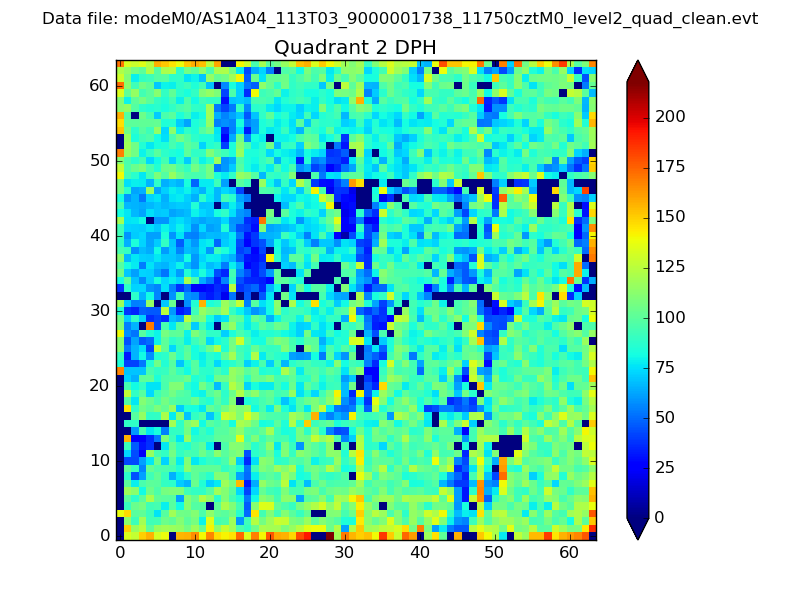 |
Quadrant C |
| Plot type | Count rate plots | Images |
|---|---|---|
| Comparison with Poisson distribution Blue bars denote a histogram of data divided into 1 sec bins. Red curve is a Poisson curve with rate = median count rate of data. |
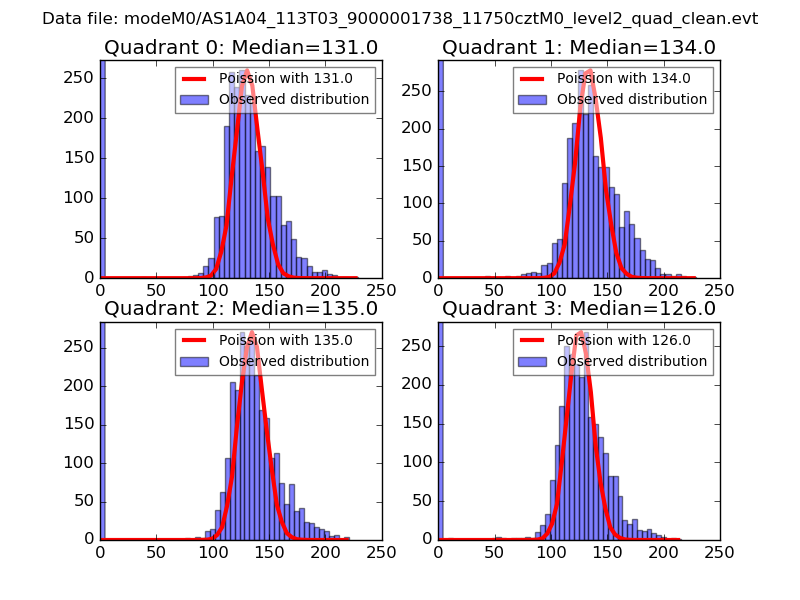 |
 |
| Quadrant-wise count rates Data is divided into 100 sec bins |
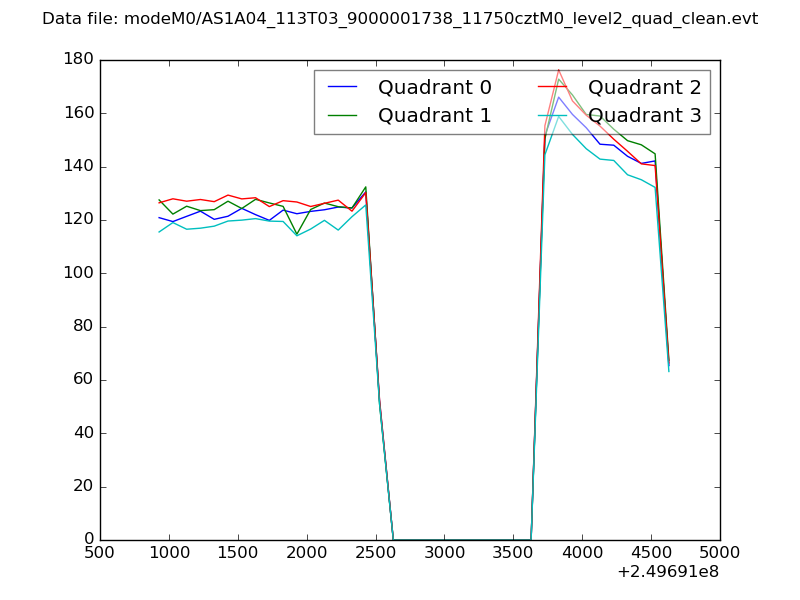 |
|
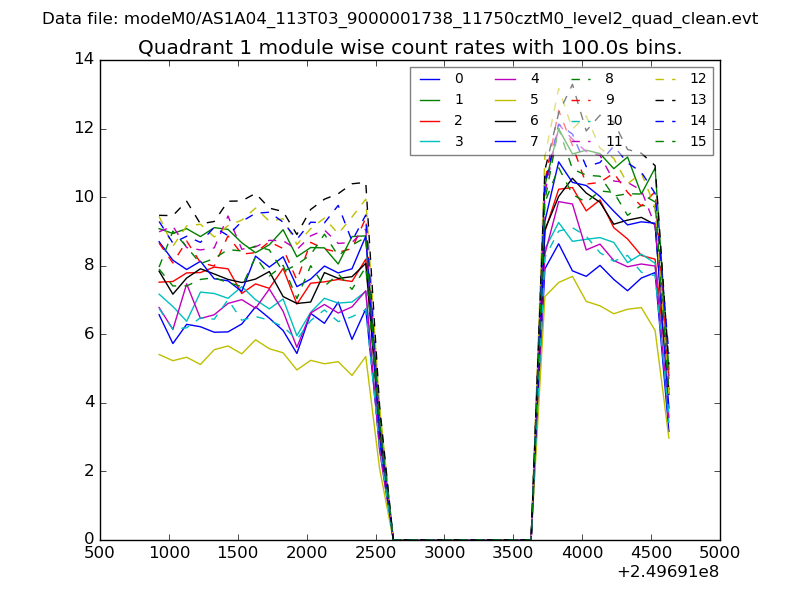
| Module-wise count rates for Quadrant A Data is divided into 100 sec bins |
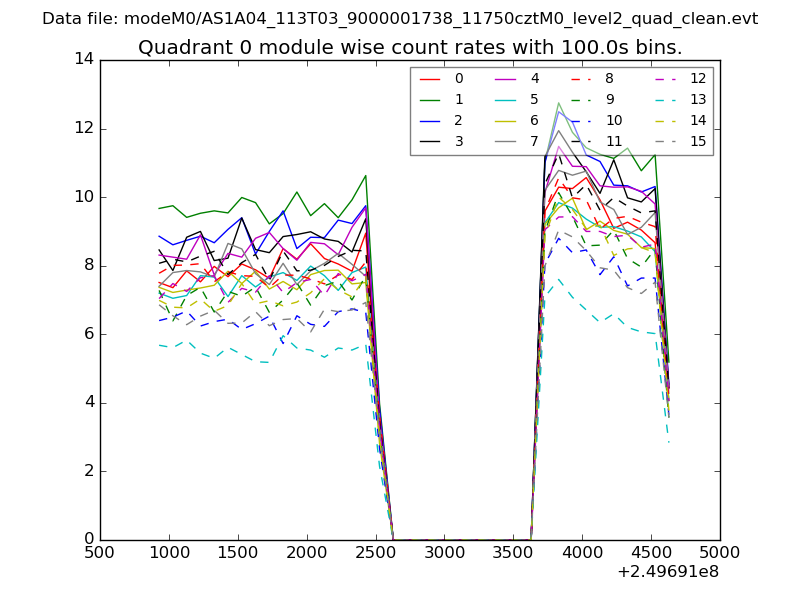 |
 |
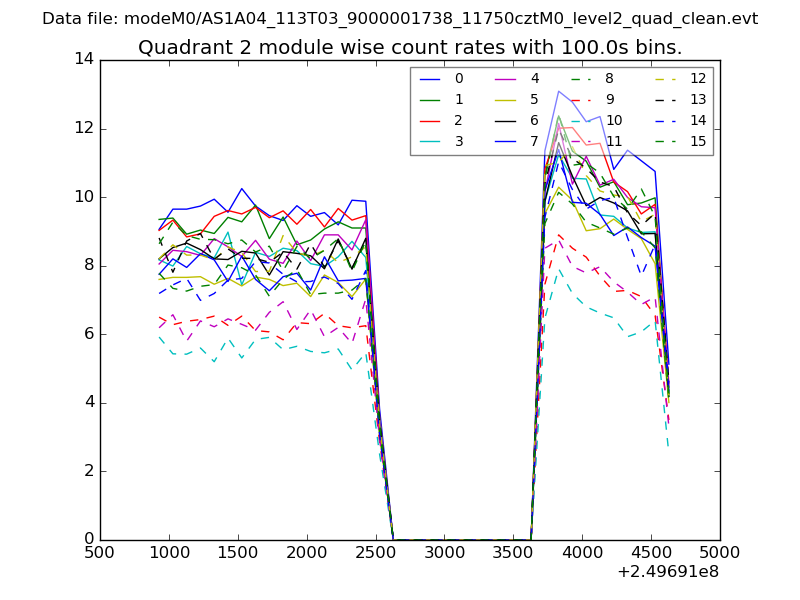
| Module-wise count rates for Quadrant B Data is divided into 100 sec bins |
 |
 |
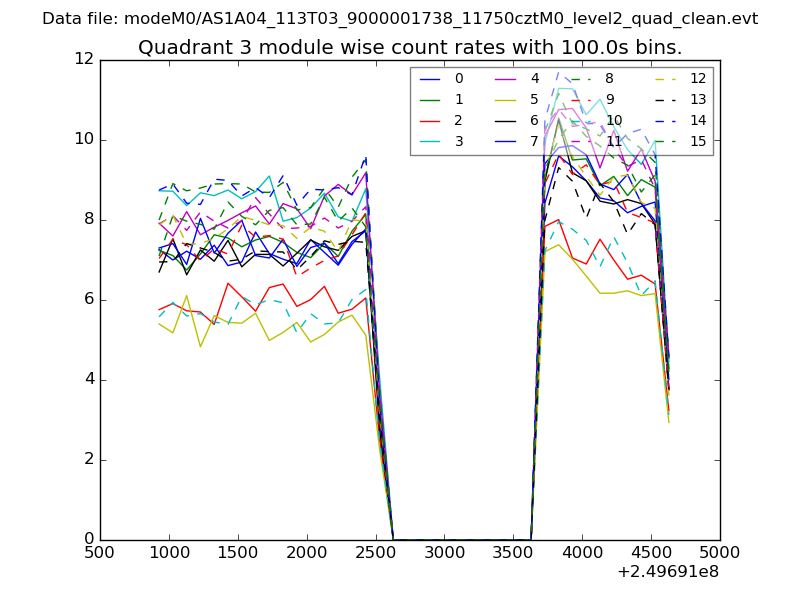
| Module-wise count rates for Quadrant C Data is divided into 100 sec bins |
 |
 |
| Module-wise count rates for Quadrant D Data is divided into 100 sec bins |
 |
 |
| Parameter | Plot |
|---|---|
| CZT HV Monitor | 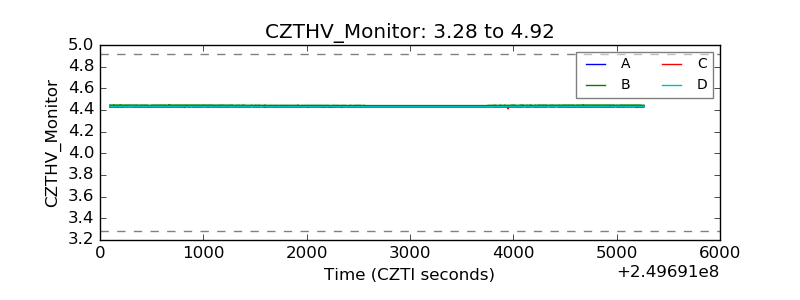 |
| D_VDD | 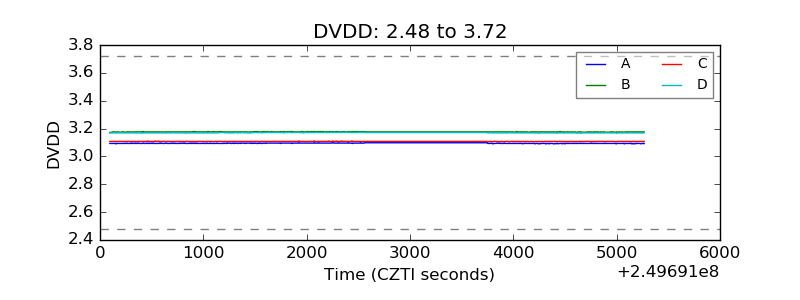 |
| Temperature 1 | 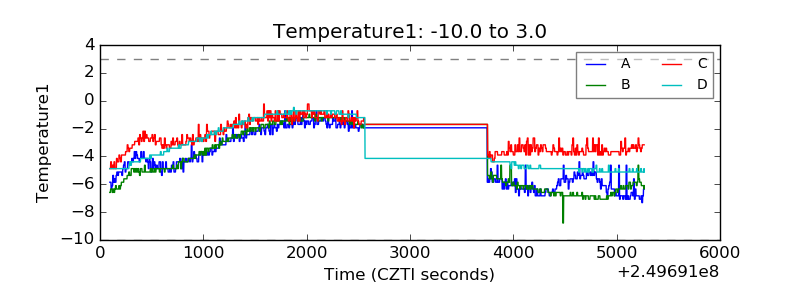 |
| Veto HV Monitor | 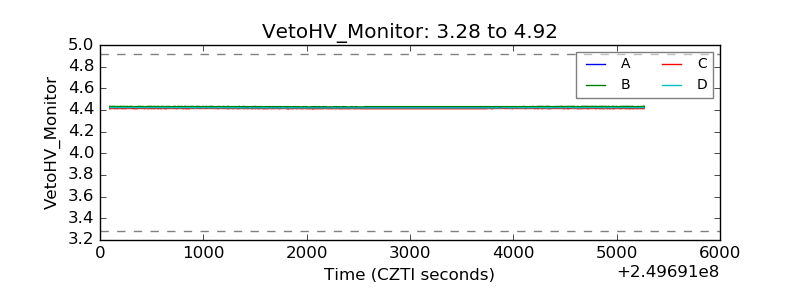 |
| Veto LLD | 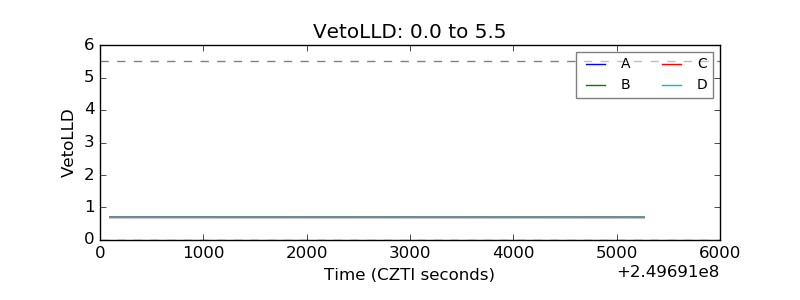 |
| Alpha Counter | 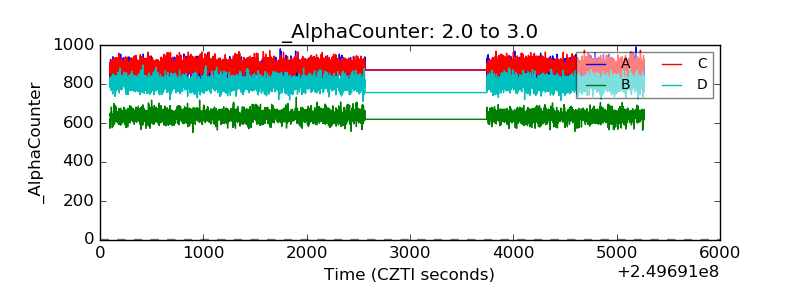 |
| _CPM_Rate | 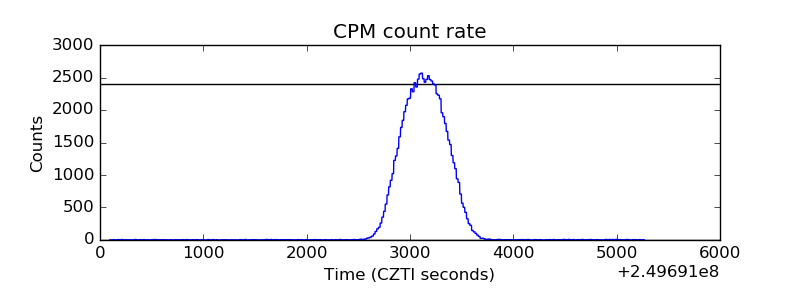 |
| CZT Counter | 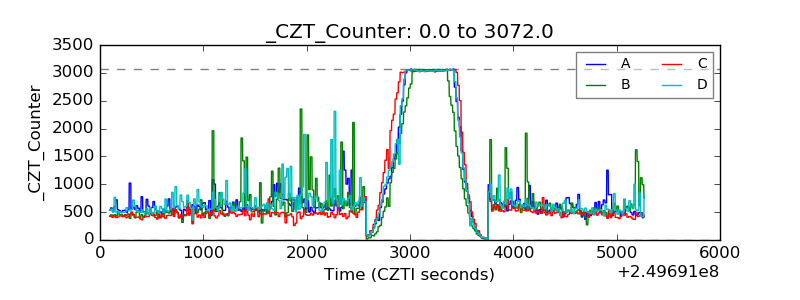 |
| +2.5 Volts monitor |  |
| +5 Volts monitor |  |
| _ROLL_ROT | 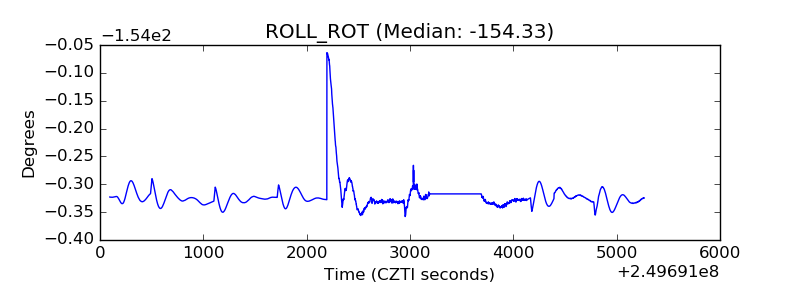 |
| _Roll_DEC | 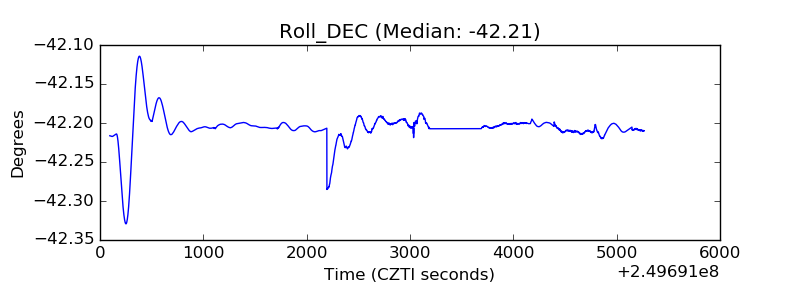 |
| _Roll_RA | 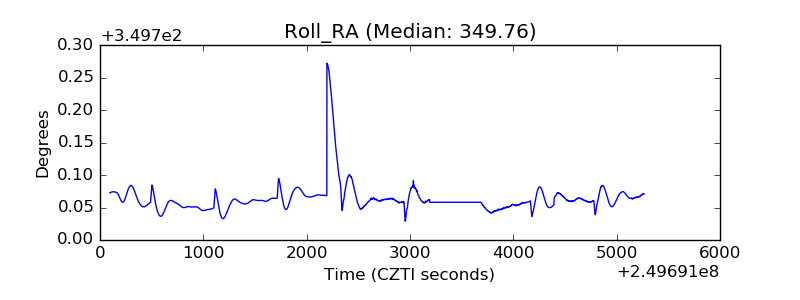 |
| Veto Counter | 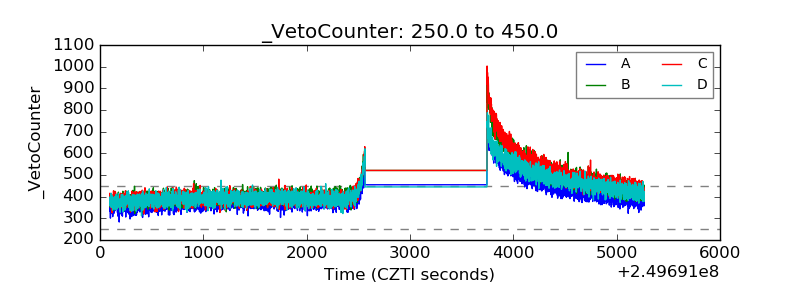 |