| Param | Original file | Final file |
|---|---|---|
| Filename | modeM0/AS1A04_113T03_9000001738_11751cztM0_level2.evt | modeM0/AS1A04_113T03_9000001738_11751cztM0_level2_quad_clean.evt |
| Size (bytes) | 565,280,640 | 78,560,640 |
| Size | 539.1 MB | 74.9 MB |
| Events in quadrant A | 3,708,775 | 485,661 |
| Events in quadrant B | 4,348,313 | 490,504 |
| Events in quadrant C | 3,102,334 | 497,489 |
| Events in quadrant D | 5,527,738 | 459,776 |
| Mode M0 | |||
|---|---|---|---|
| Quadrant | BADHDUFLAG | Total packets | Discarded packets |
| A | 0 | 15125 | 3 |
| B | 0 | 17044 | 2 |
| C | 0 | 13227 | 2 |
| D | 0 | 20714 | 2 |
| Mode SS | |||
|---|---|---|---|
| Quadrant | BADHDUFLAG | Total packets | Discarded packets |
| A | 0 | 130 | 0 |
| B | 0 | 130 | 0 |
| C | 0 | 130 | 0 |
| D | 0 | 130 | 0 |
| Mode M9 | |||
|---|---|---|---|
| Quadrant | BADHDUFLAG | Total packets | Discarded packets |
| A | 0 | 20 | 0 |
| B | 0 | 20 | 0 |
| C | 0 | 20 | 0 |
| D | 0 | 21 | 0 |
| Quadrant | Total seconds | Saturated seconds | Saturation percentage |
|---|---|---|---|
| A | 6381 | 52 | 0.814919% |
| B | 6381 | 260 | 4.074596% |
| C | 6381 | 17 | 0.266416% |
| D | 6381 | 685 | 10.734995% |
Noise dominated data is calculated using 1-second bins in cleaned event files. If a bin has >2000 counts, and if more than 50% of those come from <1% of pixels, then it is considered to be noise-dominated and hence unusable.
| Quadrant | # 1 sec bins | Bins with >0 counts | Bins with >2000 counts | High rate bins dominated by noise | Noise dominated (total time) | Noise dominated (detector-on time) | Marked lightcurve |
|---|---|---|---|---|---|---|---|
| A | 7647 | 6383 | 1 | 1 | 0.01% | 0.02% | 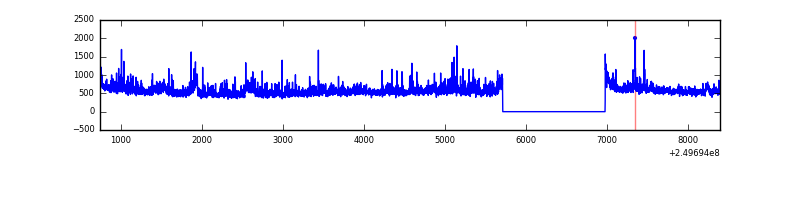 |
| B | 7647 | 6383 | 133 | 133 | 1.74% | 2.08% | 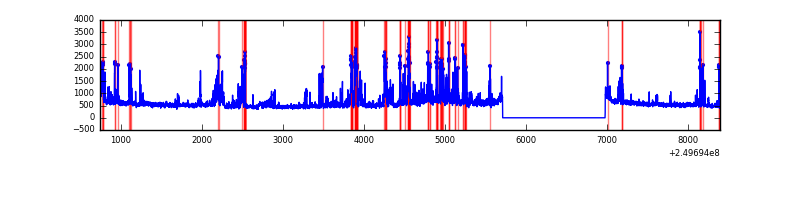 |
| C | 7647 | 6383 | 0 | 0 | 0.00% | 0.00% |  |
| D | 7647 | 6383 | 614 | 614 | 8.03% | 9.62% | 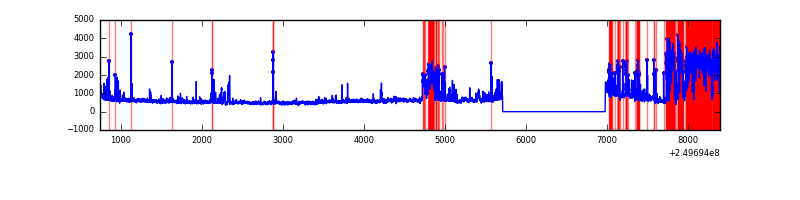 |
Top three noisy pixels from each quadrant. If the there are fewer than three noisy pixels in the level2.evt file, extra rows are filled as -1
| Pixel properties | Quadrant properties | ||||||
|---|---|---|---|---|---|---|---|
| Quadrant | DetID | PixID | Counts | Sigma | Mean | Median | Sigma |
| A | 8 | 15 | 293682 | 1826.41 | 797 | 784 | 160.4 |
| A | 1 | 162 | 104838 | 648.85 | 797 | 784 | 160.4 |
| A | 1 | 178 | 55623 | 341.96 | 797 | 784 | 160.4 |
| B | 4 | 239 | 669369 | 4516.31 | 803 | 785 | 148.0 |
| B | 4 | 81 | 171227 | 1151.34 | 803 | 785 | 148.0 |
| B | 11 | 51 | 131000 | 879.61 | 803 | 785 | 148.0 |
| C | 12 | 4 | 5847 | 27.85 | 793 | 799 | 181.3 |
| C | 13 | 61 | 5844 | 27.83 | 793 | 799 | 181.3 |
| C | 14 | 67 | 4117 | 18.3 | 793 | 799 | 181.3 |
| D | 1 | 52 | 2026058 | 11720.28 | 733 | 713 | 172.8 |
| D | 8 | 195 | 536909 | 3102.86 | 733 | 713 | 172.8 |
| D | 13 | 104 | 62926 | 360.01 | 733 | 713 | 172.8 |
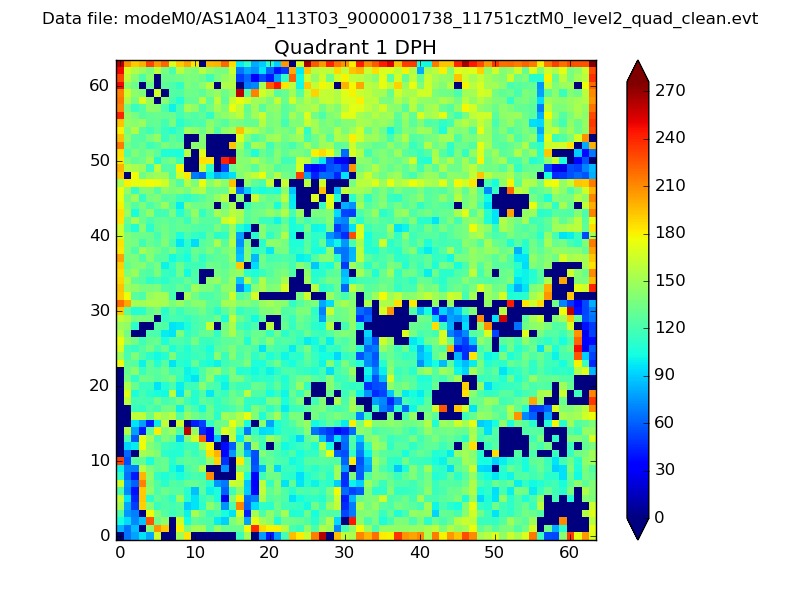
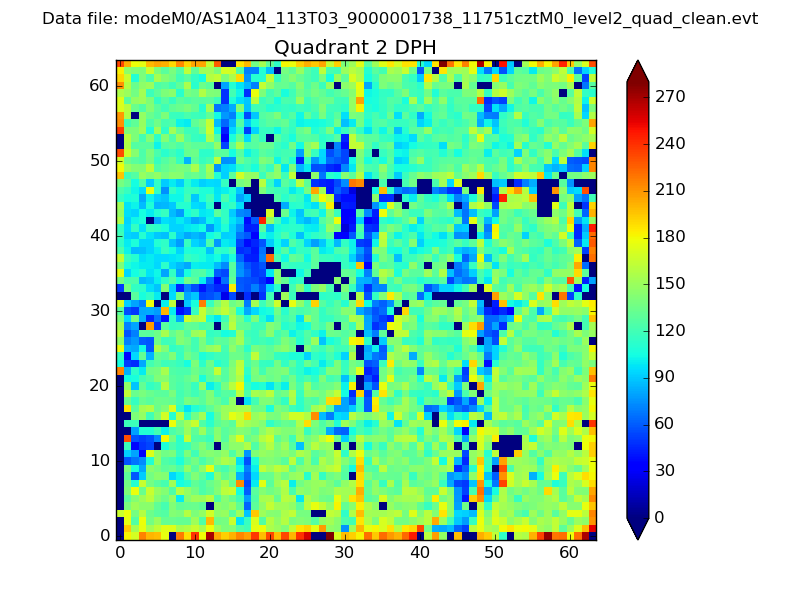
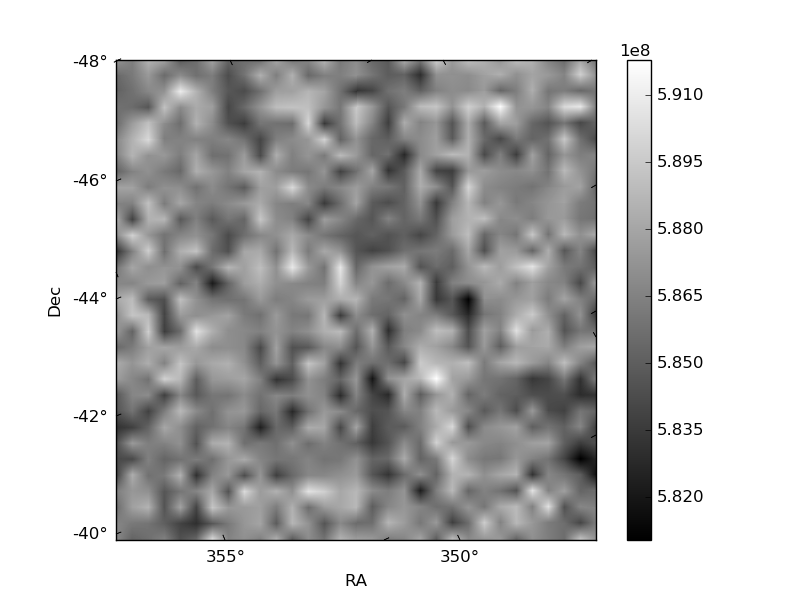
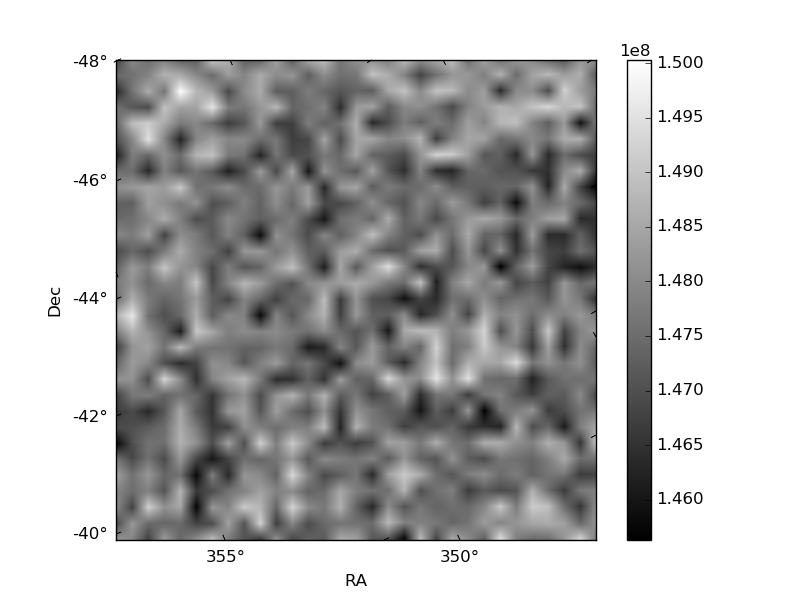
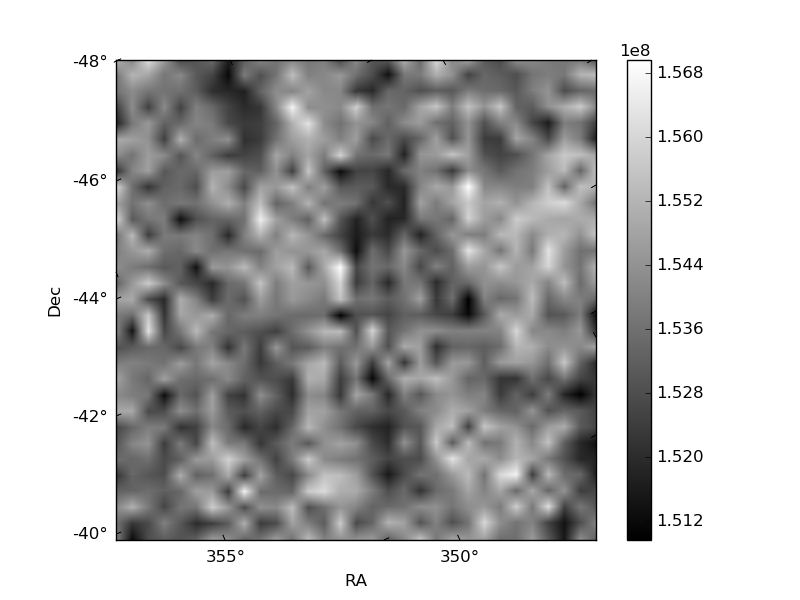
Histogram calculated using DETX and DETY for each event in the final _common_clean file
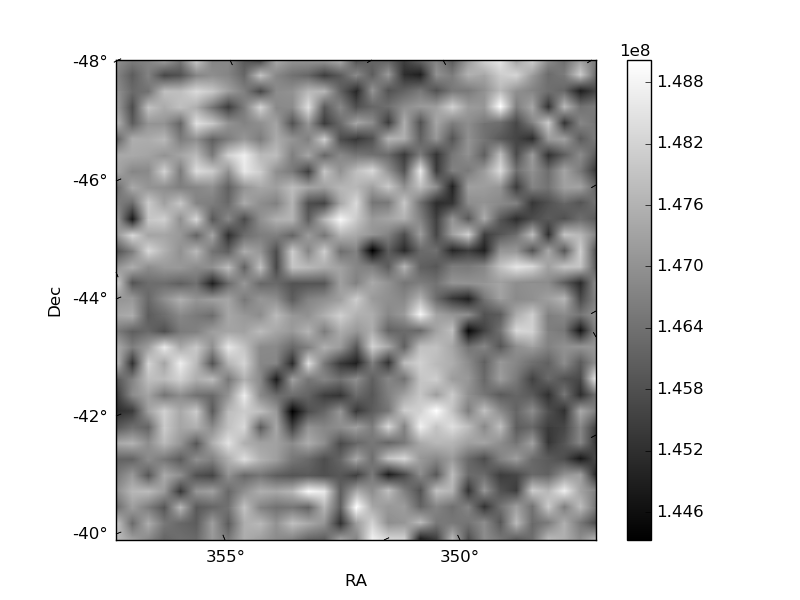
| Quadrant A | 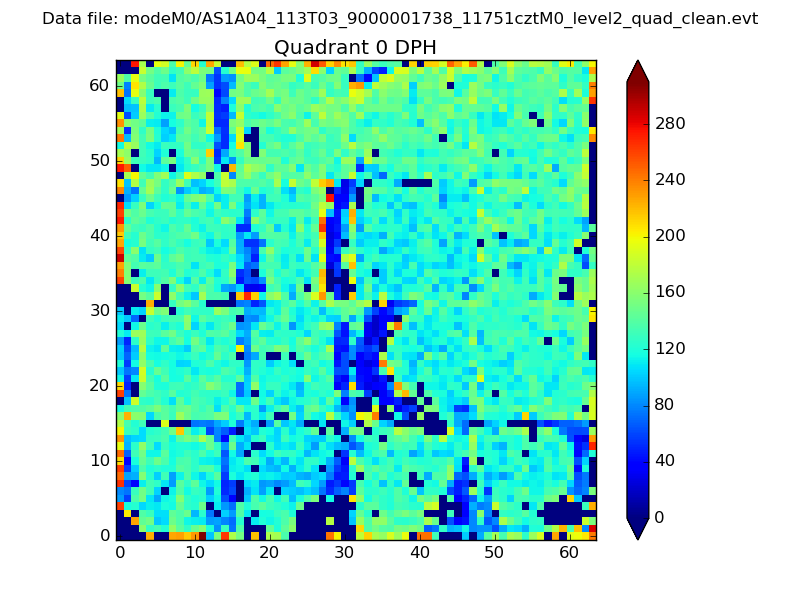 |
 |
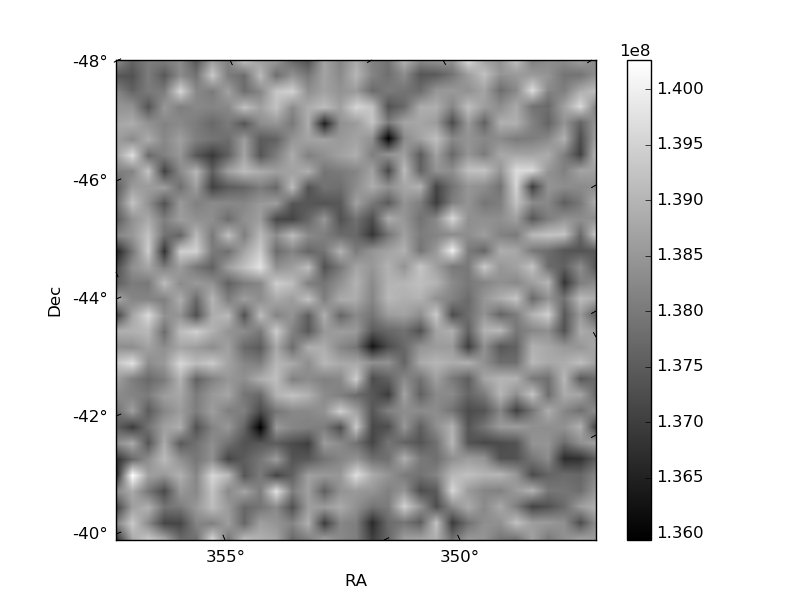
Quadrant B |
|---|---|---|---|
| Quadrant D | 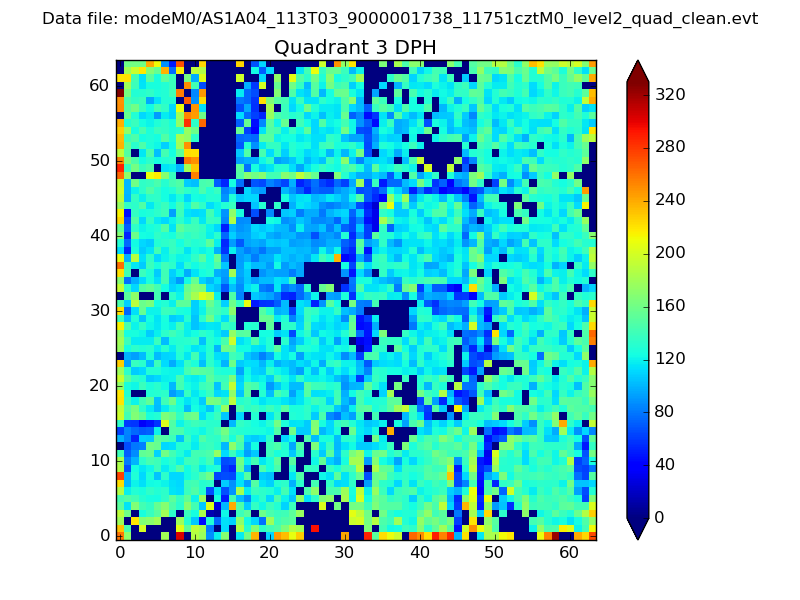 |
 |
Quadrant C |
| Plot type | Count rate plots | Images |
|---|---|---|
| Comparison with Poisson distribution Blue bars denote a histogram of data divided into 1 sec bins. Red curve is a Poisson curve with rate = median count rate of data. |
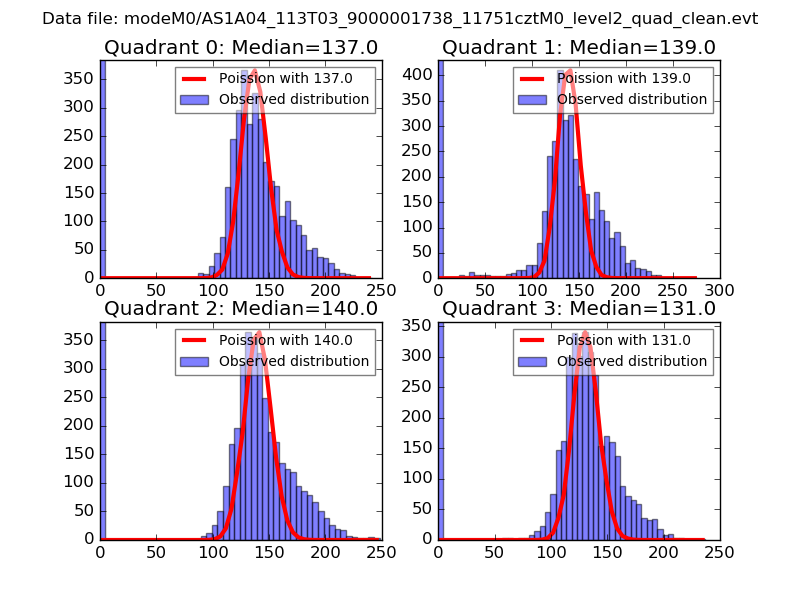 |
 |
| Quadrant-wise count rates Data is divided into 100 sec bins |
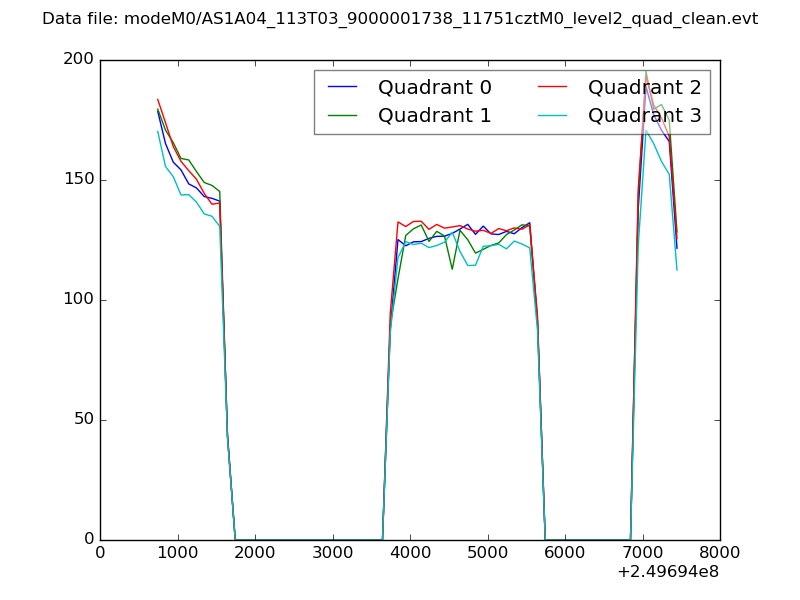 |
|
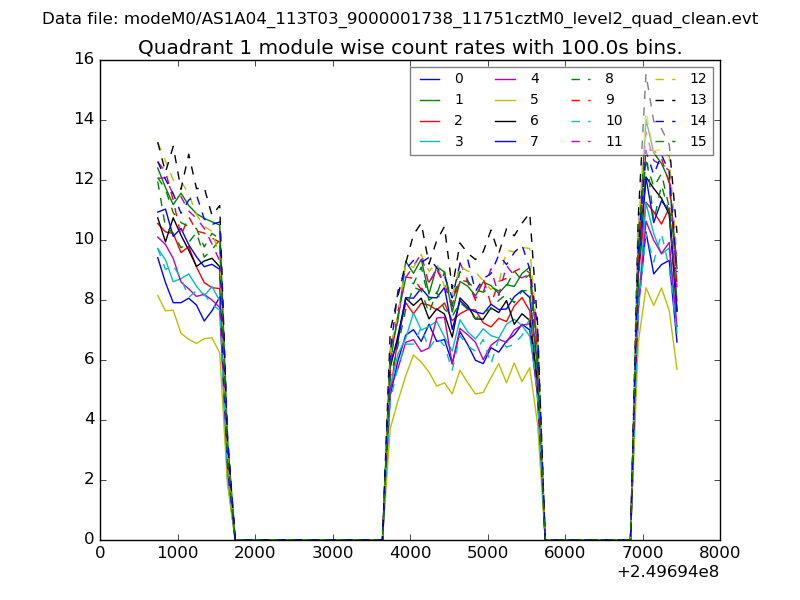
| Module-wise count rates for Quadrant A Data is divided into 100 sec bins |
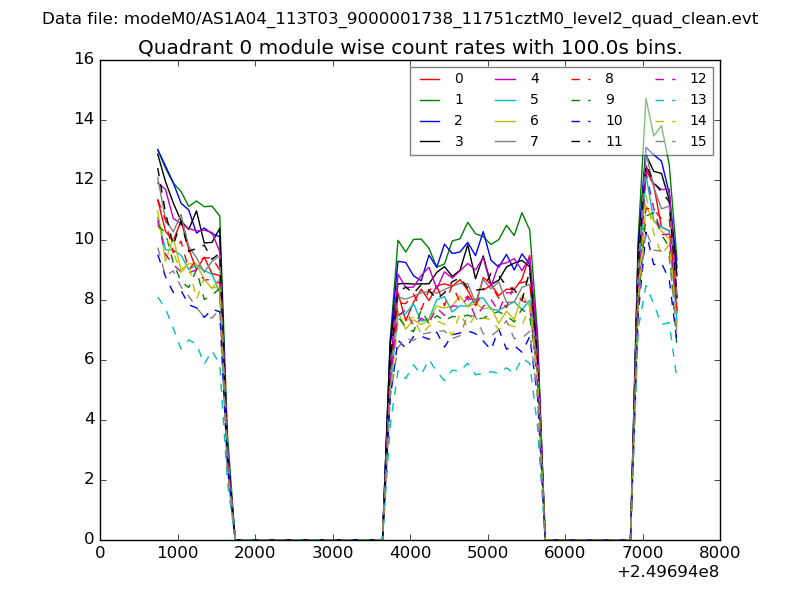 |
 |
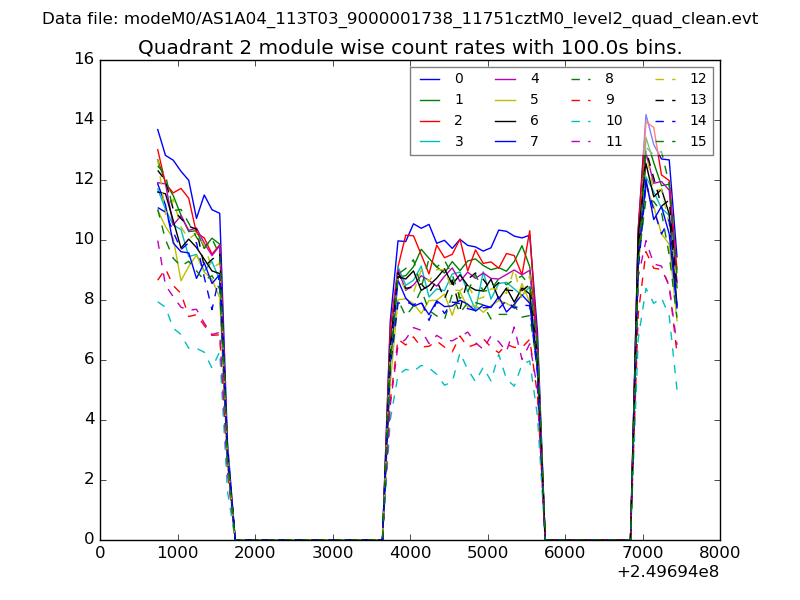
| Module-wise count rates for Quadrant B Data is divided into 100 sec bins |
 |
 |
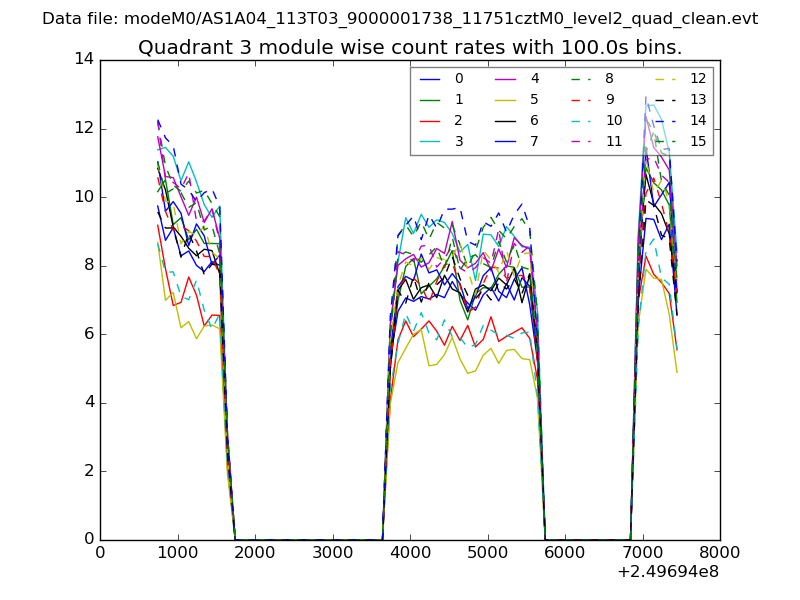
| Module-wise count rates for Quadrant C Data is divided into 100 sec bins |
 |
 |
| Module-wise count rates for Quadrant D Data is divided into 100 sec bins |
 |
 |
| Parameter | Plot |
|---|---|
| CZT HV Monitor | 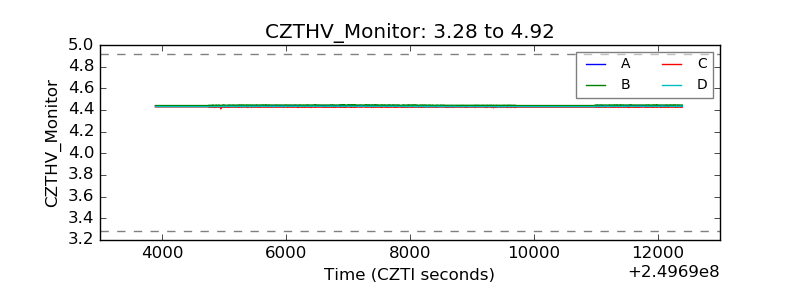 |
| D_VDD | 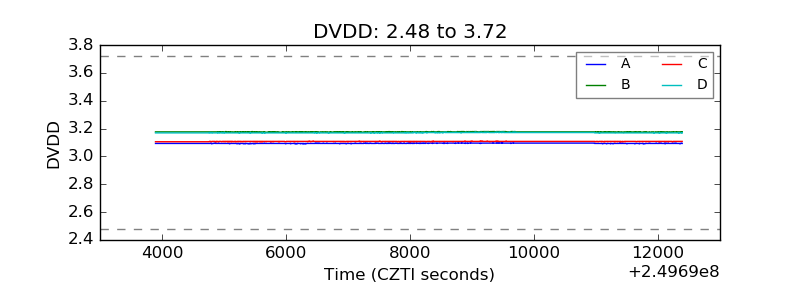 |
| Temperature 1 | 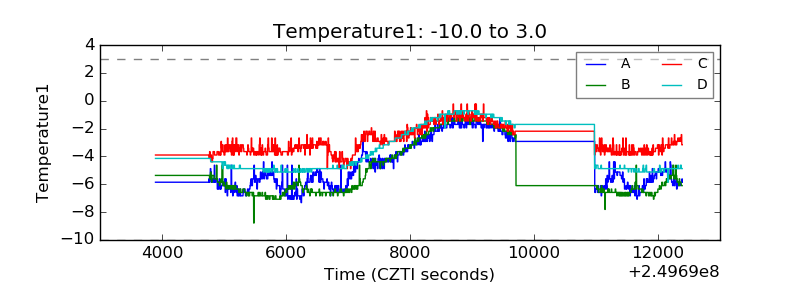 |
| Veto HV Monitor | 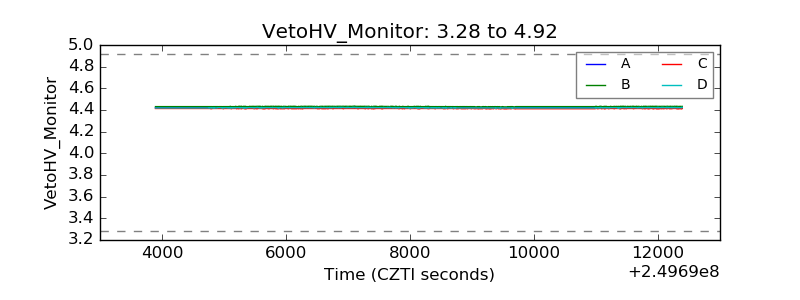 |
| Veto LLD | 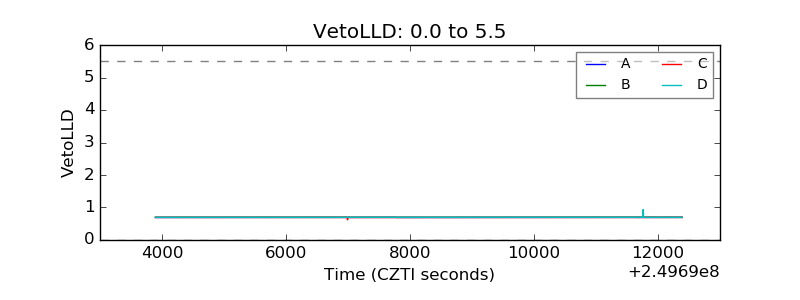 |
| Alpha Counter | 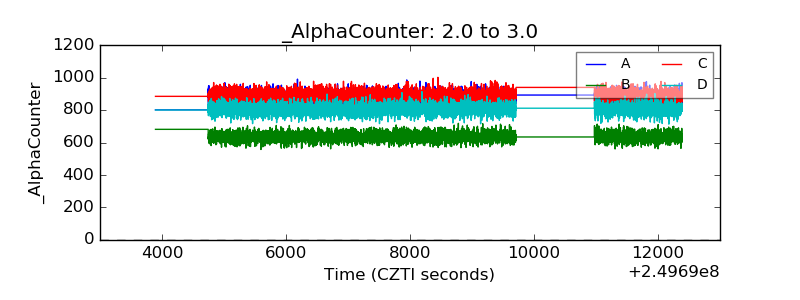 |
| _CPM_Rate | 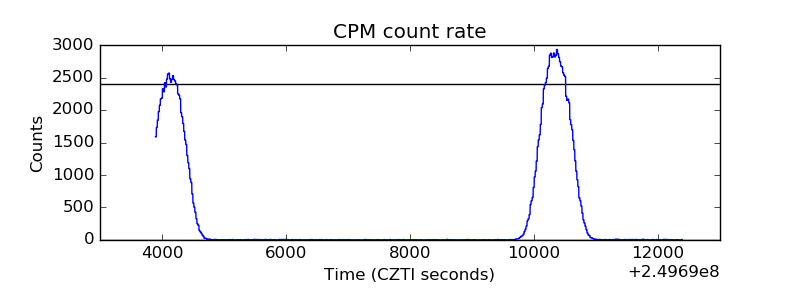 |
| CZT Counter | 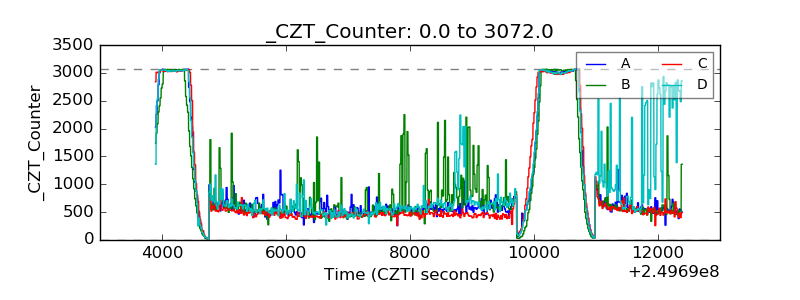 |
| +2.5 Volts monitor |  |
| +5 Volts monitor |  |
| _ROLL_ROT | 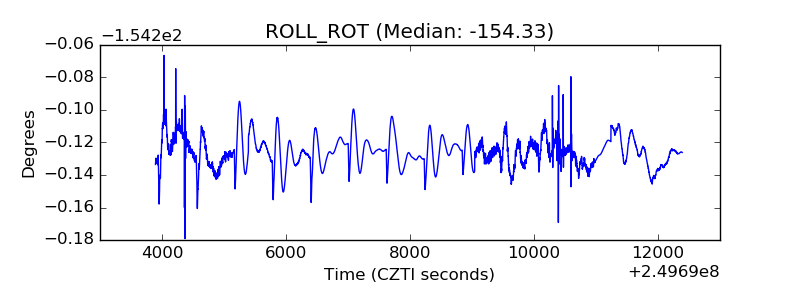 |
| _Roll_DEC | 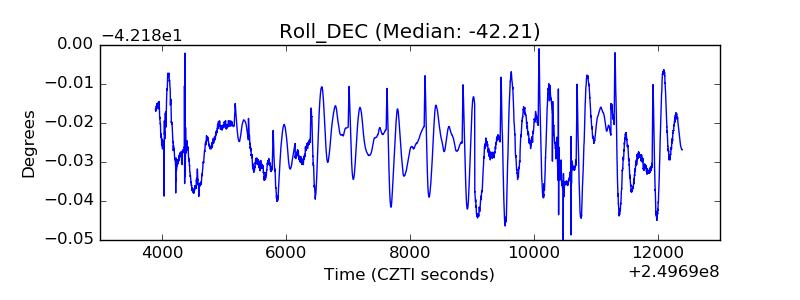 |
| _Roll_RA | 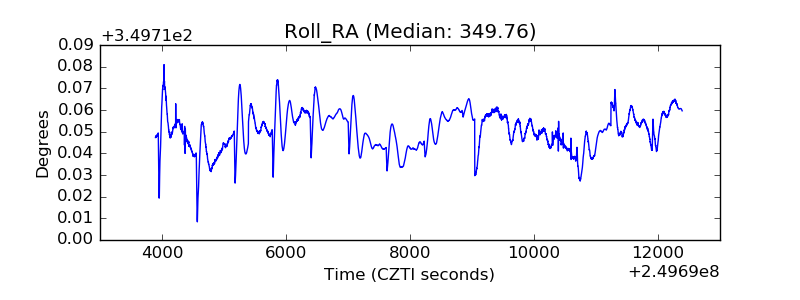 |
| Veto Counter | 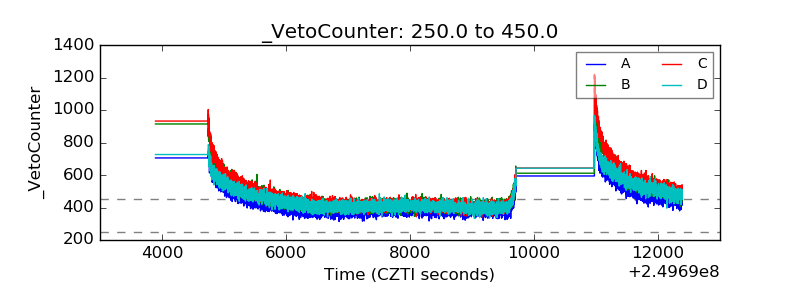 |