| Param | Original file | Final file |
|---|---|---|
| Filename | modeM0/AS1A04_113T03_9000001738_11754cztM0_level2.evt | modeM0/AS1A04_113T03_9000001738_11754cztM0_level2_quad_clean.evt |
| Size (bytes) | 642,516,480 | 69,353,280 |
| Size | 612.8 MB | 66.1 MB |
| Events in quadrant A | 3,924,566 | 421,810 |
| Events in quadrant B | 4,533,752 | 414,367 |
| Events in quadrant C | 3,198,745 | 432,032 |
| Events in quadrant D | 7,369,137 | 384,970 |
| Mode M0 | |||
|---|---|---|---|
| Quadrant | BADHDUFLAG | Total packets | Discarded packets |
| A | 0 | 15844 | 3 |
| B | 0 | 17403 | 2 |
| C | 0 | 13473 | 2 |
| D | 0 | 26189 | 2 |
| Mode SS | |||
|---|---|---|---|
| Quadrant | BADHDUFLAG | Total packets | Discarded packets |
| A | 0 | 130 | 0 |
| B | 0 | 130 | 0 |
| C | 0 | 130 | 0 |
| D | 0 | 130 | 0 |
| Mode M9 | |||
|---|---|---|---|
| Quadrant | BADHDUFLAG | Total packets | Discarded packets |
| A | 0 | 17 | 0 |
| B | 0 | 17 | 0 |
| C | 0 | 17 | 0 |
| D | 0 | 18 | 0 |
| Quadrant | Total seconds | Saturated seconds | Saturation percentage |
|---|---|---|---|
| A | 6397 | 206 | 3.220259% |
| B | 6397 | 394 | 6.159137% |
| C | 6397 | 121 | 1.891512% |
| D | 6397 | 741 | 11.583555% |
Noise dominated data is calculated using 1-second bins in cleaned event files. If a bin has >2000 counts, and if more than 50% of those come from <1% of pixels, then it is considered to be noise-dominated and hence unusable.
| Quadrant | # 1 sec bins | Bins with >0 counts | Bins with >2000 counts | High rate bins dominated by noise | Noise dominated (total time) | Noise dominated (detector-on time) | Marked lightcurve |
|---|---|---|---|---|---|---|---|
| A | 7593 | 6399 | 2 | 2 | 0.03% | 0.03% | 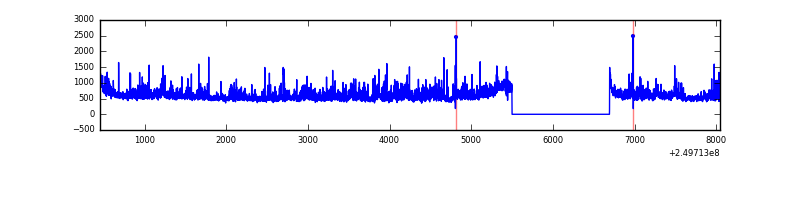 |
| B | 7593 | 6399 | 156 | 156 | 2.05% | 2.44% | 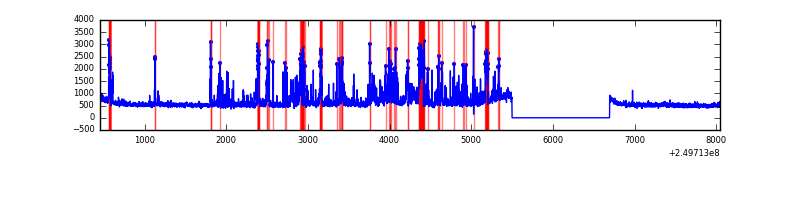 |
| C | 7593 | 6399 | 2 | 2 | 0.03% | 0.03% | 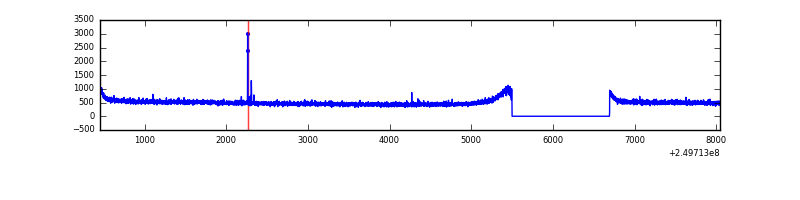 |
| D | 7593 | 6399 | 648 | 648 | 8.53% | 10.13% | 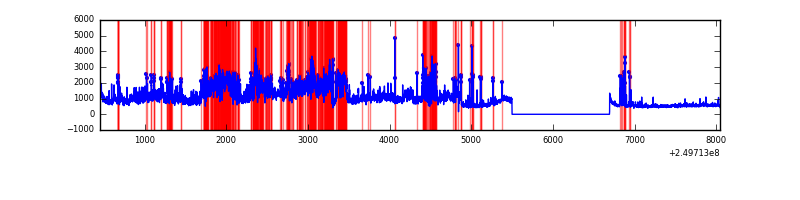 |
Top three noisy pixels from each quadrant. If the there are fewer than three noisy pixels in the level2.evt file, extra rows are filled as -1
| Pixel properties | Quadrant properties | ||||||
|---|---|---|---|---|---|---|---|
| Quadrant | DetID | PixID | Counts | Sigma | Mean | Median | Sigma |
| A | 8 | 15 | 200409 | 1194.02 | 826 | 809 | 167.2 |
| A | 1 | 162 | 185699 | 1106.03 | 826 | 809 | 167.2 |
| A | 1 | 178 | 111823 | 664.09 | 826 | 809 | 167.2 |
| B | 4 | 239 | 824132 | 5321.89 | 820 | 801 | 154.7 |
| B | 3 | 64 | 195634 | 1259.37 | 820 | 801 | 154.7 |
| B | 15 | 204 | 142817 | 917.97 | 820 | 801 | 154.7 |
| C | 14 | 234 | 12292 | 61.7 | 816 | 822 | 185.9 |
| C | 13 | 61 | 6094 | 28.36 | 816 | 822 | 185.9 |
| C | 12 | 4 | 3007 | 11.75 | 816 | 822 | 185.9 |
| D | 12 | 221 | 3117567 | 16655.77 | 789 | 767 | 187.1 |
| D | 8 | 195 | 418482 | 2232.21 | 789 | 767 | 187.1 |
| D | 1 | 52 | 323601 | 1725.18 | 789 | 767 | 187.1 |
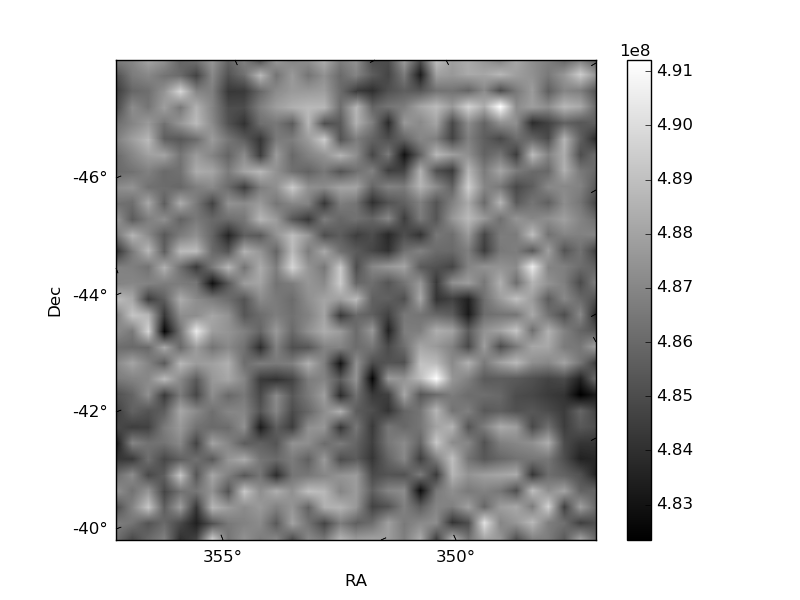
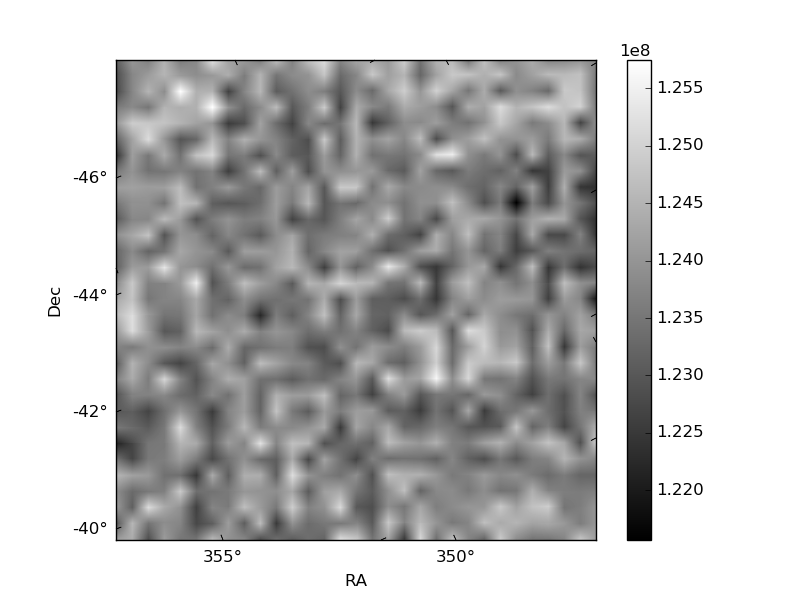
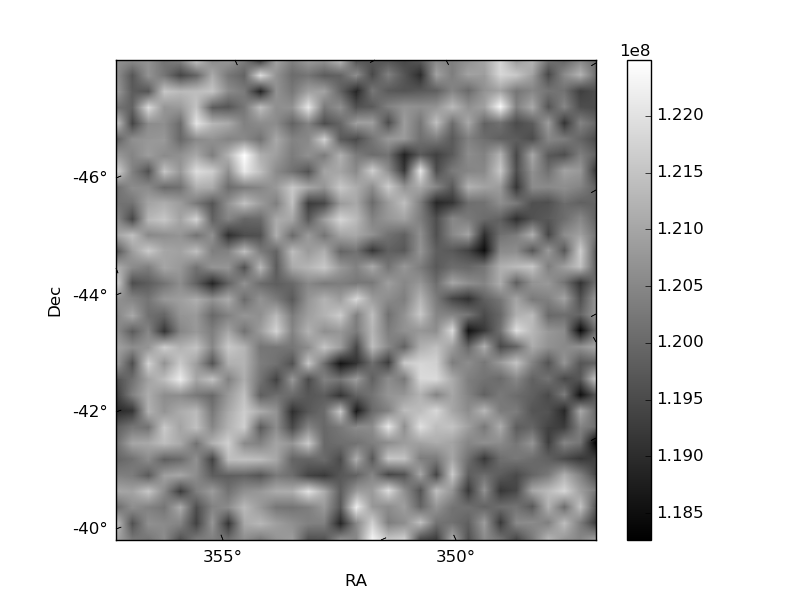
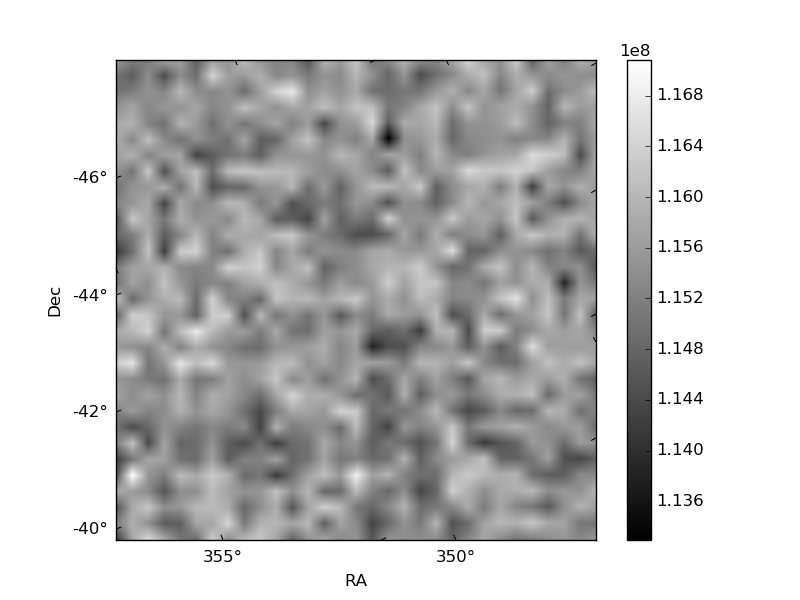
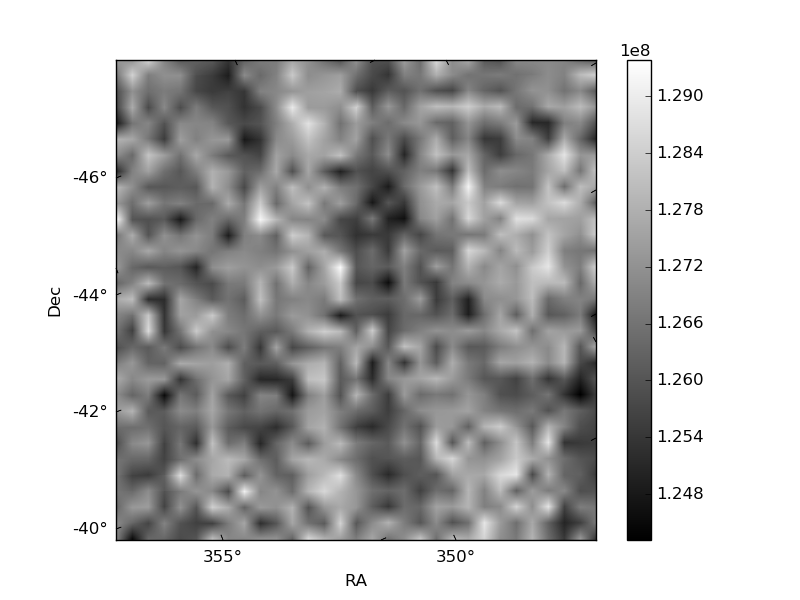
Histogram calculated using DETX and DETY for each event in the final _common_clean file
| Quadrant A | 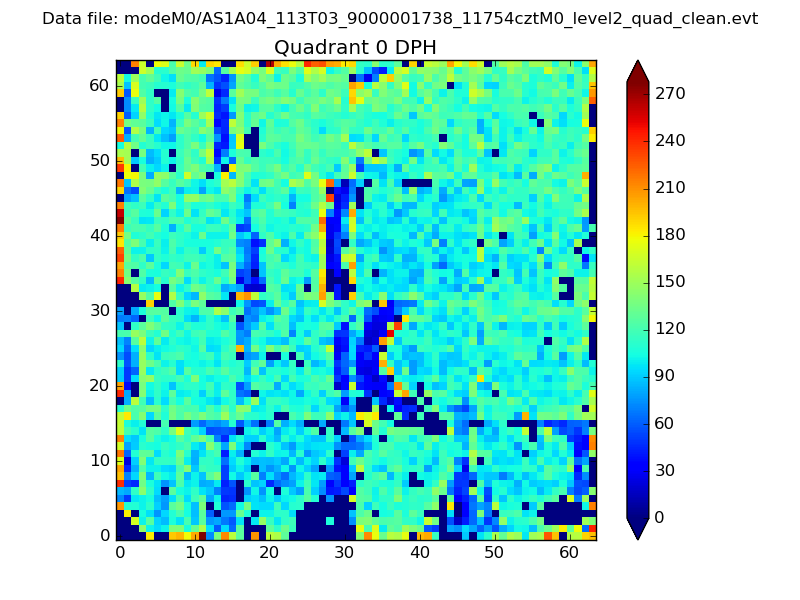 |
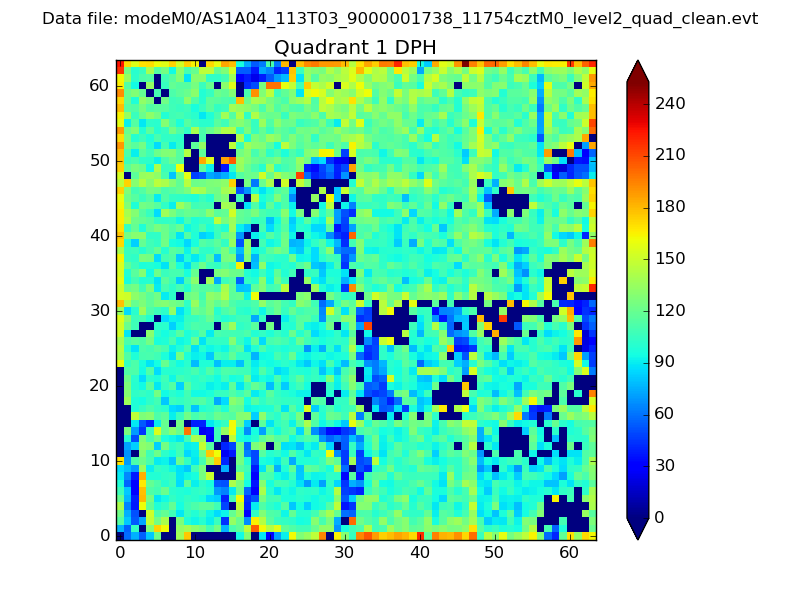 |
Quadrant B |
|---|---|---|---|
| Quadrant D | 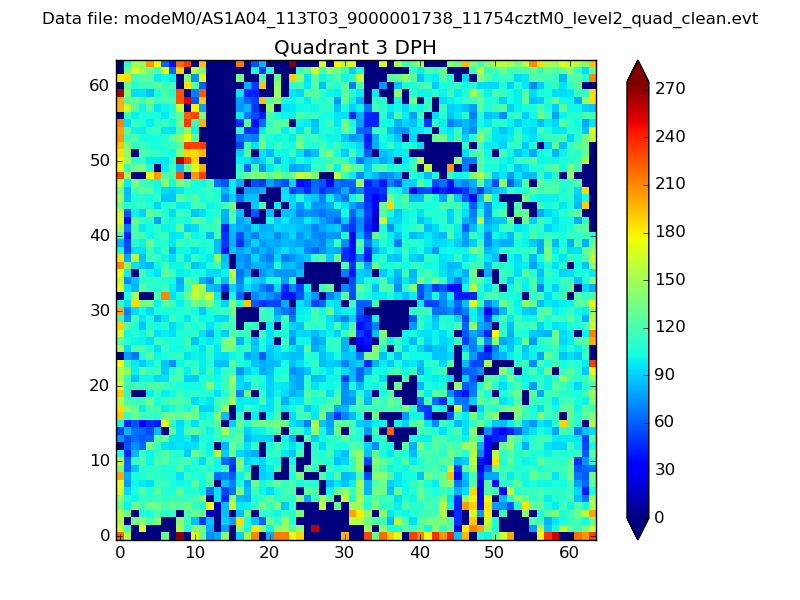 |
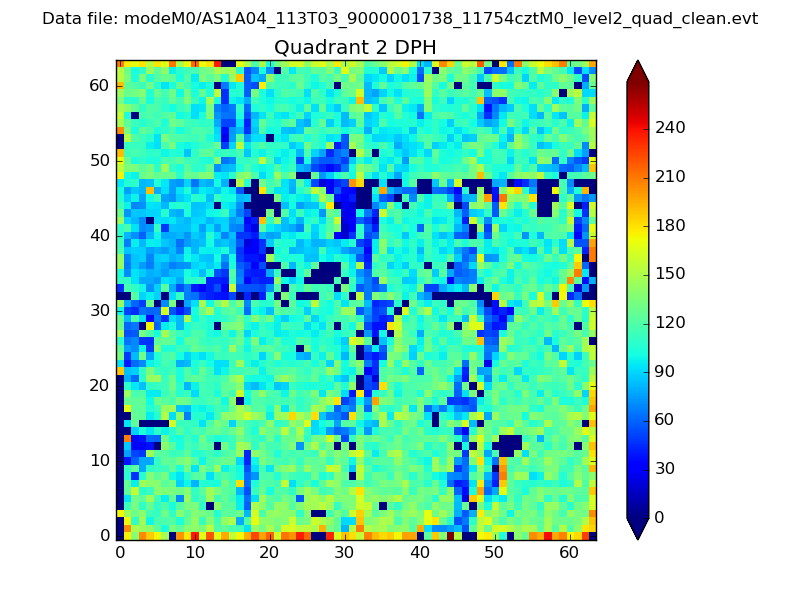 |
Quadrant C |
| Plot type | Count rate plots | Images |
|---|---|---|
| Comparison with Poisson distribution Blue bars denote a histogram of data divided into 1 sec bins. Red curve is a Poisson curve with rate = median count rate of data. |
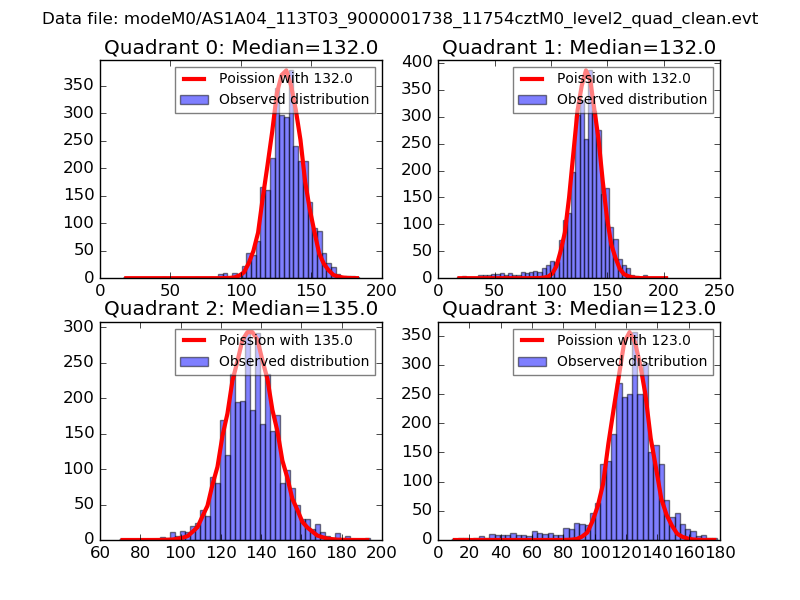 |
 |
| Quadrant-wise count rates Data is divided into 100 sec bins |
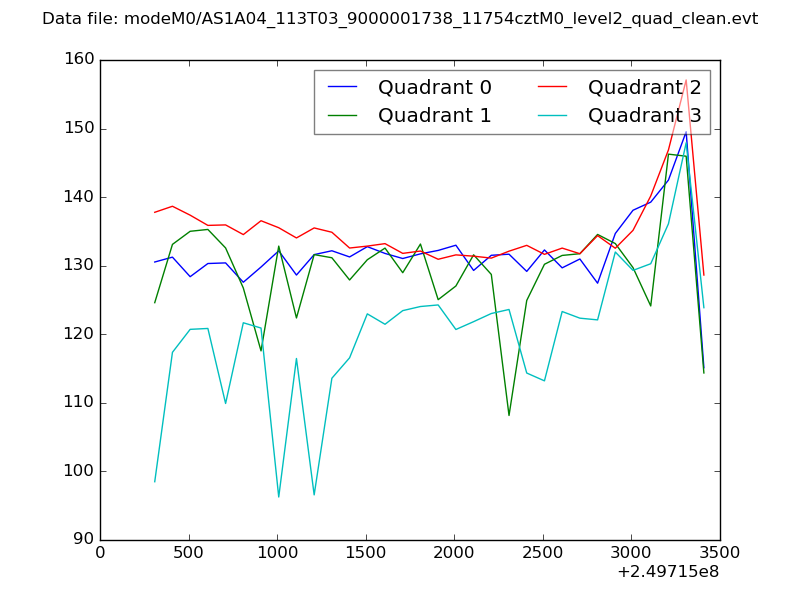 |
|
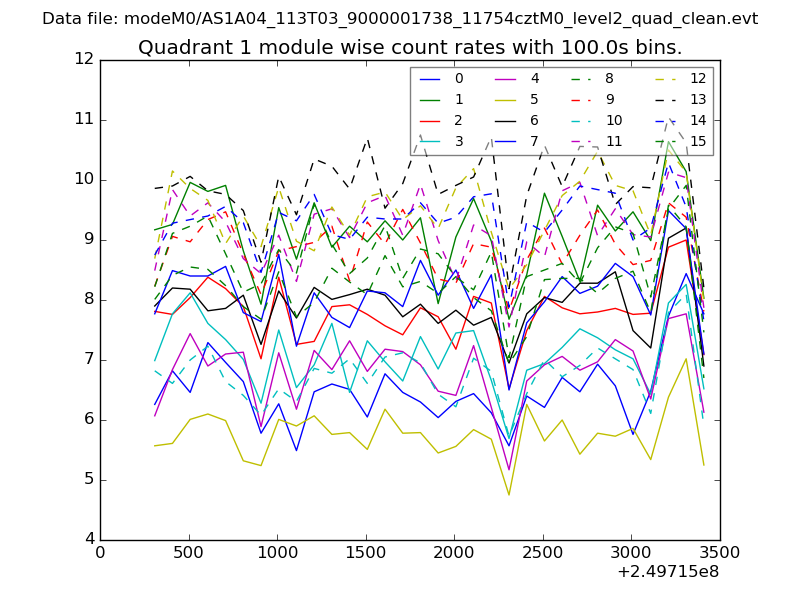
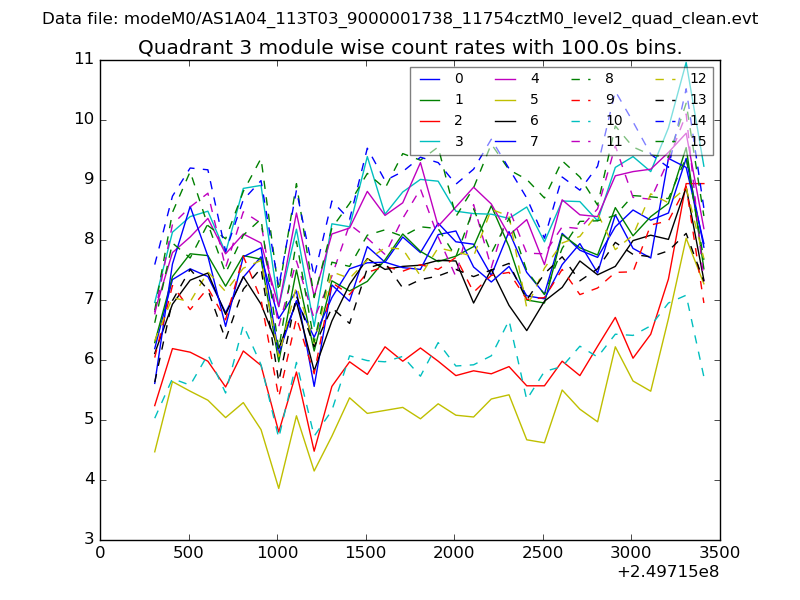
| Module-wise count rates for Quadrant A Data is divided into 100 sec bins |
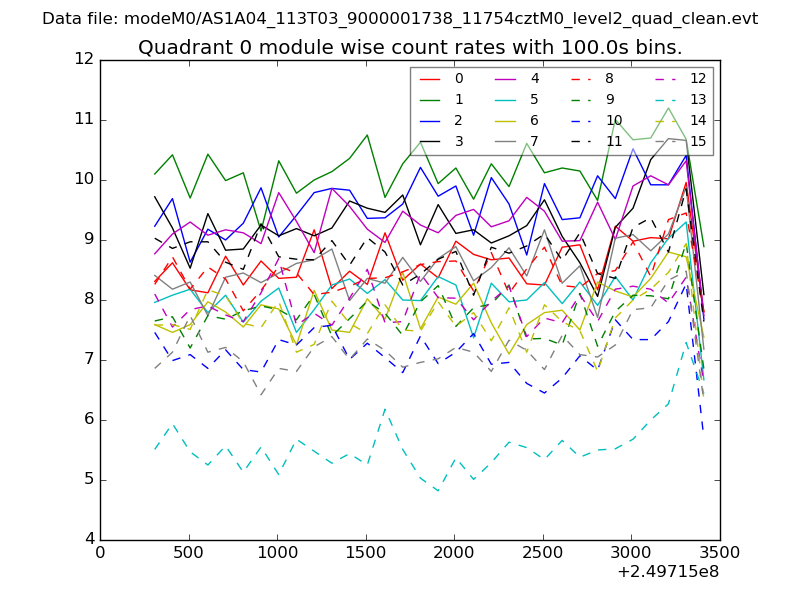 |
 |
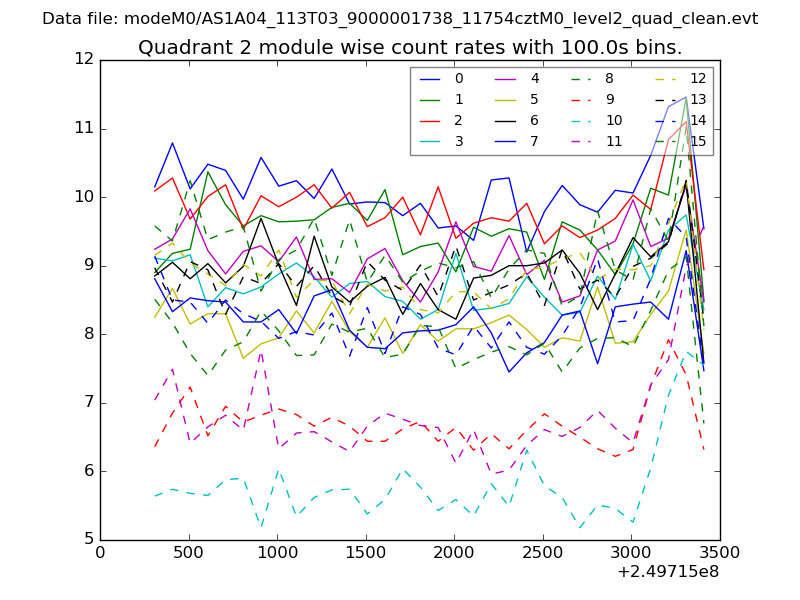
| Module-wise count rates for Quadrant B Data is divided into 100 sec bins |
 |
 |
| Module-wise count rates for Quadrant C Data is divided into 100 sec bins |
 |
 |
| Module-wise count rates for Quadrant D Data is divided into 100 sec bins |
 |
 |
| Parameter | Plot |
|---|---|
| CZT HV Monitor | 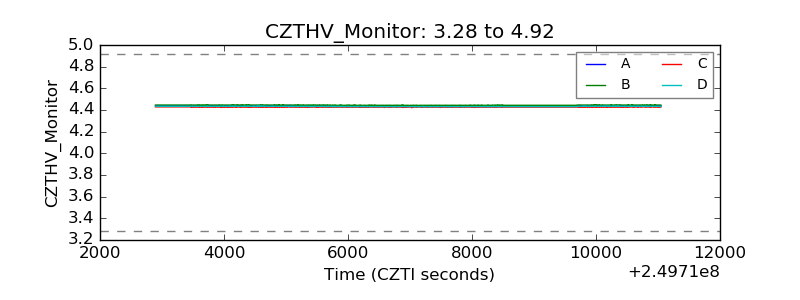 |
| D_VDD | 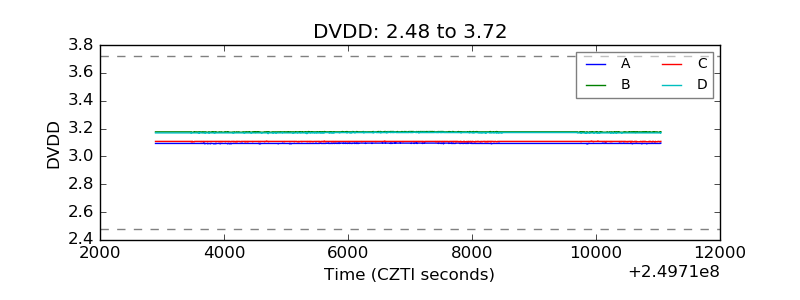 |
| Temperature 1 | 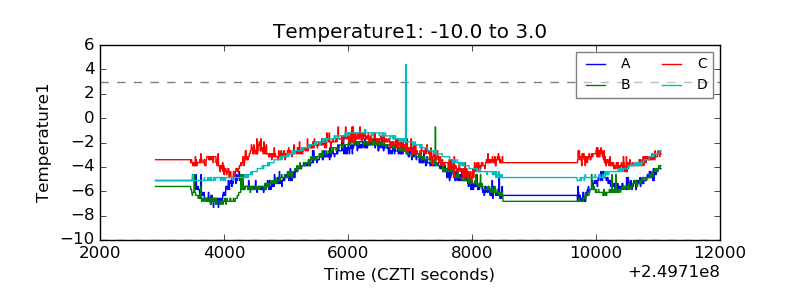 |
| Veto HV Monitor | 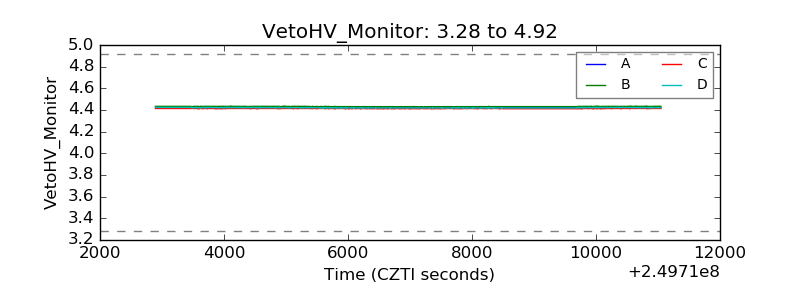 |
| Veto LLD |  |
| Alpha Counter | 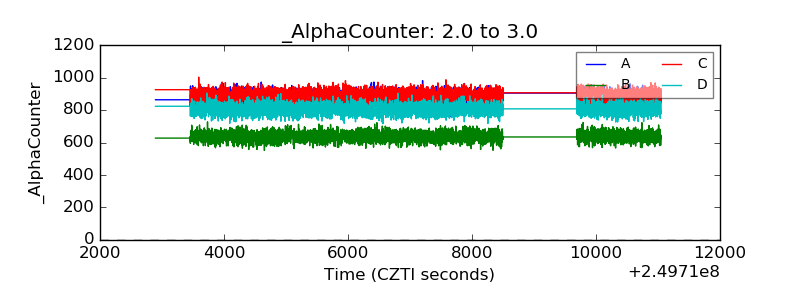 |
| _CPM_Rate | 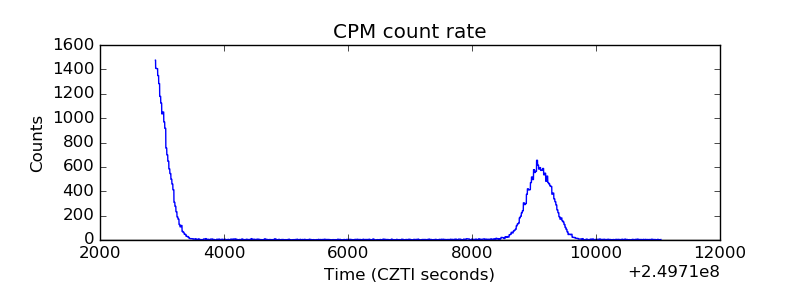 |
| CZT Counter | 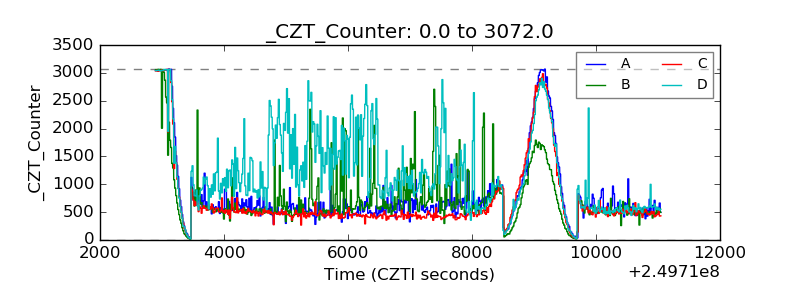 |
| +2.5 Volts monitor |  |
| +5 Volts monitor |  |
| _ROLL_ROT | 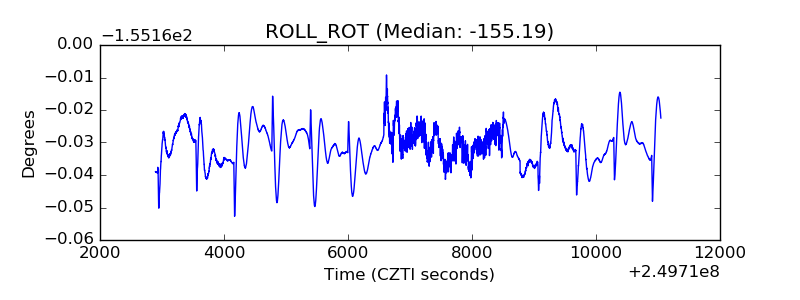 |
| _Roll_DEC | 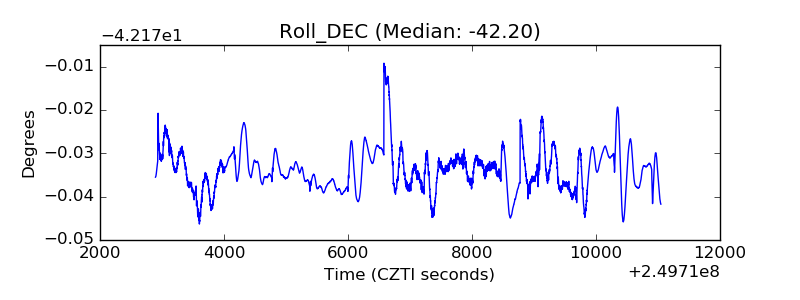 |
| _Roll_RA | 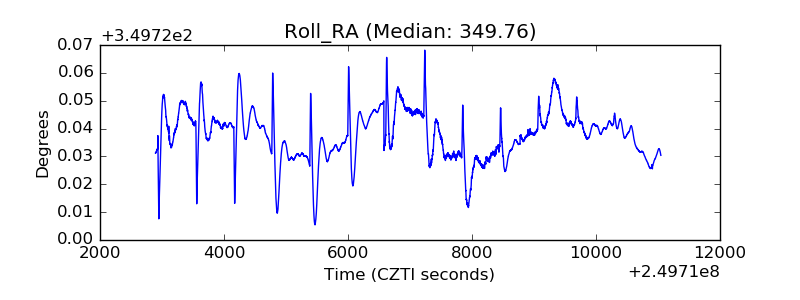 |
| Veto Counter | 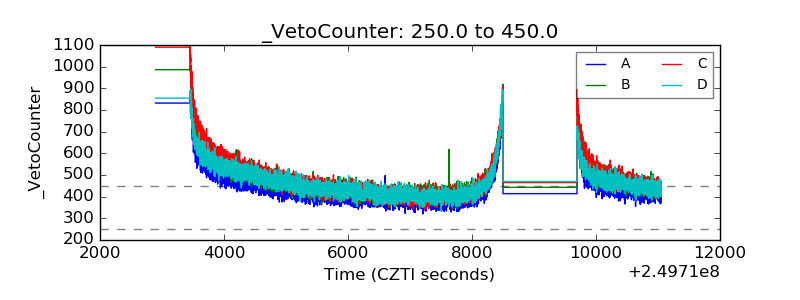 |