| Param | Original file | Final file |
|---|---|---|
| Filename | modeM0/AS1A04_113T03_9000001738_11758cztM0_level2.evt | modeM0/AS1A04_113T03_9000001738_11758cztM0_level2_quad_clean.evt |
| Size (bytes) | 590,863,680 | 98,994,240 |
| Size | 563.5 MB | 94.4 MB |
| Events in quadrant A | 4,073,121 | 630,086 |
| Events in quadrant B | 4,940,117 | 621,133 |
| Events in quadrant C | 3,313,782 | 635,531 |
| Events in quadrant D | 5,065,376 | 595,378 |
| Mode M0 | |||
|---|---|---|---|
| Quadrant | BADHDUFLAG | Total packets | Discarded packets |
| A | 0 | 16900 | 2 |
| B | 0 | 19352 | 1 |
| C | 0 | 15151 | 1 |
| D | 0 | 20060 | 1 |
| Mode SS | |||
|---|---|---|---|
| Quadrant | BADHDUFLAG | Total packets | Discarded packets |
| A | 0 | 148 | 0 |
| B | 0 | 148 | 0 |
| C | 0 | 148 | 0 |
| D | 0 | 148 | 0 |
| Mode M9 | |||
|---|---|---|---|
| Quadrant | BADHDUFLAG | Total packets | Discarded packets |
| A | 0 | 2 | 0 |
| B | 0 | 2 | 0 |
| C | 0 | 2 | 0 |
| D | 0 | 2 | 0 |
| Quadrant | Total seconds | Saturated seconds | Saturation percentage |
|---|---|---|---|
| A | 7414 | 105 | 1.416240% |
| B | 7414 | 380 | 5.125438% |
| C | 7414 | 25 | 0.337200% |
| D | 7414 | 281 | 3.790127% |
Noise dominated data is calculated using 1-second bins in cleaned event files. If a bin has >2000 counts, and if more than 50% of those come from <1% of pixels, then it is considered to be noise-dominated and hence unusable.
| Quadrant | # 1 sec bins | Bins with >0 counts | Bins with >2000 counts | High rate bins dominated by noise | Noise dominated (total time) | Noise dominated (detector-on time) | Marked lightcurve |
|---|---|---|---|---|---|---|---|
| A | 7585 | 7417 | 2 | 2 | 0.03% | 0.03% | 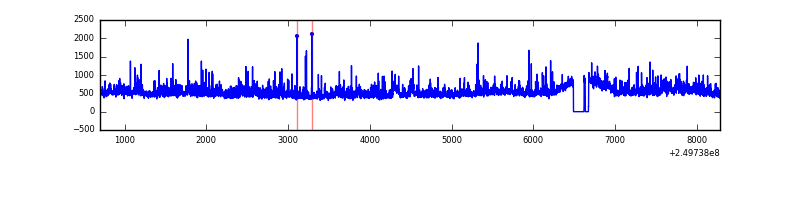 |
| B | 7585 | 7417 | 181 | 181 | 2.39% | 2.44% | 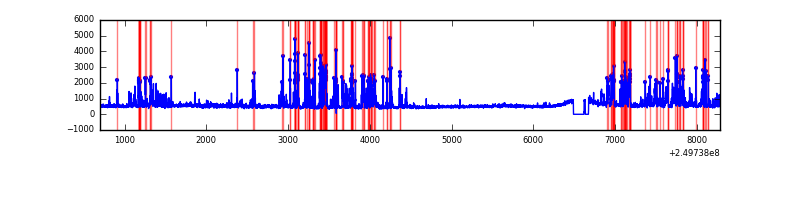 |
| C | 7585 | 7417 | 0 | 0 | 0.00% | 0.00% | 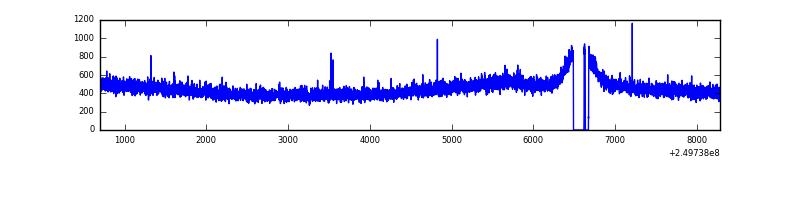 |
| D | 7585 | 7417 | 165 | 165 | 2.18% | 2.22% | 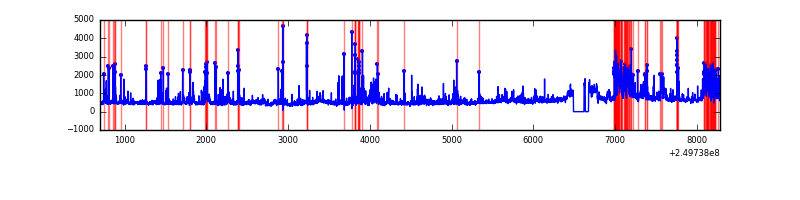 |
Top three noisy pixels from each quadrant. If the there are fewer than three noisy pixels in the level2.evt file, extra rows are filled as -1
| Pixel properties | Quadrant properties | ||||||
|---|---|---|---|---|---|---|---|
| Quadrant | DetID | PixID | Counts | Sigma | Mean | Median | Sigma |
| A | 1 | 162 | 174632 | 968.32 | 875 | 855 | 179.5 |
| A | 8 | 15 | 173598 | 962.55 | 875 | 855 | 179.5 |
| A | 1 | 178 | 97277 | 537.28 | 875 | 855 | 179.5 |
| B | 4 | 239 | 866686 | 5187.41 | 866 | 844 | 166.9 |
| B | 3 | 64 | 333135 | 1990.81 | 866 | 844 | 166.9 |
| B | 15 | 204 | 224289 | 1338.7 | 866 | 844 | 166.9 |
| C | 13 | 61 | 6296 | 27.58 | 848 | 851 | 197.4 |
| C | 12 | 4 | 4066 | 16.28 | 848 | 851 | 197.4 |
| C | 8 | 222 | 3983 | 15.86 | 848 | 851 | 197.4 |
| D | 1 | 52 | 822384 | 4068.06 | 839 | 815 | 202.0 |
| D | 8 | 195 | 489722 | 2420.86 | 839 | 815 | 202.0 |
| D | 10 | 157 | 183572 | 904.93 | 839 | 815 | 202.0 |
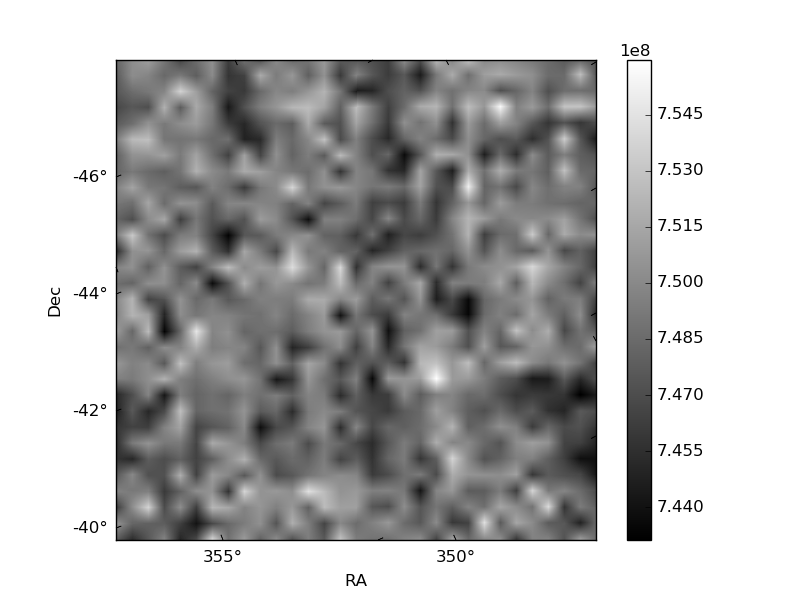
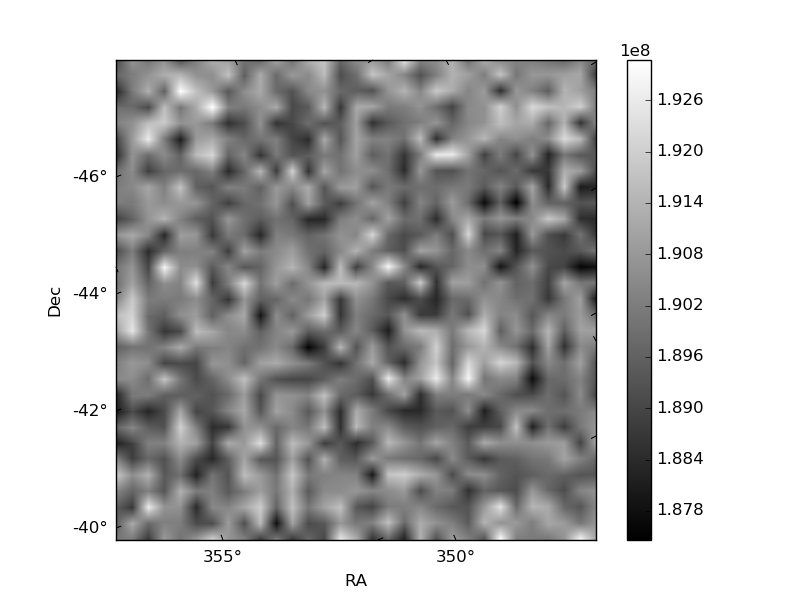
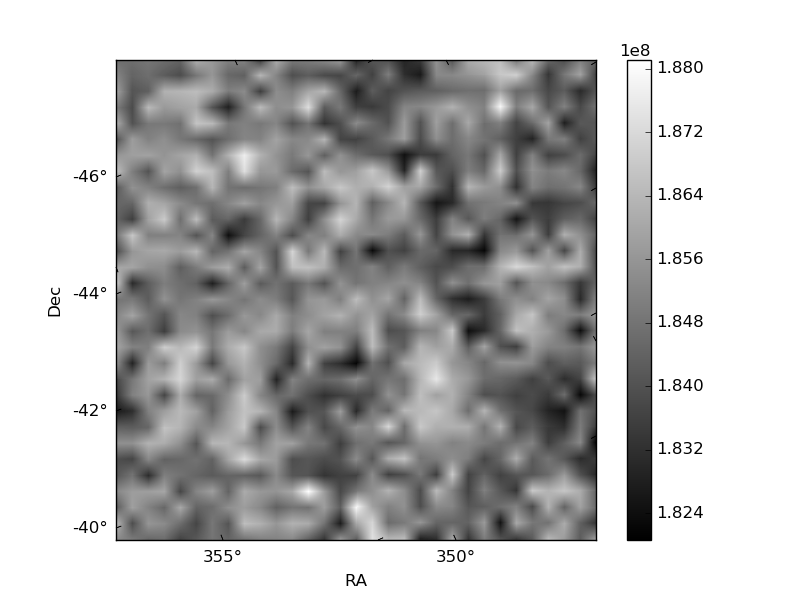
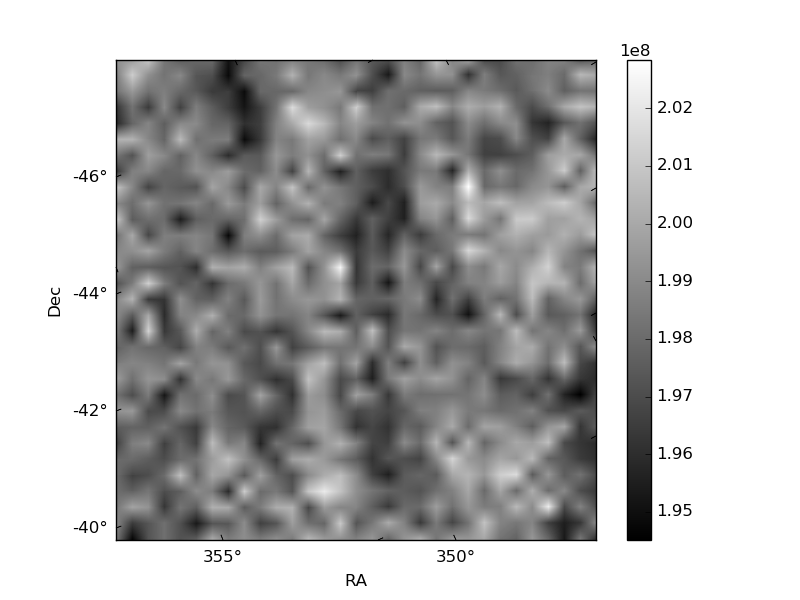
Histogram calculated using DETX and DETY for each event in the final _common_clean file
| Quadrant A | 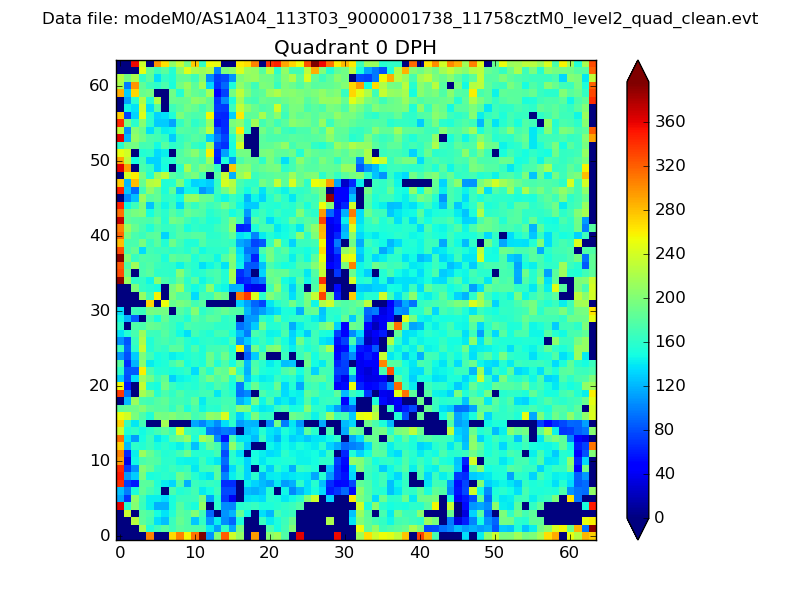 |
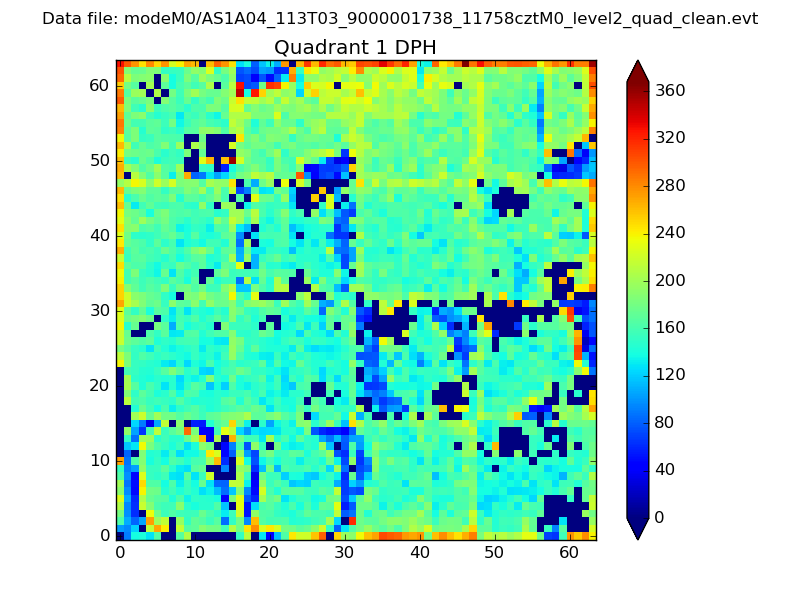 |
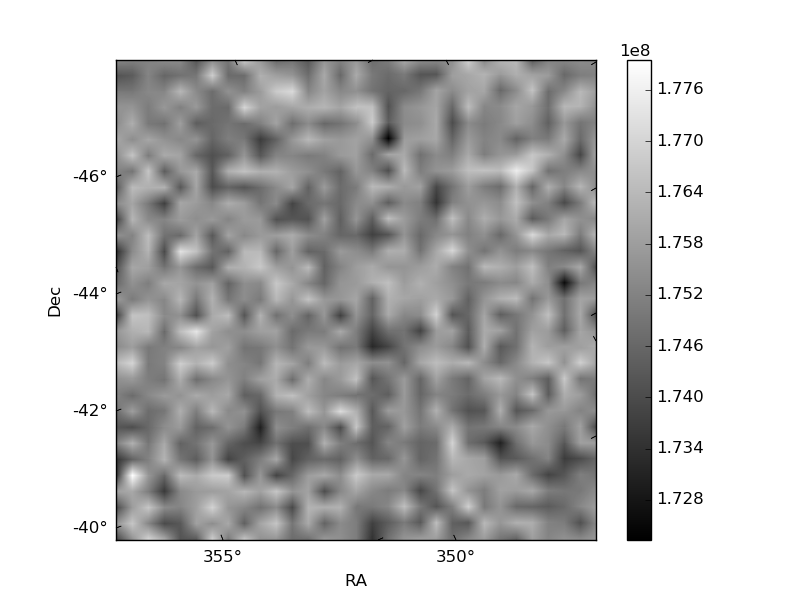
Quadrant B |
|---|---|---|---|
| Quadrant D | 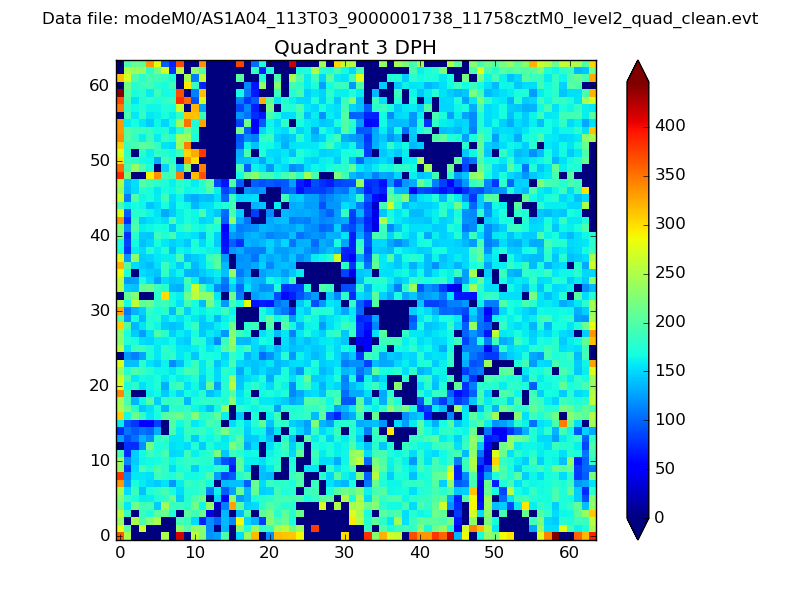 |
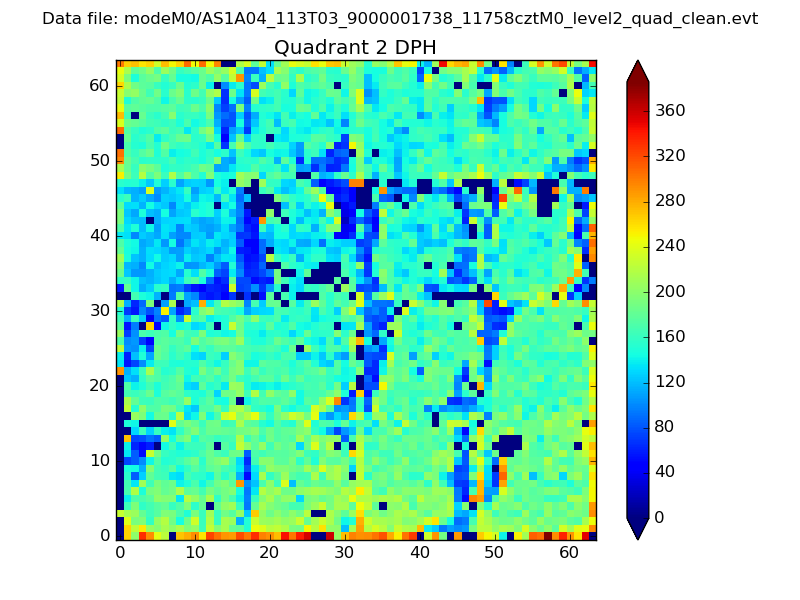 |
Quadrant C |
| Plot type | Count rate plots | Images |
|---|---|---|
| Comparison with Poisson distribution Blue bars denote a histogram of data divided into 1 sec bins. Red curve is a Poisson curve with rate = median count rate of data. |
 |
 |
| Quadrant-wise count rates Data is divided into 100 sec bins |
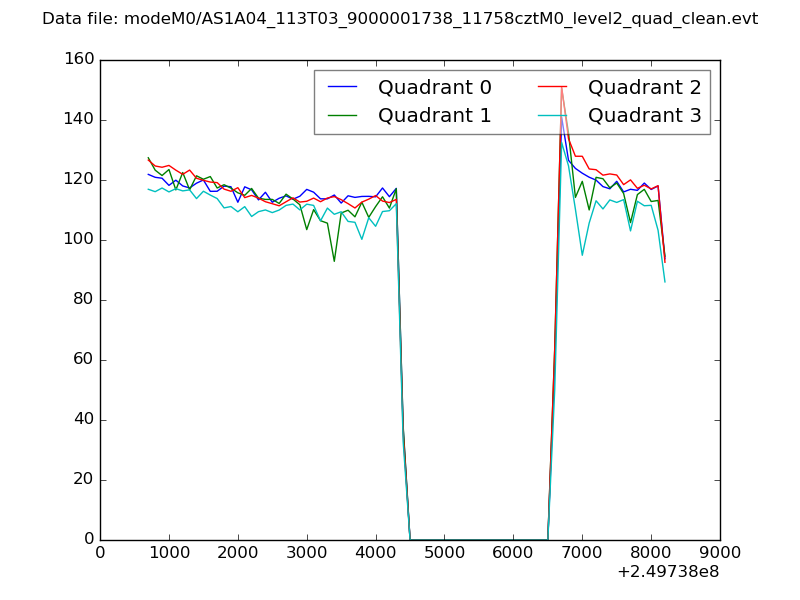 |
|
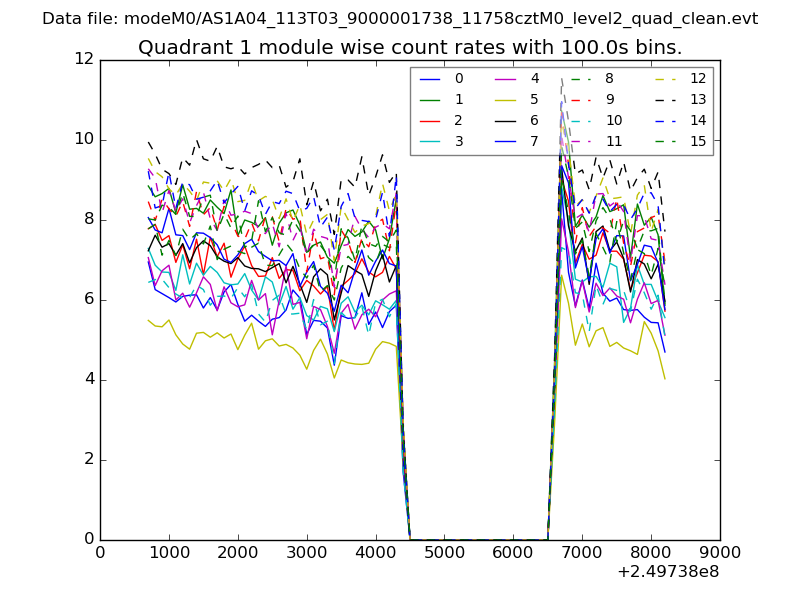
| Module-wise count rates for Quadrant A Data is divided into 100 sec bins |
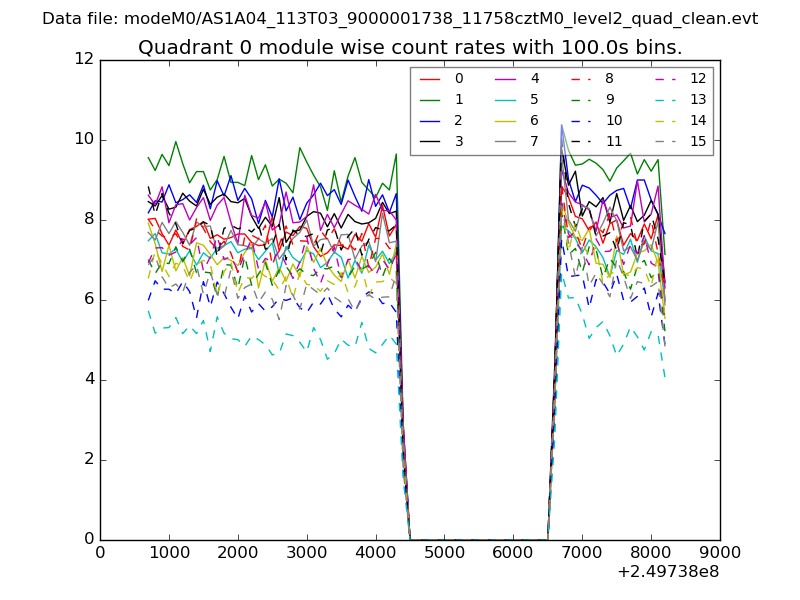 |
 |
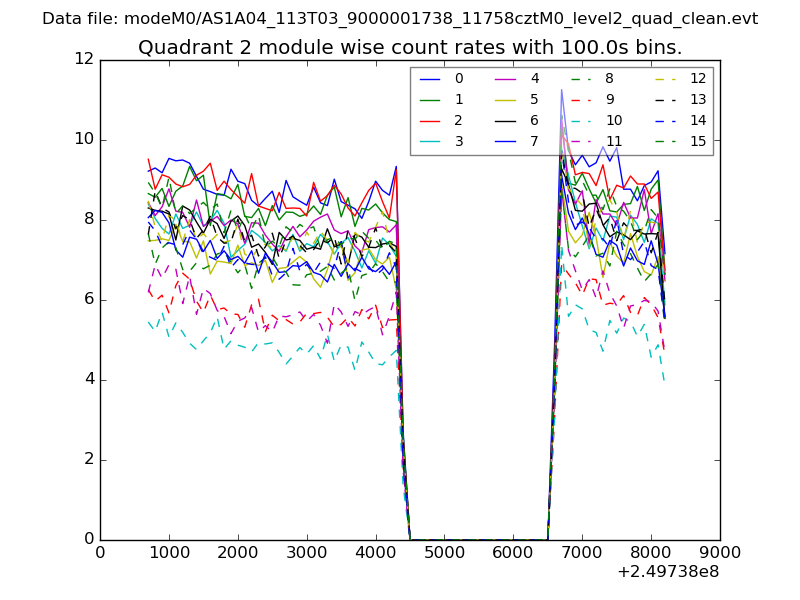
| Module-wise count rates for Quadrant B Data is divided into 100 sec bins |
 |
 |
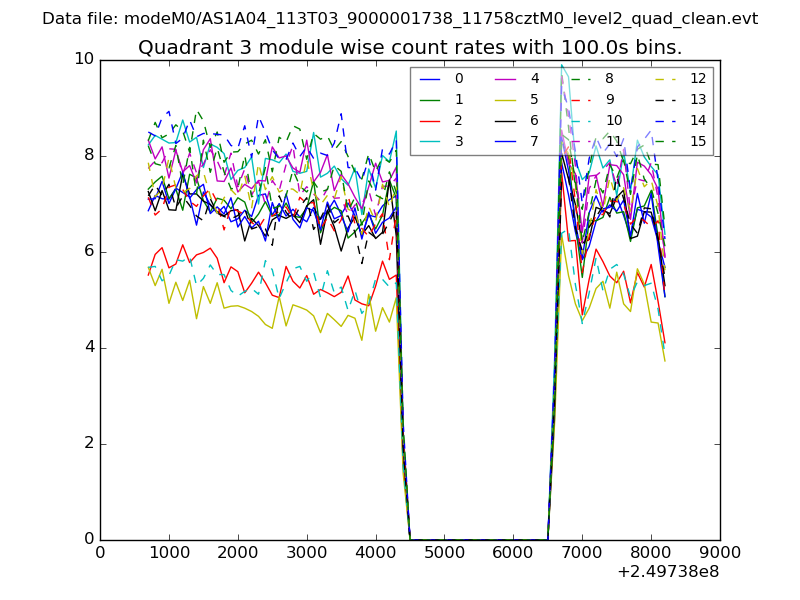
| Module-wise count rates for Quadrant C Data is divided into 100 sec bins |
 |
 |
| Module-wise count rates for Quadrant D Data is divided into 100 sec bins |
 |
 |
| Parameter | Plot |
|---|---|
| CZT HV Monitor | 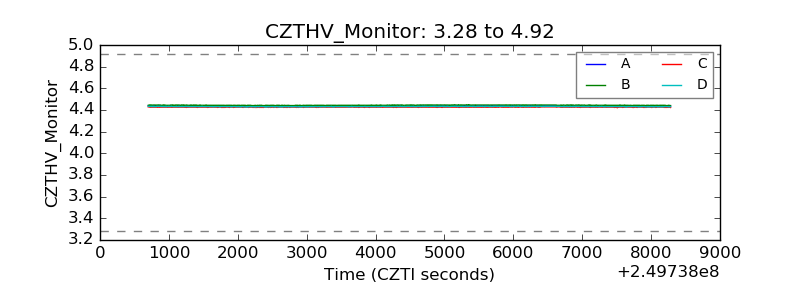 |
| D_VDD |  |
| Temperature 1 | 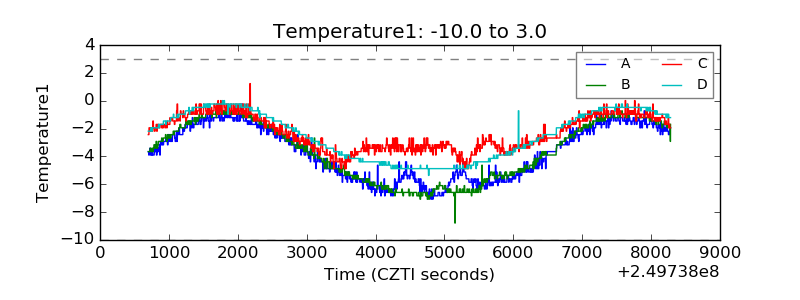 |
| Veto HV Monitor | 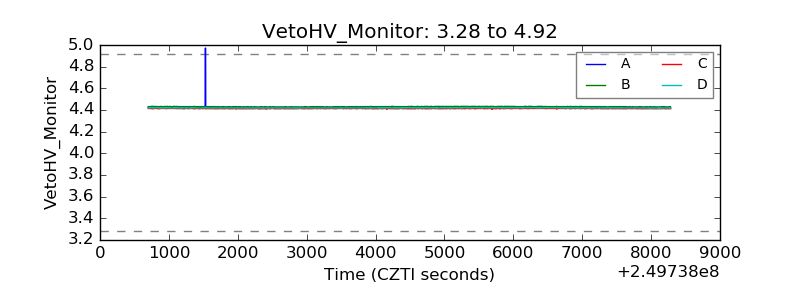 |
| Veto LLD | 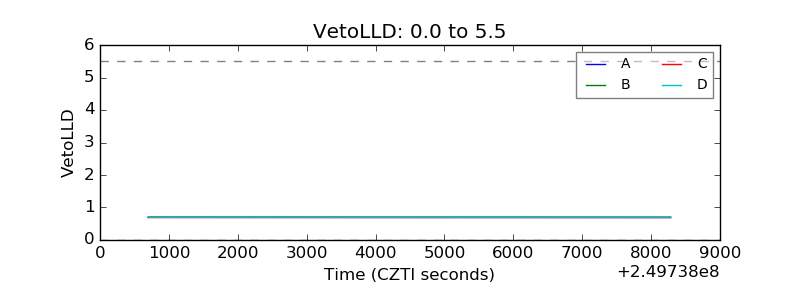 |
| Alpha Counter | 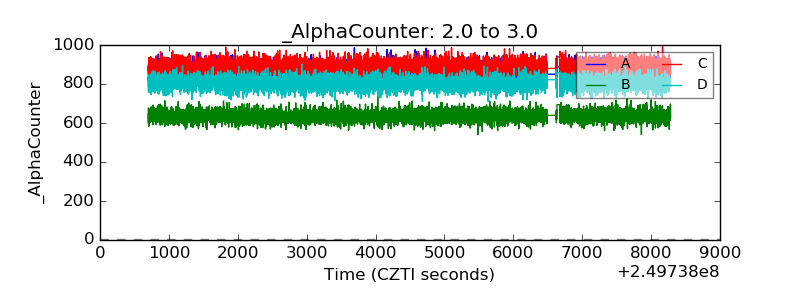 |
| _CPM_Rate | 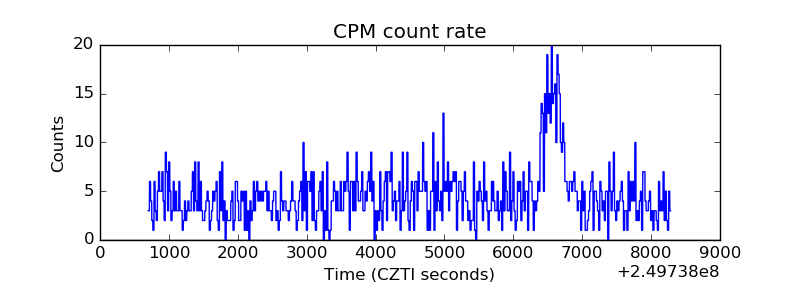 |
| CZT Counter | 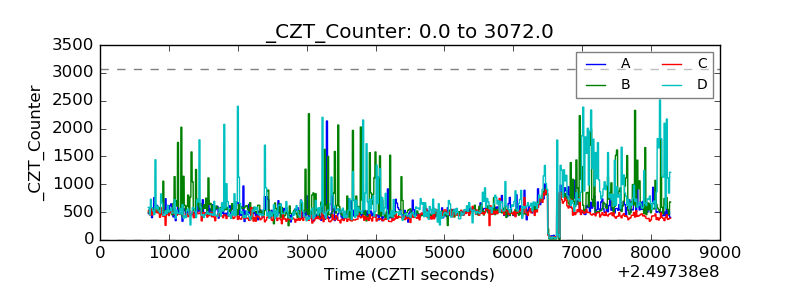 |
| +2.5 Volts monitor |  |
| +5 Volts monitor |  |
| _ROLL_ROT | 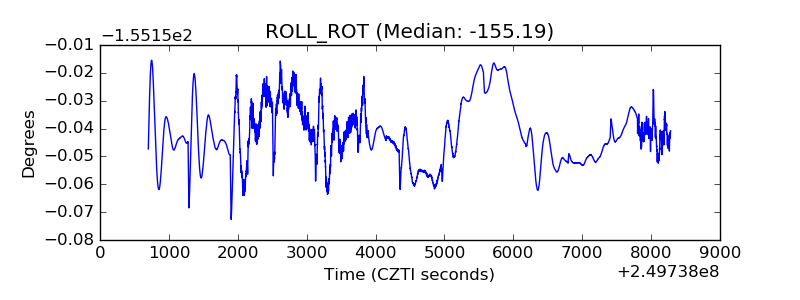 |
| _Roll_DEC | 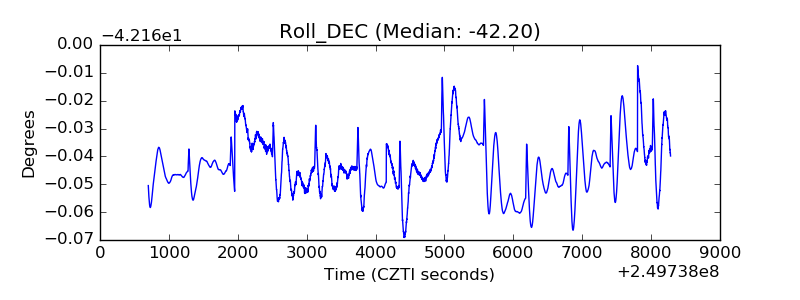 |
| _Roll_RA | 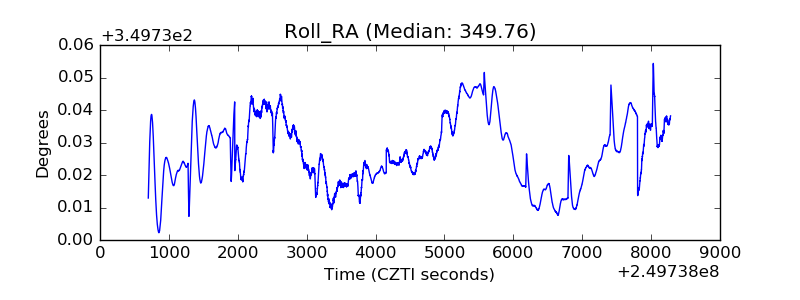 |
| Veto Counter | 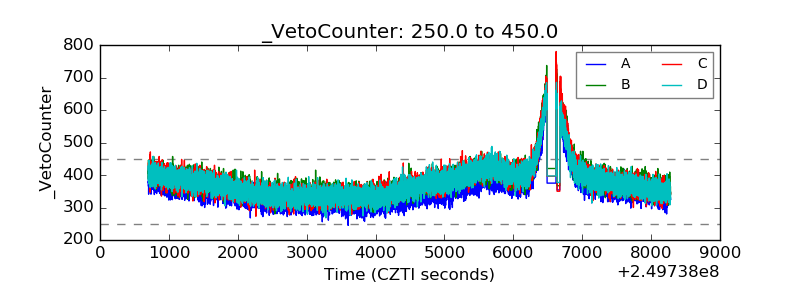 |