| Param | Original file | Final file |
|---|---|---|
| Filename | modeM0/AS1A04_167T04_9000001734cztM0_level2.fits | modeM0/AS1A04_167T04_9000001734cztM0_level2_quad_clean.evt |
| Size (bytes) | 247,596,480 | 281,617,920 |
| Size | 236.1 MB | 268.6 MB |
| Events in quadrant A | 1,480,036 | 1,742,422 |
| Events in quadrant B | 1,408,750 | 1,672,274 |
| Events in quadrant C | 1,490,720 | 1,732,390 |
| Events in quadrant D | 1,267,786 | 1,531,786 |
| Mode M0 | |||
|---|---|---|---|
| Quadrant | BADHDUFLAG | Total packets | Discarded packets |
| A | 0 | 61215 | 0 |
| B | 0 | 71373 | 0 |
| C | 0 | 55471 | 0 |
| D | 0 | 81055 | 0 |
| Mode M9 | |||
|---|---|---|---|
| Quadrant | BADHDUFLAG | Total packets | Discarded packets |
| A | 0 | 21 | 0 |
| B | 0 | 21 | 0 |
| C | 0 | 21 | 0 |
| D | 0 | 21 | 0 |
| Mode SS | |||
|---|---|---|---|
| Quadrant | BADHDUFLAG | Total packets | Discarded packets |
| A | 0 | 546 | 0 |
| B | 0 | 546 | 0 |
| C | 0 | 546 | 0 |
| D | 0 | 546 | 0 |
| Quadrant | Total seconds | Saturated seconds | Saturation percentage |
|---|---|---|---|
| A | 26908 | 888 | 3.300134% |
| B | 26907 | 1676 | 6.228862% |
| C | 26905 | 368 | 1.367776% |
| D | 26908 | 1221 | 4.537684% |
Noise dominated data is calculated using 1-second bins in cleaned event files. If a bin has >2000 counts, and if more than 50% of those come from <1% of pixels, then it is considered to be noise-dominated and hence unusable.
| Quadrant | # 1 sec bins | Bins with >0 counts | Bins with >2000 counts | High rate bins dominated by noise | Noise dominated (total time) | Noise dominated (detector-on time) | Marked lightcurve |
|---|---|---|---|---|---|---|---|
| A | 28065 | 26911 | 0 | 0 | 0.00% | 0.00% |  |
| B | 28065 | 26860 | 0 | 0 | 0.00% | 0.00% |  |
| C | 28065 | 26910 | 0 | 0 | 0.00% | 0.00% |  |
| D | 28065 | 26907 | 0 | 0 | 0.00% | 0.00% |  |
Top three noisy pixels from each quadrant. If the there are fewer than three noisy pixels in the level2.evt file, extra rows are filled as -1
| Pixel properties | Quadrant properties | ||||||
|---|---|---|---|---|---|---|---|
| Quadrant | DetID | PixID | Counts | Sigma | Mean | Median | Sigma |
| A | 0 | 29 | 1440 | 10.97 | 386 | 361 | 98.4 |
| A | 7 | 110 | 1211 | 8.64 | 386 | 361 | 98.4 |
| A | 0 | 30 | 1148 | 8.0 | 386 | 361 | 98.4 |
| B | 2 | 9 | 1209 | 11.27 | 372 | 353 | 75.9 |
| B | 5 | 225 | 959 | 7.98 | 372 | 353 | 75.9 |
| B | 3 | 17 | 919 | 7.45 | 372 | 353 | 75.9 |
| C | 12 | 241 | 1023 | 6.36 | 394 | 367 | 103.1 |
| C | 3 | 158 | 997 | 6.11 | 394 | 367 | 103.1 |
| C | 2 | 191 | 982 | 5.97 | 394 | 367 | 103.1 |
| D | 6 | 231 | 949 | 6.22 | 361 | 327 | 100.0 |
| D | 7 | 3 | 925 | 5.98 | 361 | 327 | 100.0 |
| D | 3 | 14 | 922 | 5.95 | 361 | 327 | 100.0 |
Histogram calculated using DETX and DETY for each event in the final _common_clean file
| Quadrant A |  |
 |
Quadrant B |
|---|---|---|---|
| Quadrant D |  |
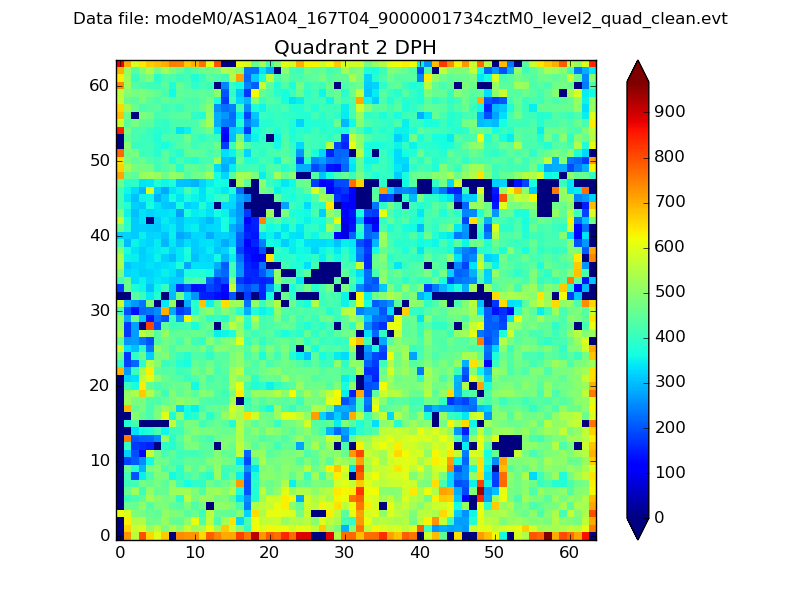 |
Quadrant C |
| Plot type | Count rate plots | Images |
|---|---|---|
| Comparison with Poisson distribution Blue bars denote a histogram of data divided into 1 sec bins. Red curve is a Poisson curve with rate = median count rate of data. |
 |
 |
| Quadrant-wise count rates Data is divided into 100 sec bins |
 |
|
| Module-wise count rates for Quadrant A Data is divided into 100 sec bins |
 |
 |
| Module-wise count rates for Quadrant B Data is divided into 100 sec bins |
 |
 |
| Module-wise count rates for Quadrant C Data is divided into 100 sec bins |
 |
 |
| Module-wise count rates for Quadrant D Data is divided into 100 sec bins |
 |
 |
| Parameter | Plot |
|---|---|
| CZT HV Monitor |  |
| D_VDD | 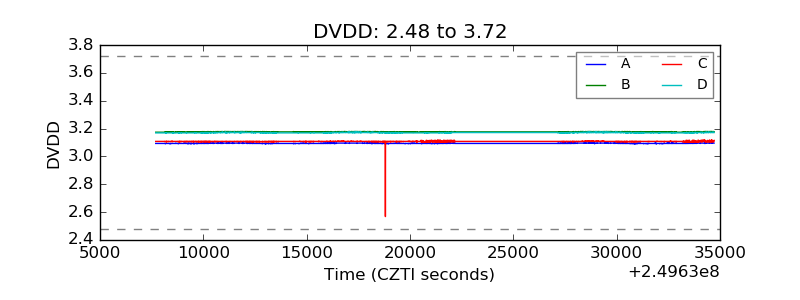 |
| Temperature 1 |  |
| Veto HV Monitor |  |
| Veto LLD |  |
| Alpha Counter |  |
| _CPM_Rate |  |
| CZT Counter |  |
| +2.5 Volts monitor |  |
| +5 Volts monitor |  |
| _ROLL_ROT |  |
| _Roll_DEC |  |
| _Roll_RA |  |
| Veto Counter |  |