| Param | Original file | Final file |
|---|---|---|
| Filename | modeM0/AS1A04_167T04_9000001734_11741cztM0_level2.evt | modeM0/AS1A04_167T04_9000001734_11741cztM0_level2_quad_clean.evt |
| Size (bytes) | 571,780,800 | 83,191,680 |
| Size | 545.3 MB | 79.3 MB |
| Events in quadrant A | 3,711,572 | 510,404 |
| Events in quadrant B | 4,559,402 | 506,106 |
| Events in quadrant C | 3,287,738 | 527,851 |
| Events in quadrant D | 5,284,384 | 488,172 |
| Mode M0 | |||
|---|---|---|---|
| Quadrant | BADHDUFLAG | Total packets | Discarded packets |
| A | 0 | 15306 | 3 |
| B | 0 | 17857 | 2 |
| C | 0 | 14401 | 2 |
| D | 0 | 20632 | 2 |
| Mode M9 | |||
|---|---|---|---|
| Quadrant | BADHDUFLAG | Total packets | Discarded packets |
| A | 0 | 11 | 0 |
| B | 0 | 11 | 0 |
| C | 0 | 11 | 0 |
| D | 0 | 12 | 0 |
| Mode SS | |||
|---|---|---|---|
| Quadrant | BADHDUFLAG | Total packets | Discarded packets |
| A | 0 | 142 | 0 |
| B | 0 | 142 | 0 |
| C | 0 | 142 | 0 |
| D | 0 | 142 | 0 |
| Quadrant | Total seconds | Saturated seconds | Saturation percentage |
|---|---|---|---|
| A | 6983 | 210 | 3.007303% |
| B | 6983 | 406 | 5.814120% |
| C | 6983 | 124 | 1.775741% |
| D | 6983 | 256 | 3.666046% |
Noise dominated data is calculated using 1-second bins in cleaned event files. If a bin has >2000 counts, and if more than 50% of those come from <1% of pixels, then it is considered to be noise-dominated and hence unusable.
| Quadrant | # 1 sec bins | Bins with >0 counts | Bins with >2000 counts | High rate bins dominated by noise | Noise dominated (total time) | Noise dominated (detector-on time) | Marked lightcurve |
|---|---|---|---|---|---|---|---|
| A | 7684 | 6985 | 0 | 0 | 0.00% | 0.00% | 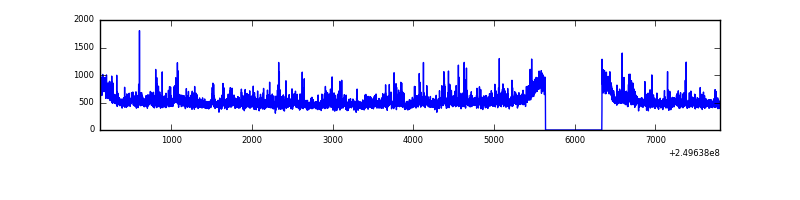 |
| B | 7684 | 6985 | 152 | 152 | 1.98% | 2.18% | 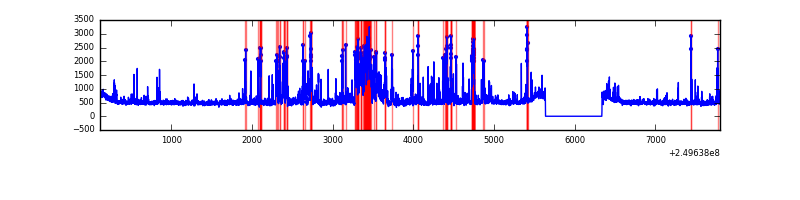 |
| C | 7684 | 6985 | 0 | 0 | 0.00% | 0.00% | 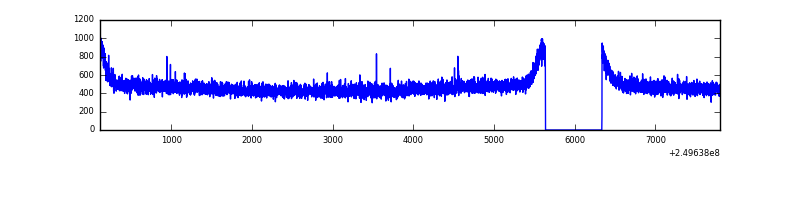 |
| D | 7684 | 6985 | 108 | 108 | 1.41% | 1.55% | 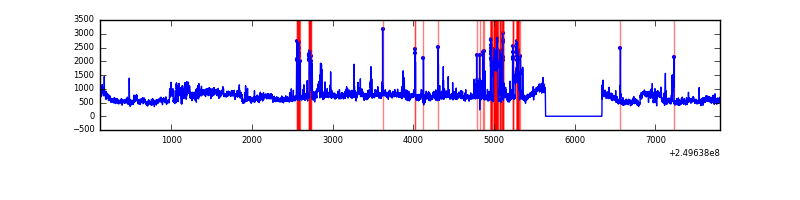 |
Top three noisy pixels from each quadrant. If the there are fewer than three noisy pixels in the level2.evt file, extra rows are filled as -1
| Pixel properties | Quadrant properties | ||||||
|---|---|---|---|---|---|---|---|
| Quadrant | DetID | PixID | Counts | Sigma | Mean | Median | Sigma |
| A | 8 | 15 | 109705 | 627.98 | 854 | 834 | 173.4 |
| A | 1 | 162 | 107171 | 613.37 | 854 | 834 | 173.4 |
| A | 1 | 178 | 57943 | 329.41 | 854 | 834 | 173.4 |
| B | 4 | 239 | 907642 | 5570.71 | 849 | 827 | 162.8 |
| B | 15 | 204 | 158166 | 966.56 | 849 | 827 | 162.8 |
| B | 3 | 64 | 129328 | 789.4 | 849 | 827 | 162.8 |
| C | 13 | 61 | 6087 | 26.92 | 843 | 849 | 194.6 |
| C | 12 | 4 | 2573 | 8.86 | 843 | 849 | 194.6 |
| C | 3 | 202 | 2063 | 6.24 | 843 | 849 | 194.6 |
| D | 8 | 195 | 965450 | 4854.82 | 829 | 805 | 198.7 |
| D | 1 | 52 | 663473 | 3335.05 | 829 | 805 | 198.7 |
| D | 9 | 85 | 257316 | 1290.96 | 829 | 805 | 198.7 |
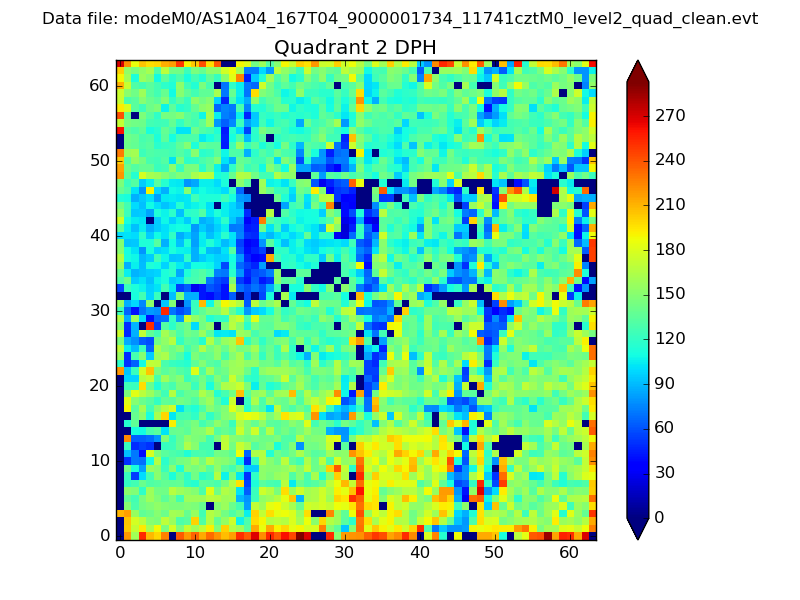
Histogram calculated using DETX and DETY for each event in the final _common_clean file
| Quadrant A | 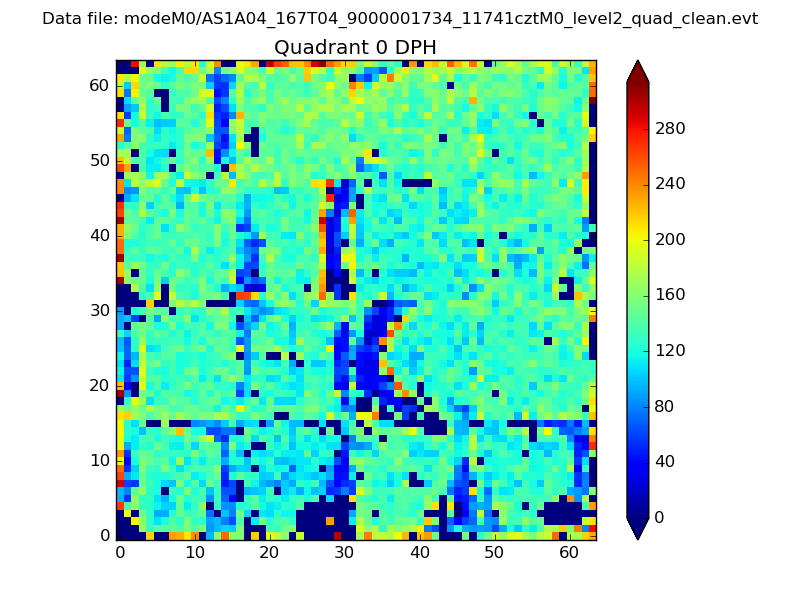 |
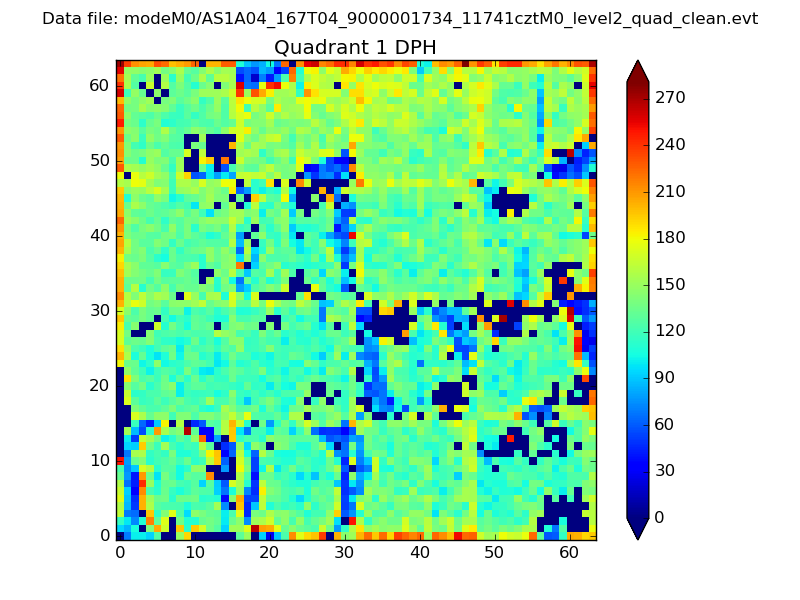 |
Quadrant B |
|---|---|---|---|
| Quadrant D | 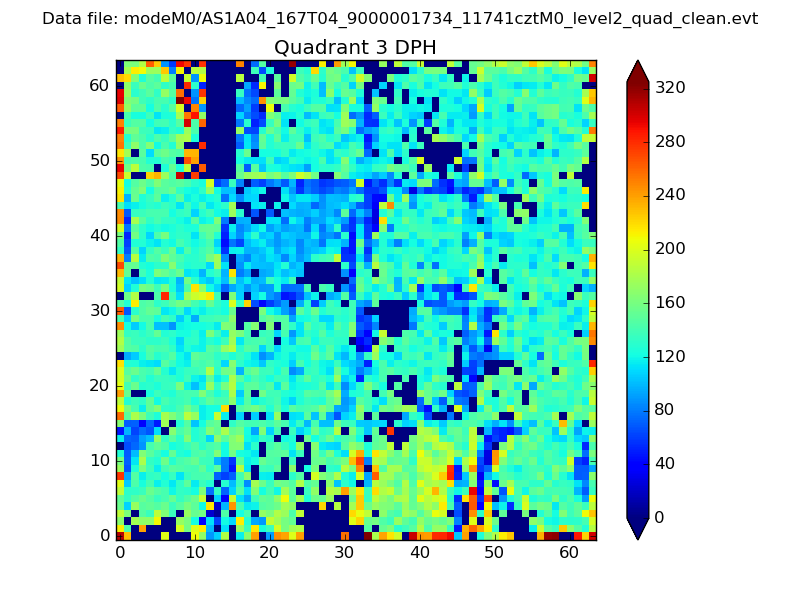 |
 |
Quadrant C |
| Plot type | Count rate plots | Images |
|---|---|---|
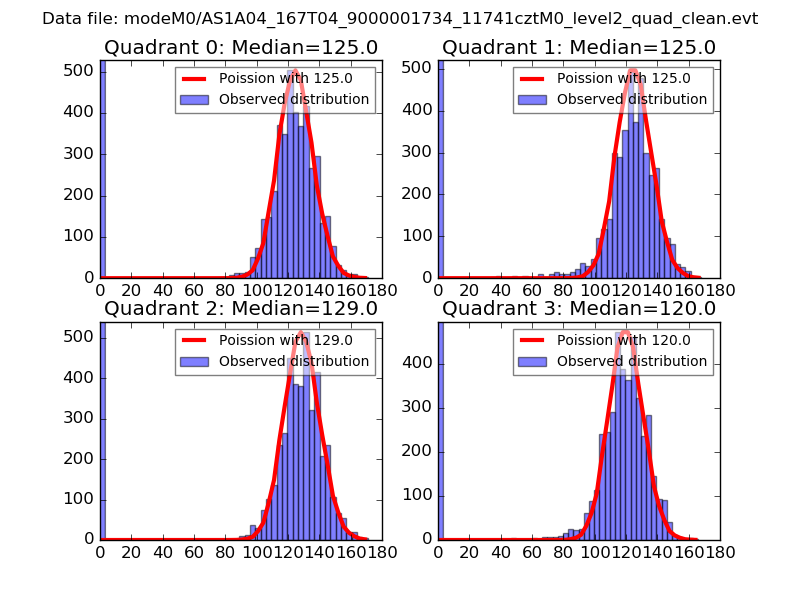
| Comparison with Poisson distribution Blue bars denote a histogram of data divided into 1 sec bins. Red curve is a Poisson curve with rate = median count rate of data. |
 |
 |
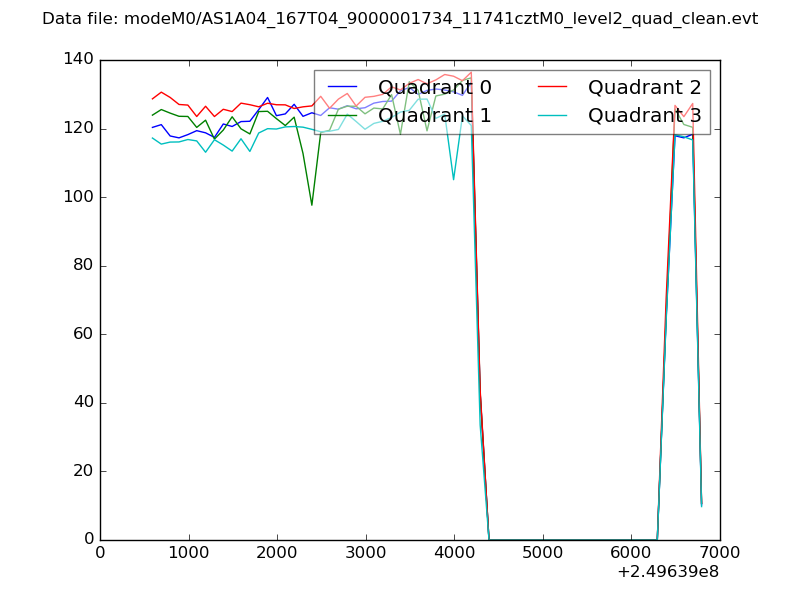
| Quadrant-wise count rates Data is divided into 100 sec bins |
 |
|
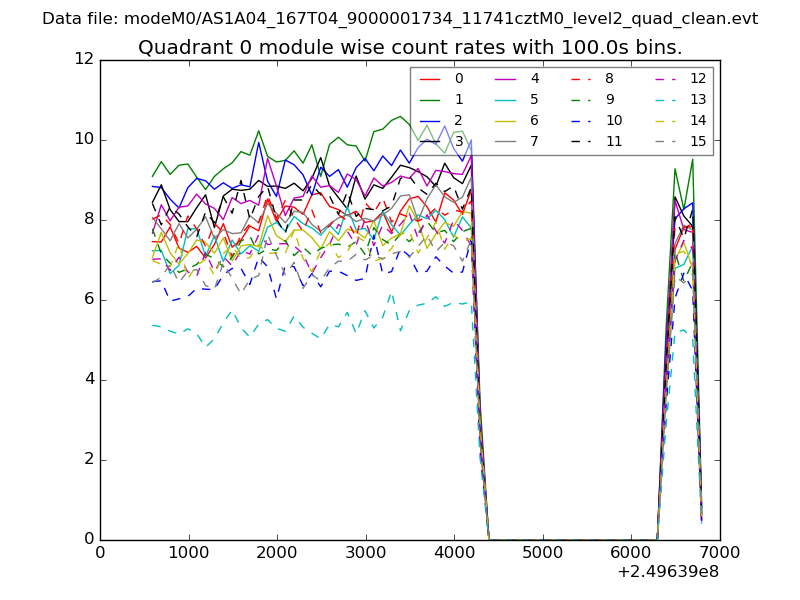
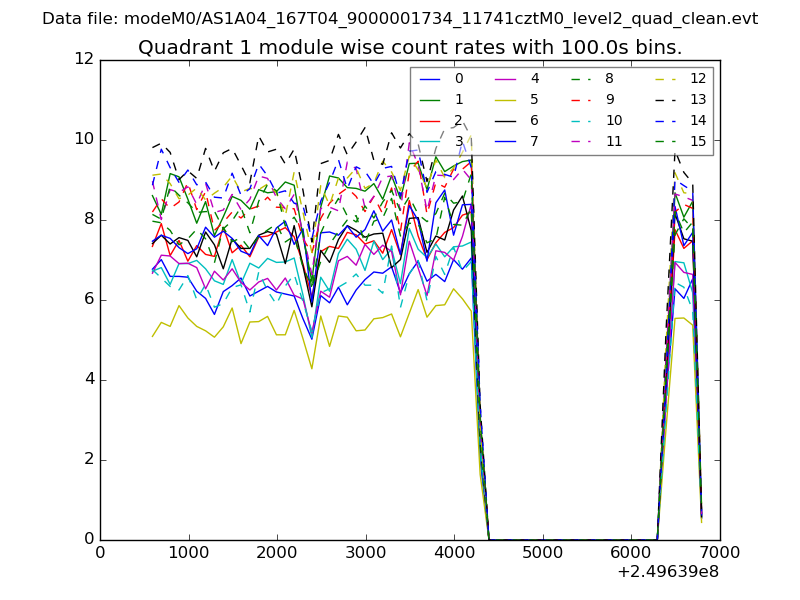
| Module-wise count rates for Quadrant A Data is divided into 100 sec bins |
 |
 |
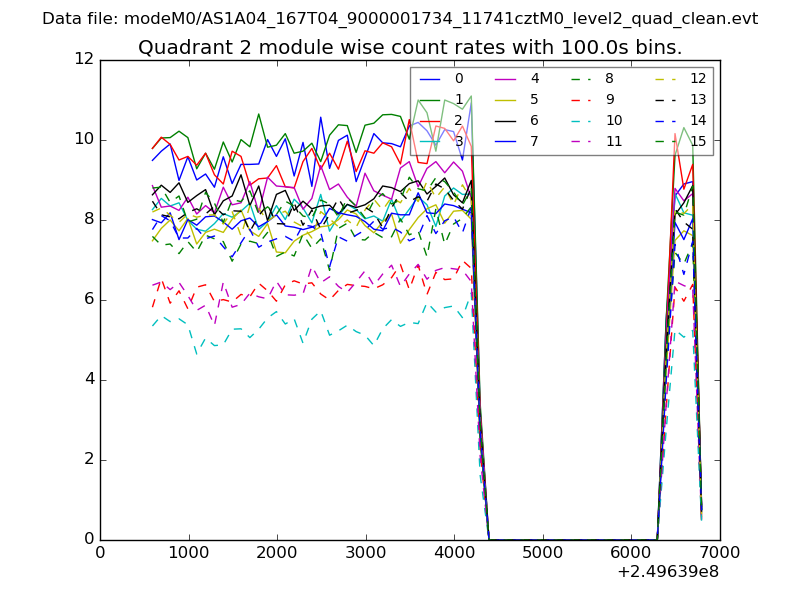
| Module-wise count rates for Quadrant B Data is divided into 100 sec bins |
 |
 |
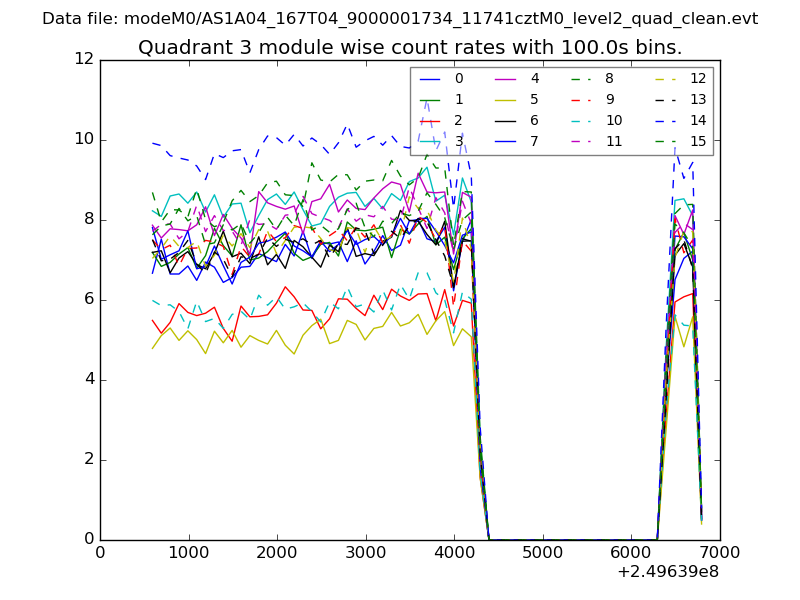
| Module-wise count rates for Quadrant C Data is divided into 100 sec bins |
 |
 |
| Module-wise count rates for Quadrant D Data is divided into 100 sec bins |
 |
 |
| Parameter | Plot |
|---|---|
| CZT HV Monitor | 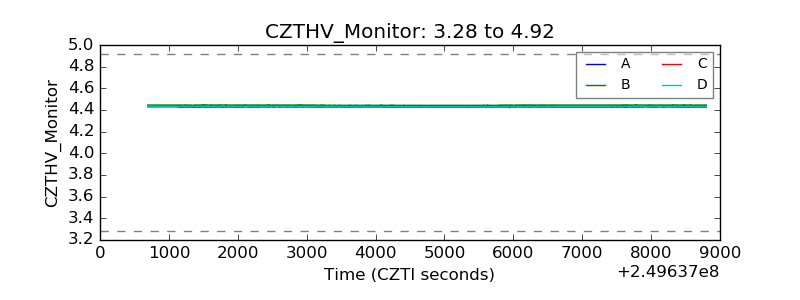 |
| D_VDD | 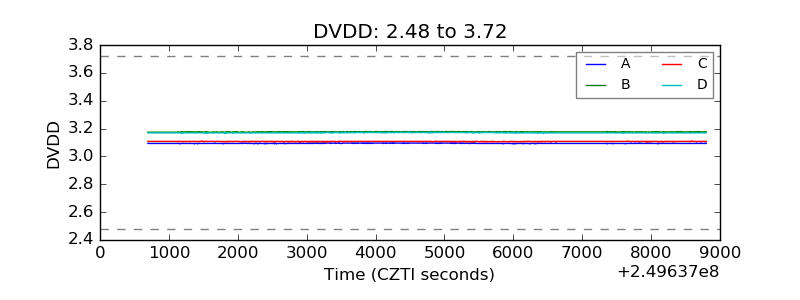 |
| Temperature 1 | 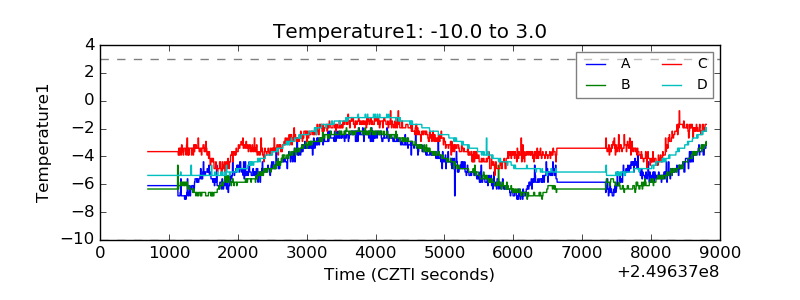 |
| Veto HV Monitor | 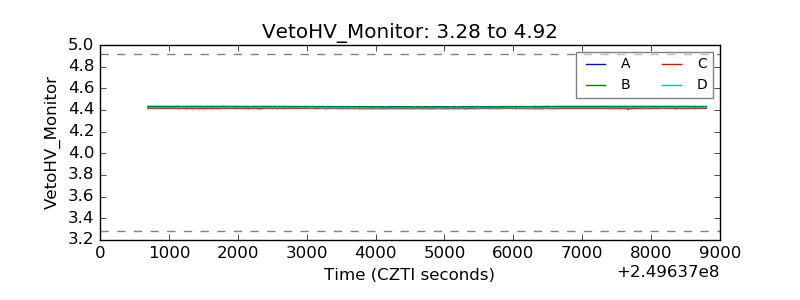 |
| Veto LLD | 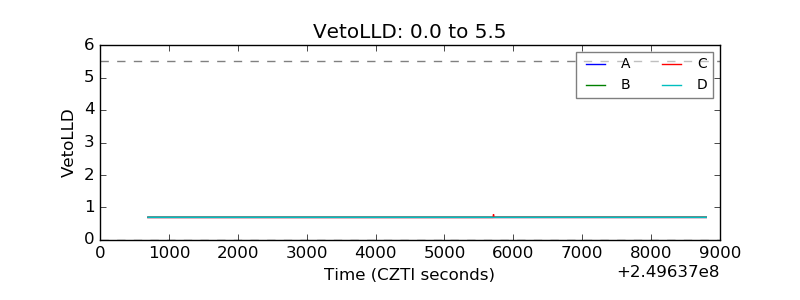 |
| Alpha Counter | 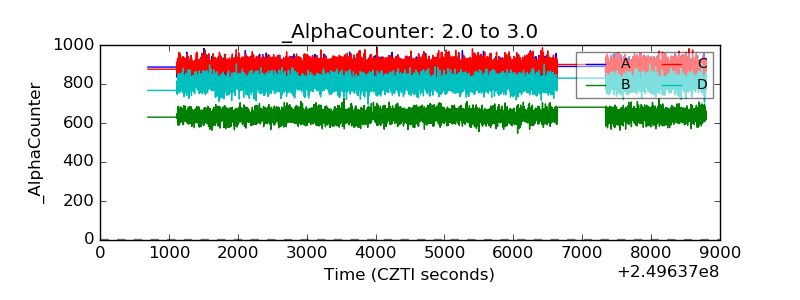 |
| _CPM_Rate | 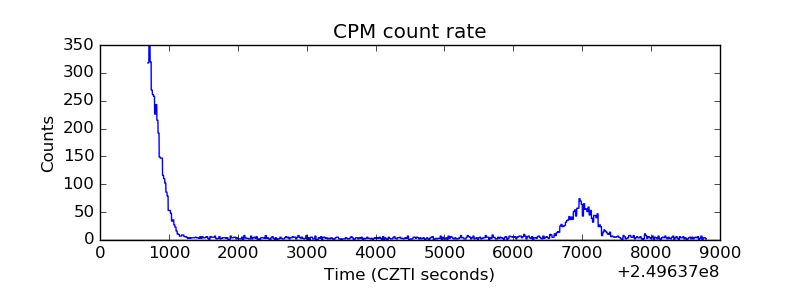 |
| CZT Counter | 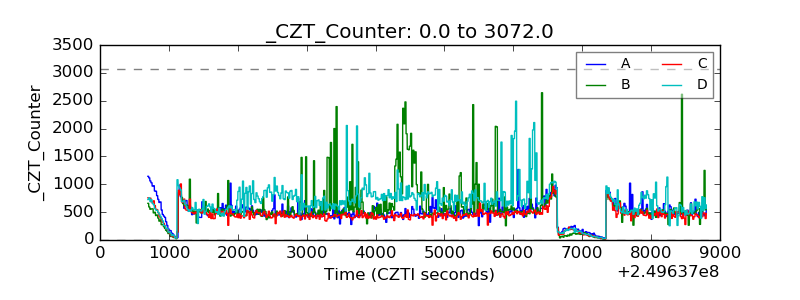 |
| +2.5 Volts monitor |  |
| +5 Volts monitor |  |
| _ROLL_ROT | 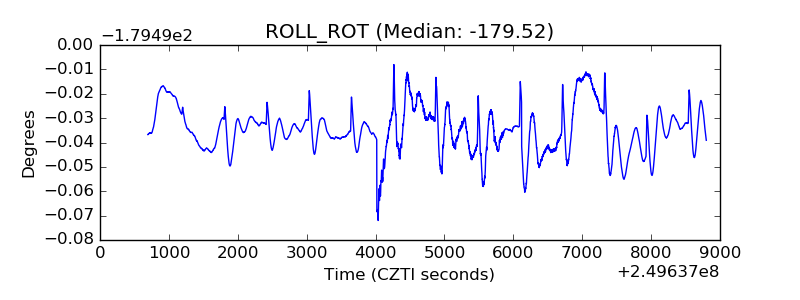 |
| _Roll_DEC | 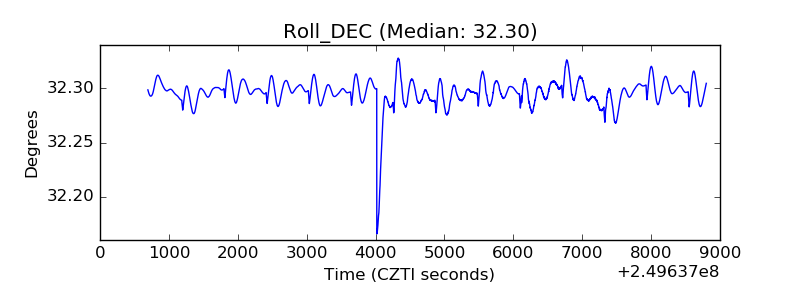 |
| _Roll_RA | 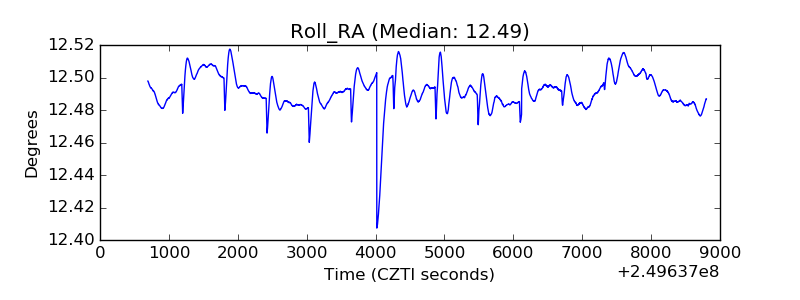 |
| Veto Counter | 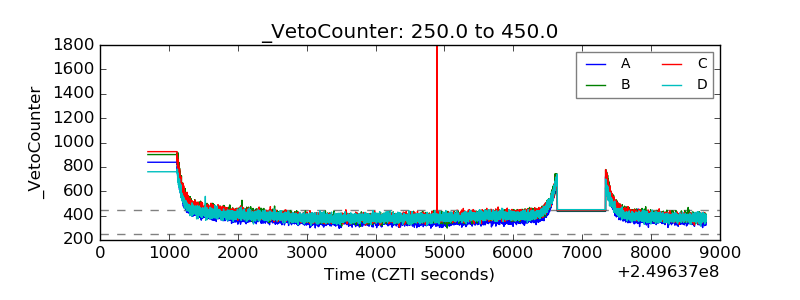 |