| Param | Original file | Final file |
|---|---|---|
| Filename | modeM0/AS1A04_167T04_9000001734_11744cztM0_level2.evt | modeM0/AS1A04_167T04_9000001734_11744cztM0_level2_quad_clean.evt |
| Size (bytes) | 594,135,360 | 98,409,600 |
| Size | 566.6 MB | 93.9 MB |
| Events in quadrant A | 3,873,375 | 620,371 |
| Events in quadrant B | 4,836,707 | 615,803 |
| Events in quadrant C | 3,303,856 | 640,394 |
| Events in quadrant D | 5,486,060 | 596,449 |
| Mode M0 | |||
|---|---|---|---|
| Quadrant | BADHDUFLAG | Total packets | Discarded packets |
| A | 0 | 16105 | 3 |
| B | 0 | 19104 | 2 |
| C | 0 | 14892 | 2 |
| D | 0 | 21493 | 2 |
| Mode M9 | |||
|---|---|---|---|
| Quadrant | BADHDUFLAG | Total packets | Discarded packets |
| A | 0 | 2 | 0 |
| B | 0 | 2 | 0 |
| C | 0 | 2 | 0 |
| D | 0 | 2 | 0 |
| Mode SS | |||
|---|---|---|---|
| Quadrant | BADHDUFLAG | Total packets | Discarded packets |
| A | 0 | 150 | 0 |
| B | 0 | 150 | 0 |
| C | 0 | 150 | 0 |
| D | 0 | 150 | 0 |
| Quadrant | Total seconds | Saturated seconds | Saturation percentage |
|---|---|---|---|
| A | 7275 | 131 | 1.800687% |
| B | 7275 | 327 | 4.494845% |
| C | 7275 | 48 | 0.659794% |
| D | 7275 | 280 | 3.848797% |
Noise dominated data is calculated using 1-second bins in cleaned event files. If a bin has >2000 counts, and if more than 50% of those come from <1% of pixels, then it is considered to be noise-dominated and hence unusable.
| Quadrant | # 1 sec bins | Bins with >0 counts | Bins with >2000 counts | High rate bins dominated by noise | Noise dominated (total time) | Noise dominated (detector-on time) | Marked lightcurve |
|---|---|---|---|---|---|---|---|
| A | 7566 | 7278 | 3 | 3 | 0.04% | 0.04% | 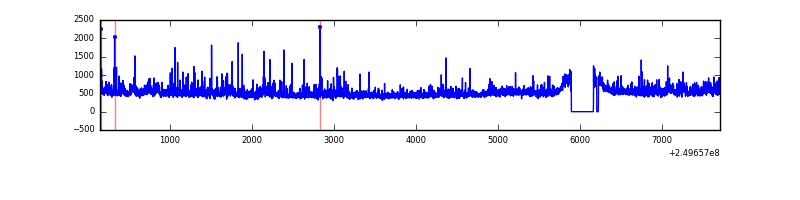 |
| B | 7566 | 7278 | 118 | 118 | 1.56% | 1.62% | 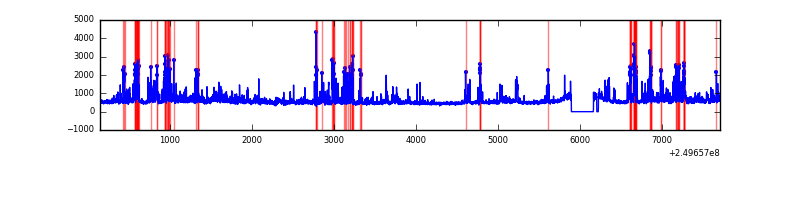 |
| C | 7566 | 7278 | 0 | 0 | 0.00% | 0.00% | 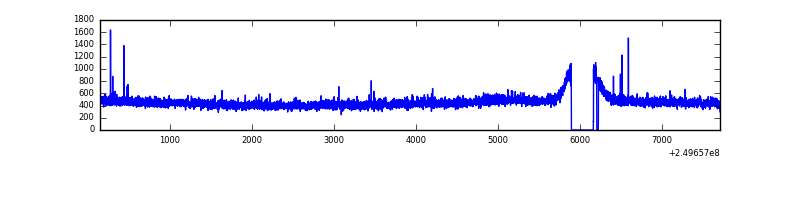 |
| D | 7566 | 7278 | 159 | 159 | 2.10% | 2.18% | 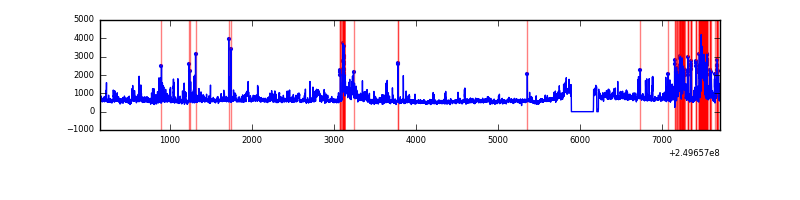 |
Top three noisy pixels from each quadrant. If the there are fewer than three noisy pixels in the level2.evt file, extra rows are filled as -1
| Pixel properties | Quadrant properties | ||||||
|---|---|---|---|---|---|---|---|
| Quadrant | DetID | PixID | Counts | Sigma | Mean | Median | Sigma |
| A | 8 | 15 | 149606 | 840.11 | 862 | 842 | 177.1 |
| A | 1 | 162 | 130831 | 734.08 | 862 | 842 | 177.1 |
| A | 1 | 178 | 62629 | 348.93 | 862 | 842 | 177.1 |
| B | 4 | 239 | 743039 | 4548.51 | 851 | 828 | 163.2 |
| B | 15 | 204 | 341138 | 2085.53 | 851 | 828 | 163.2 |
| B | 11 | 51 | 153109 | 933.23 | 851 | 828 | 163.2 |
| C | 14 | 234 | 12451 | 59.08 | 842 | 848 | 196.4 |
| C | 13 | 61 | 6160 | 27.05 | 842 | 848 | 196.4 |
| C | 8 | 128 | 3803 | 15.05 | 842 | 848 | 196.4 |
| D | 8 | 195 | 1048288 | 5189.98 | 832 | 809 | 201.8 |
| D | 1 | 52 | 914226 | 4525.74 | 832 | 809 | 201.8 |
| D | 5 | 222 | 163301 | 805.1 | 832 | 809 | 201.8 |
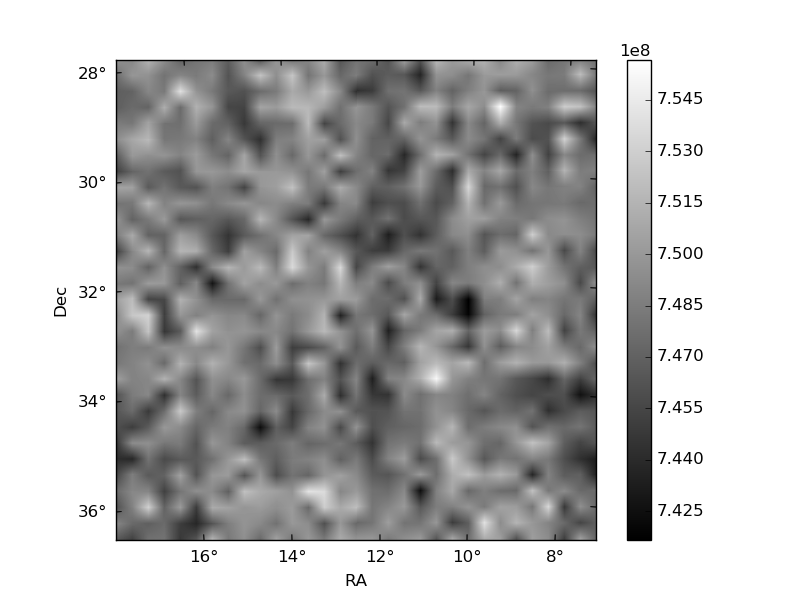
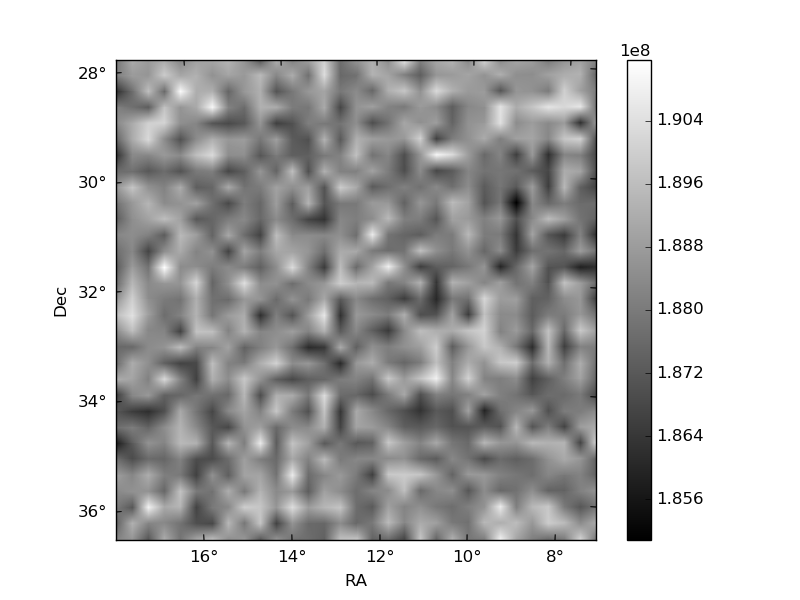
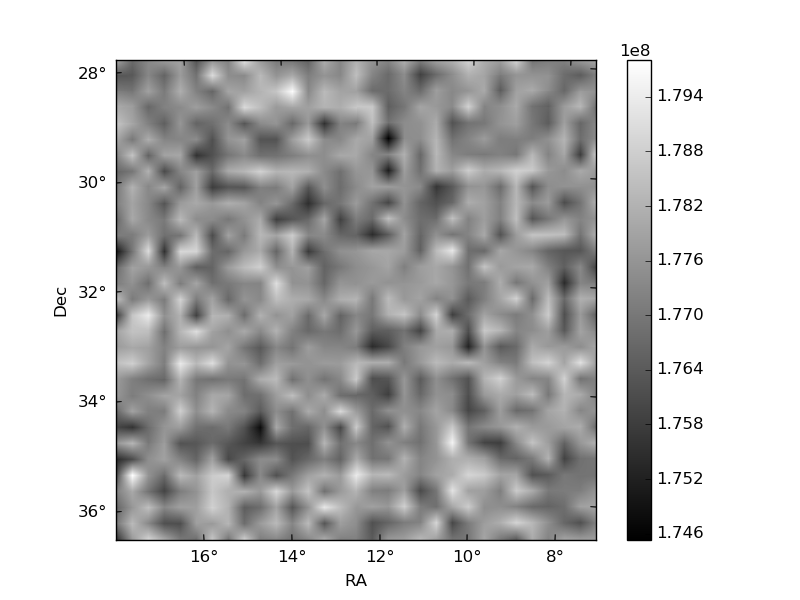
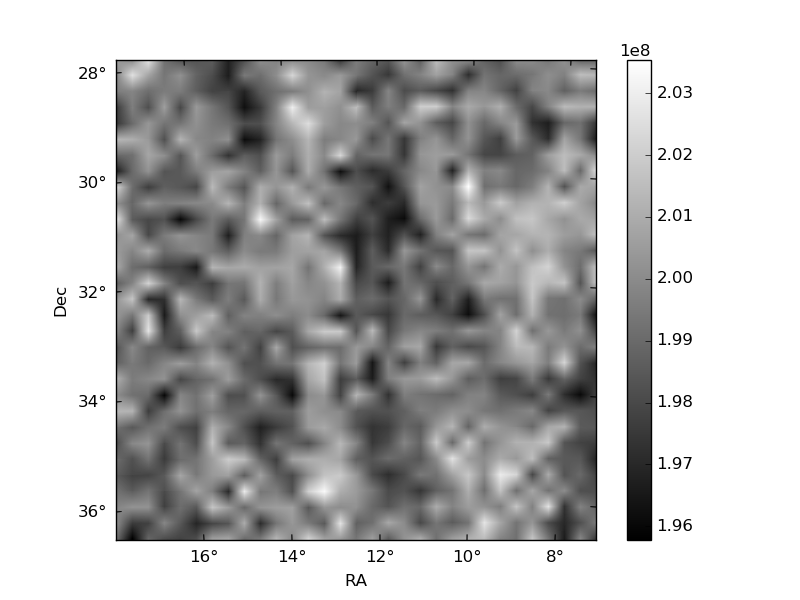
Histogram calculated using DETX and DETY for each event in the final _common_clean file
| Quadrant A | 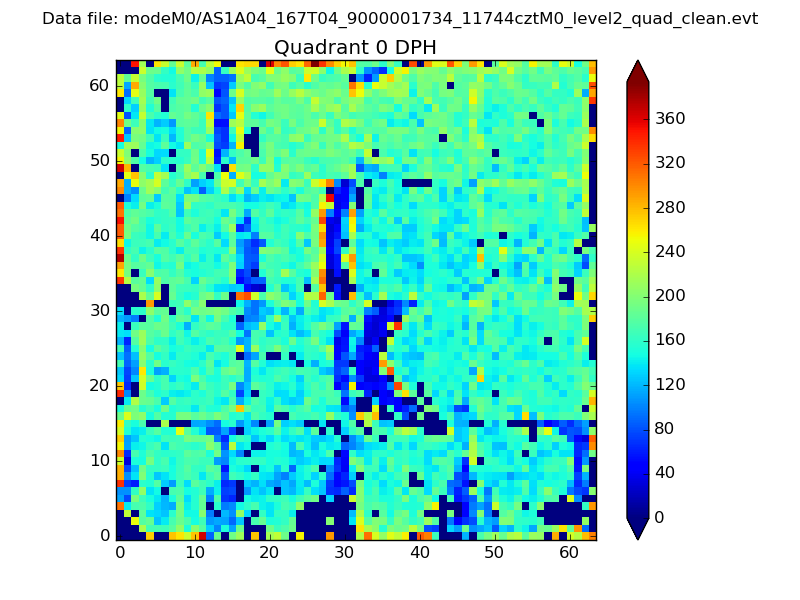 |
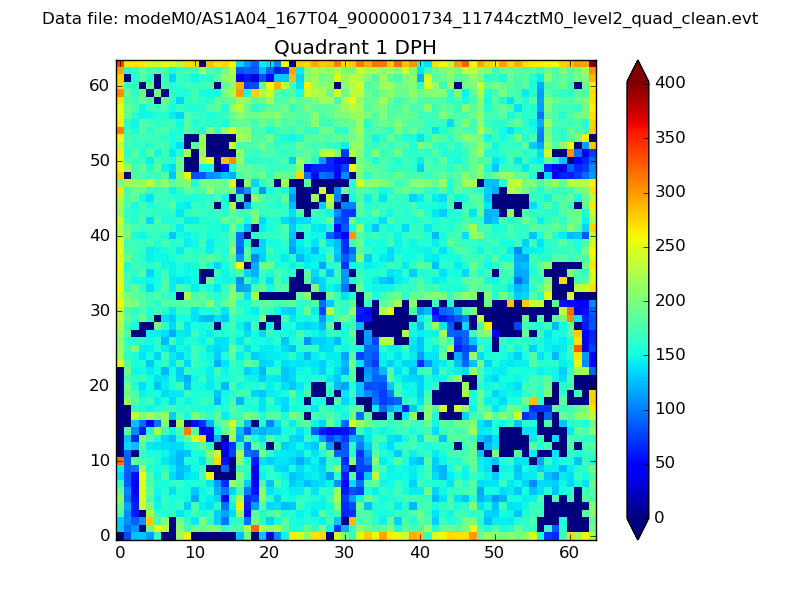 |
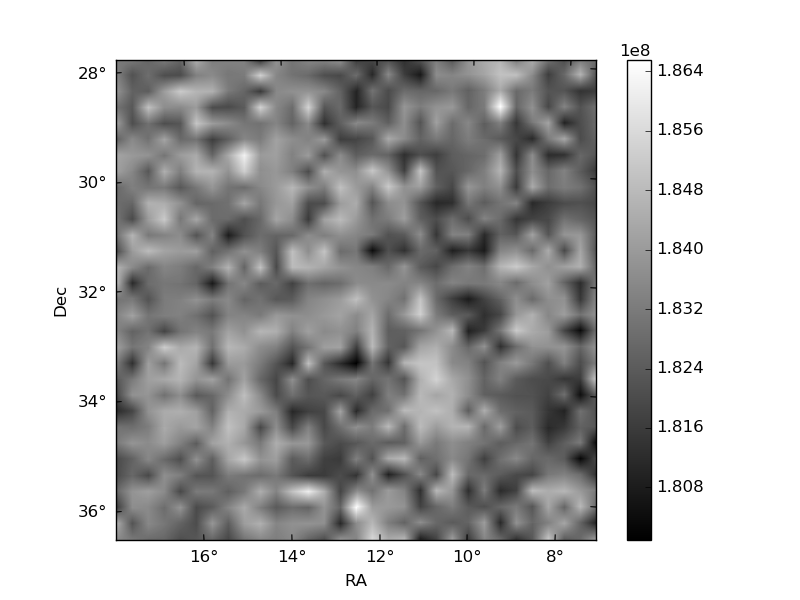
Quadrant B |
|---|---|---|---|
| Quadrant D | 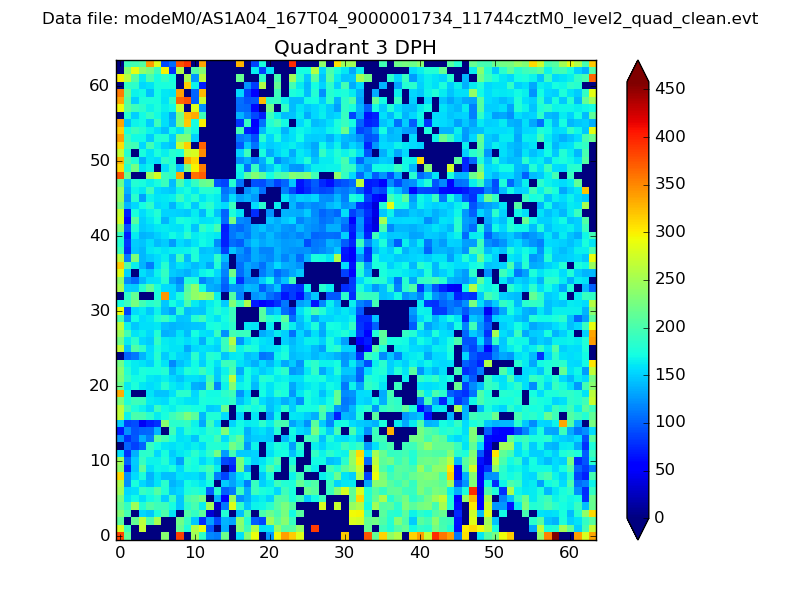 |
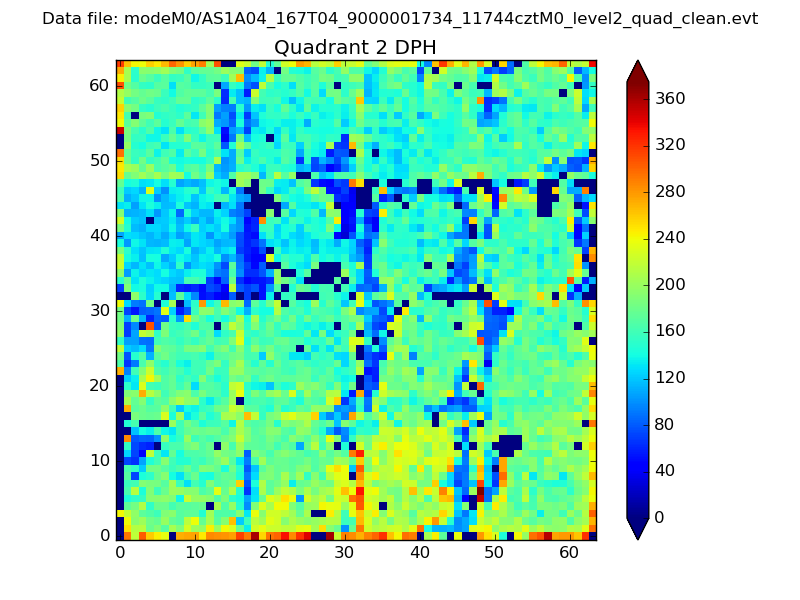 |
Quadrant C |
| Plot type | Count rate plots | Images |
|---|---|---|
| Comparison with Poisson distribution Blue bars denote a histogram of data divided into 1 sec bins. Red curve is a Poisson curve with rate = median count rate of data. |
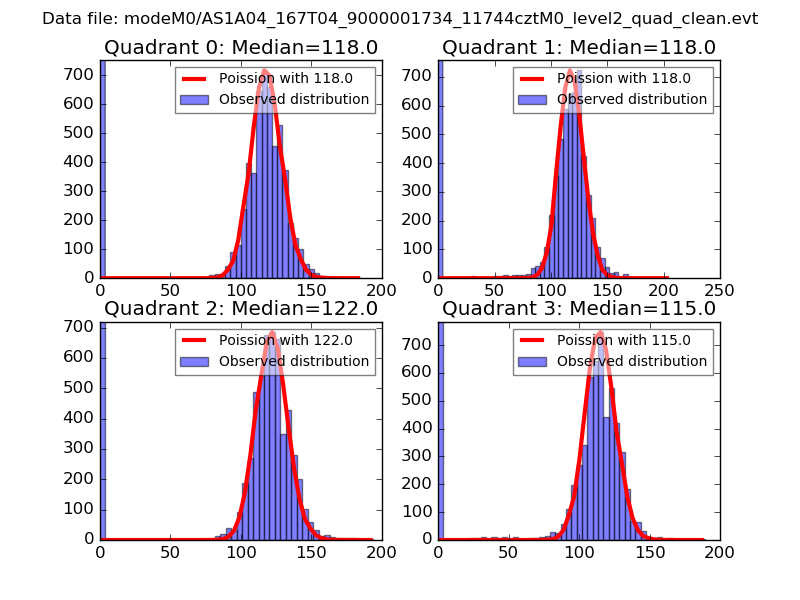 |
 |
| Quadrant-wise count rates Data is divided into 100 sec bins |
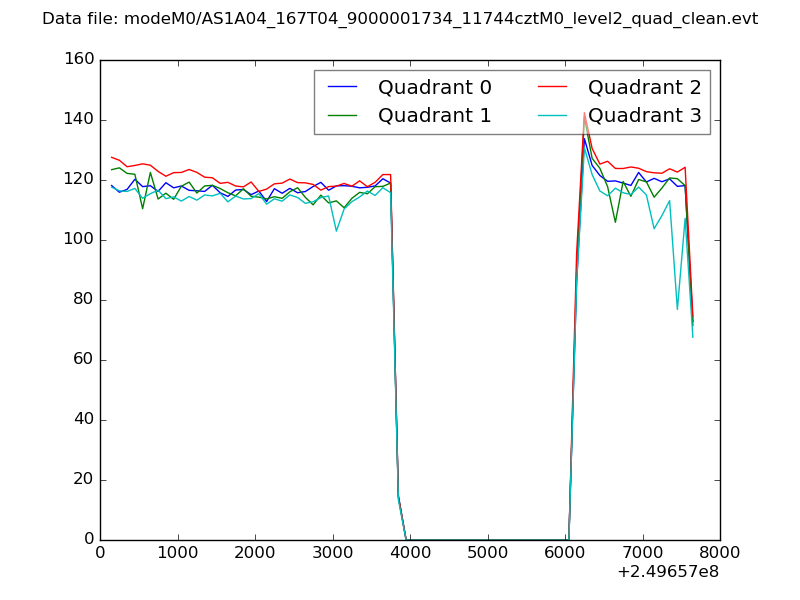 |
|
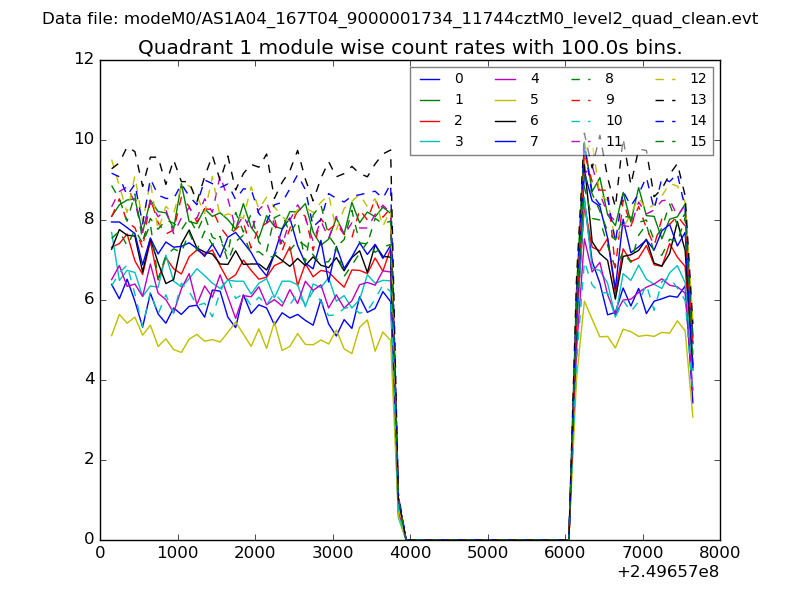
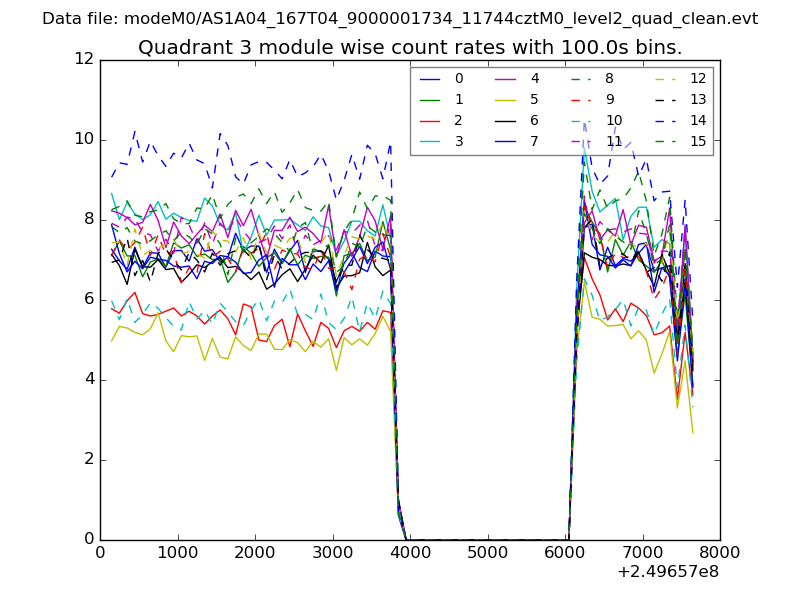
| Module-wise count rates for Quadrant A Data is divided into 100 sec bins |
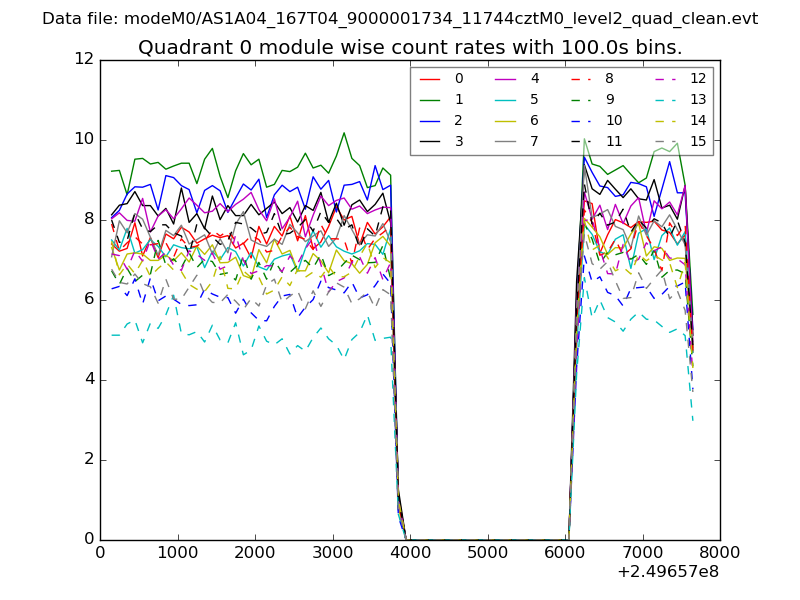 |
 |
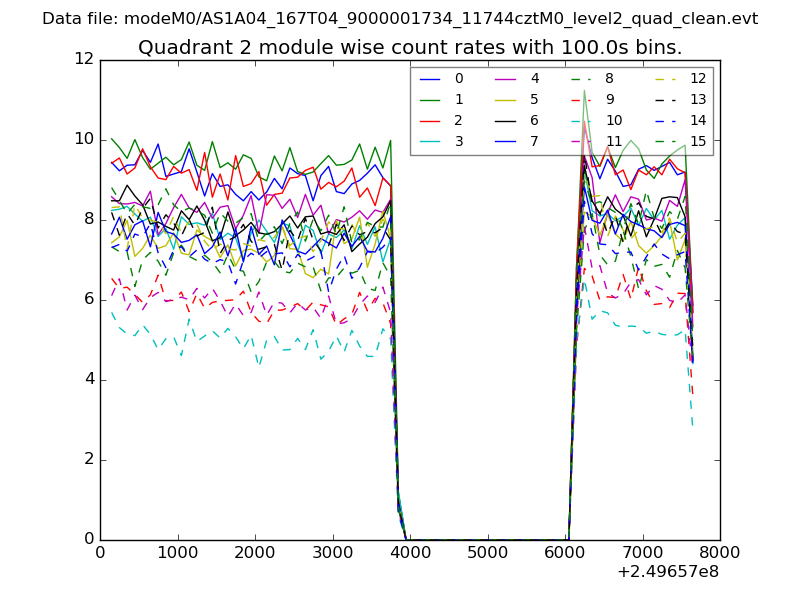
| Module-wise count rates for Quadrant B Data is divided into 100 sec bins |
 |
 |
| Module-wise count rates for Quadrant C Data is divided into 100 sec bins |
 |
 |
| Module-wise count rates for Quadrant D Data is divided into 100 sec bins |
 |
 |
| Parameter | Plot |
|---|---|
| CZT HV Monitor | 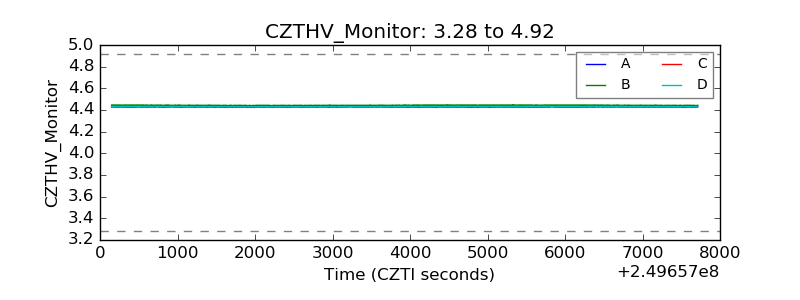 |
| D_VDD | 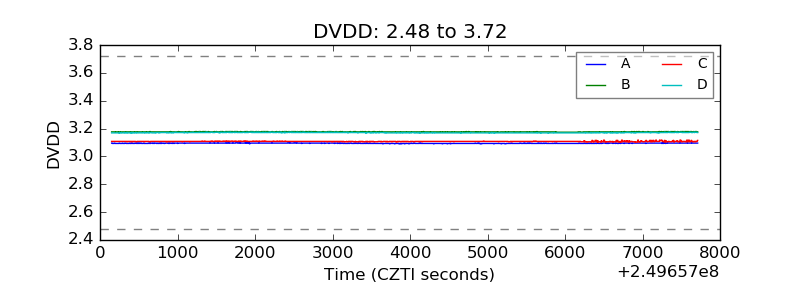 |
| Temperature 1 | 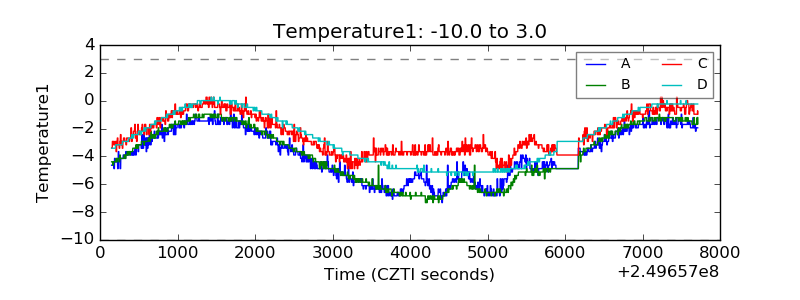 |
| Veto HV Monitor |  |
| Veto LLD | 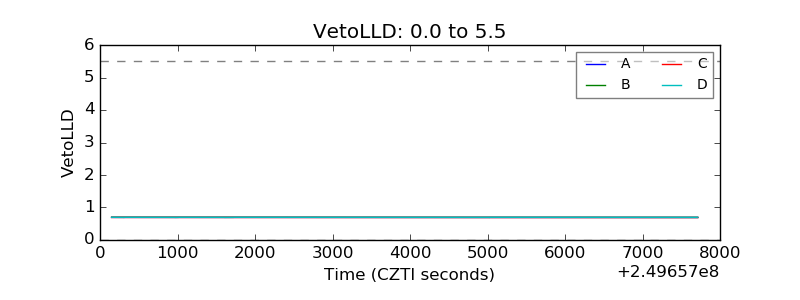 |
| Alpha Counter | 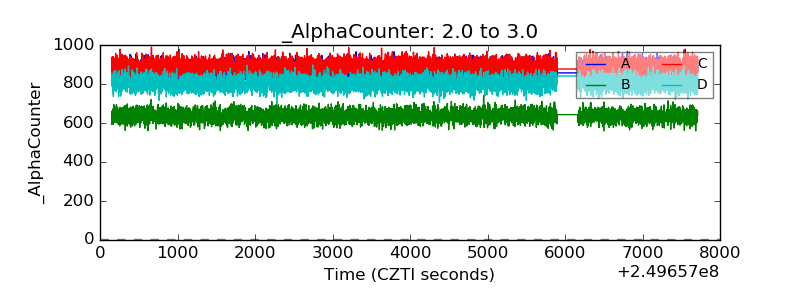 |
| _CPM_Rate | 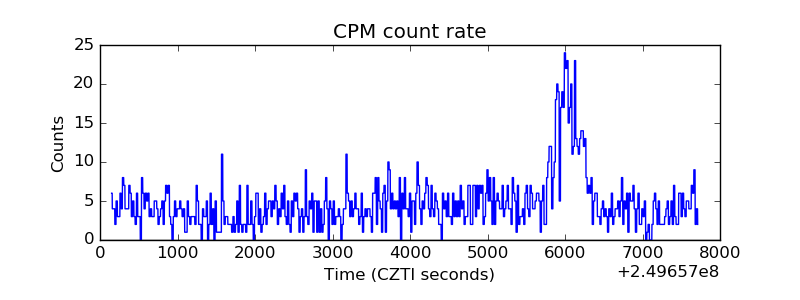 |
| CZT Counter | 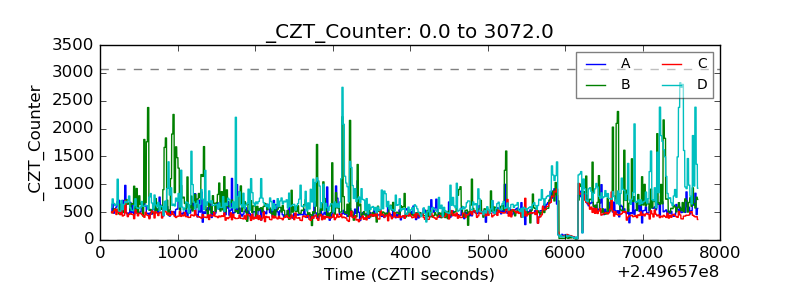 |
| +2.5 Volts monitor |  |
| +5 Volts monitor |  |
| _ROLL_ROT | 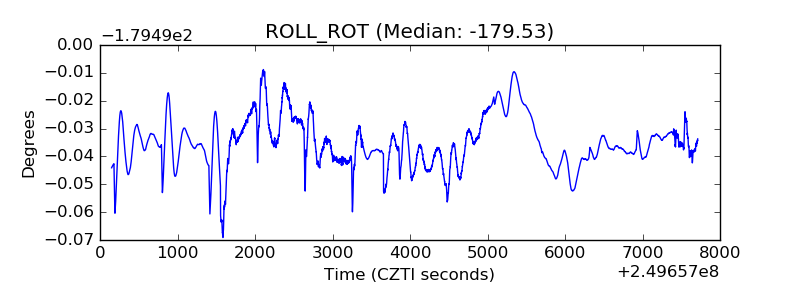 |
| _Roll_DEC | 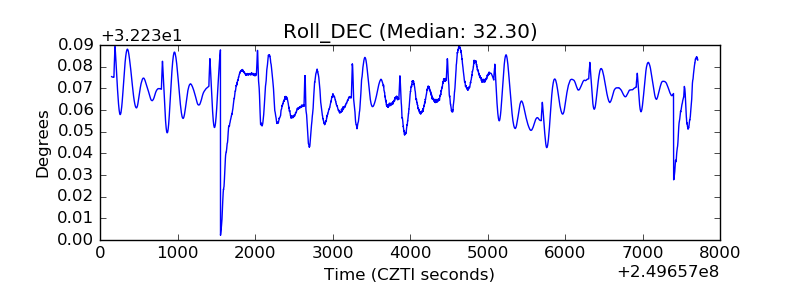 |
| _Roll_RA | 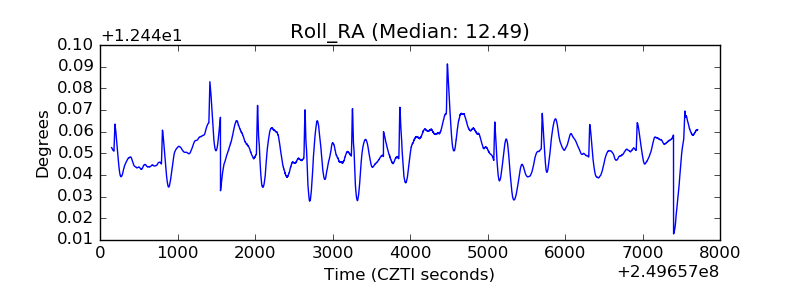 |
| Veto Counter | 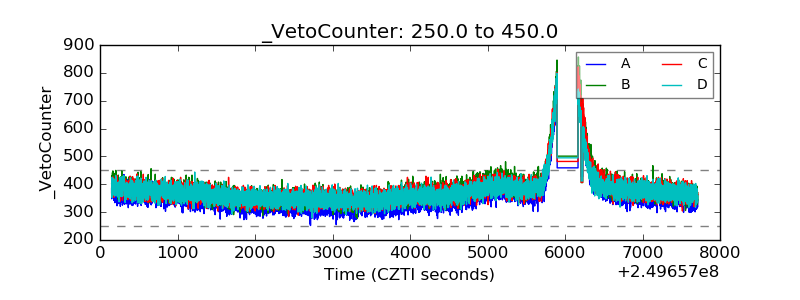 |