| Param | Original file | Final file |
|---|---|---|
| Filename | modeM0/AS1A04_167T04_9000001734_11746cztM0_level2.evt | modeM0/AS1A04_167T04_9000001734_11746cztM0_level2_quad_clean.evt |
| Size (bytes) | 265,864,320 | 49,933,440 |
| Size | 253.5 MB | 47.6 MB |
| Events in quadrant A | 1,624,933 | 333,182 |
| Events in quadrant B | 1,938,155 | 328,511 |
| Events in quadrant C | 1,218,617 | 342,088 |
| Events in quadrant D | 3,076,126 | 305,562 |
| Mode M0 | |||
|---|---|---|---|
| Quadrant | BADHDUFLAG | Total packets | Discarded packets |
| A | 0 | 6635 | 0 |
| B | 0 | 7634 | 0 |
| C | 0 | 5686 | 0 |
| D | 0 | 11194 | 0 |
| Mode SS | |||
|---|---|---|---|
| Quadrant | BADHDUFLAG | Total packets | Discarded packets |
| A | 0 | 56 | 0 |
| B | 0 | 56 | 0 |
| C | 0 | 56 | 0 |
| D | 0 | 56 | 0 |
| Quadrant | Total seconds | Saturated seconds | Saturation percentage |
|---|---|---|---|
| A | 2834 | 14 | 0.494001% |
| B | 2834 | 104 | 3.669725% |
| C | 2834 | 1 | 0.035286% |
| D | 2834 | 376 | 13.267466% |
Noise dominated data is calculated using 1-second bins in cleaned event files. If a bin has >2000 counts, and if more than 50% of those come from <1% of pixels, then it is considered to be noise-dominated and hence unusable.
| Quadrant | # 1 sec bins | Bins with >0 counts | Bins with >2000 counts | High rate bins dominated by noise | Noise dominated (total time) | Noise dominated (detector-on time) | Marked lightcurve |
|---|---|---|---|---|---|---|---|
| A | 2835 | 2835 | 2 | 2 | 0.07% | 0.07% | 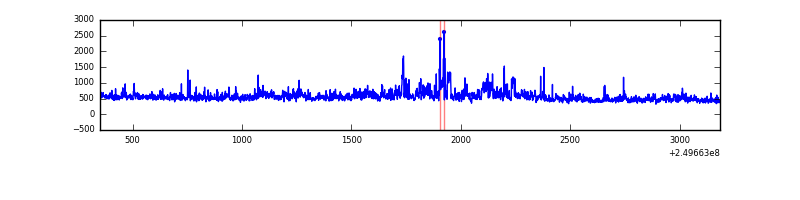 |
| B | 2835 | 2835 | 61 | 61 | 2.15% | 2.15% | 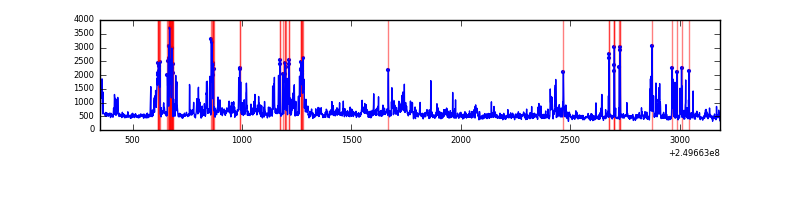 |
| C | 2835 | 2835 | 0 | 0 | 0.00% | 0.00% | 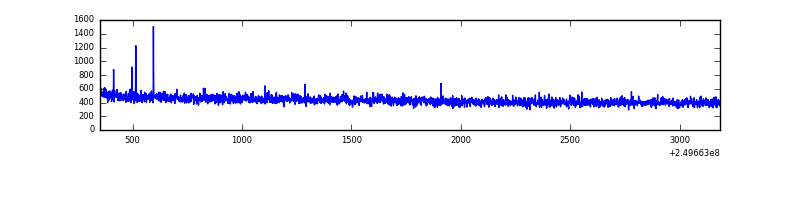 |
| D | 2835 | 2835 | 384 | 384 | 13.54% | 13.54% | 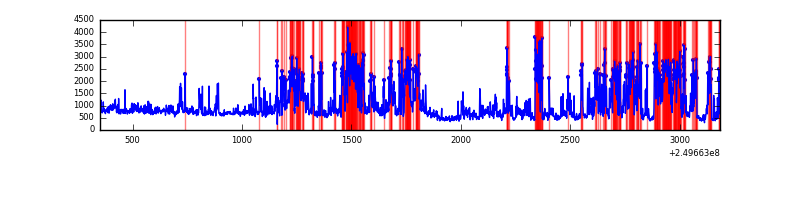 |
Top three noisy pixels from each quadrant. If the there are fewer than three noisy pixels in the level2.evt file, extra rows are filled as -1
| Pixel properties | Quadrant properties | ||||||
|---|---|---|---|---|---|---|---|
| Quadrant | DetID | PixID | Counts | Sigma | Mean | Median | Sigma |
| A | 8 | 15 | 212352 | 3157.79 | 318 | 310 | 67.1 |
| A | 1 | 162 | 65306 | 967.94 | 318 | 310 | 67.1 |
| A | 1 | 178 | 31545 | 465.16 | 318 | 310 | 67.1 |
| B | 4 | 239 | 387774 | 6388.84 | 310 | 303 | 60.6 |
| B | 15 | 204 | 185132 | 3047.56 | 310 | 303 | 60.6 |
| B | 0 | 219 | 33054 | 540.02 | 310 | 303 | 60.6 |
| C | 8 | 128 | 4798 | 61.83 | 309 | 311 | 72.6 |
| C | 14 | 234 | 3536 | 44.44 | 309 | 311 | 72.6 |
| C | 8 | 112 | 2760 | 33.75 | 309 | 311 | 72.6 |
| D | 1 | 52 | 1335281 | 18413.34 | 298 | 289 | 72.5 |
| D | 8 | 195 | 356819 | 4917.56 | 298 | 289 | 72.5 |
| D | 10 | 199 | 138335 | 1904.05 | 298 | 289 | 72.5 |
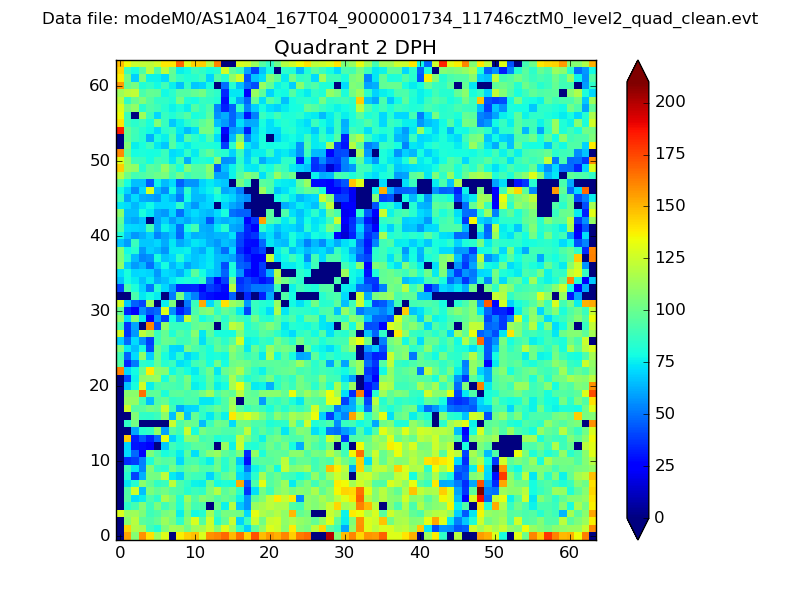
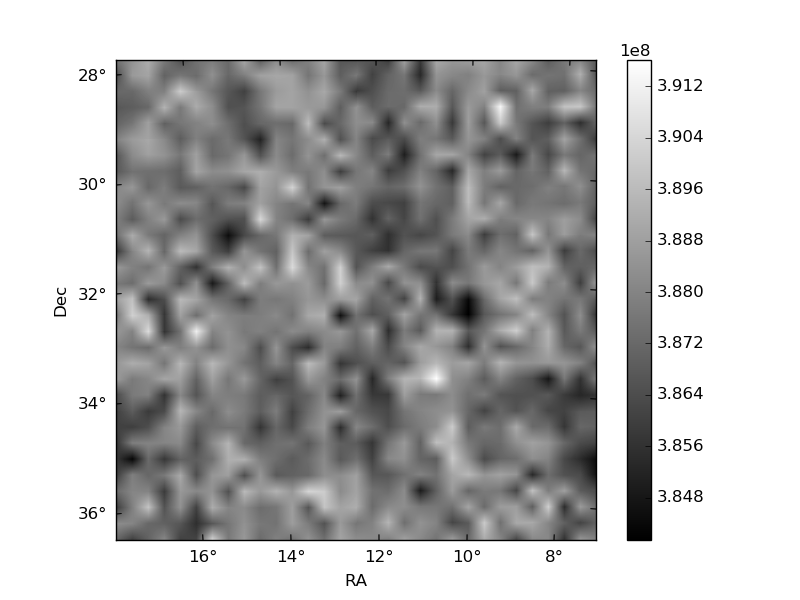
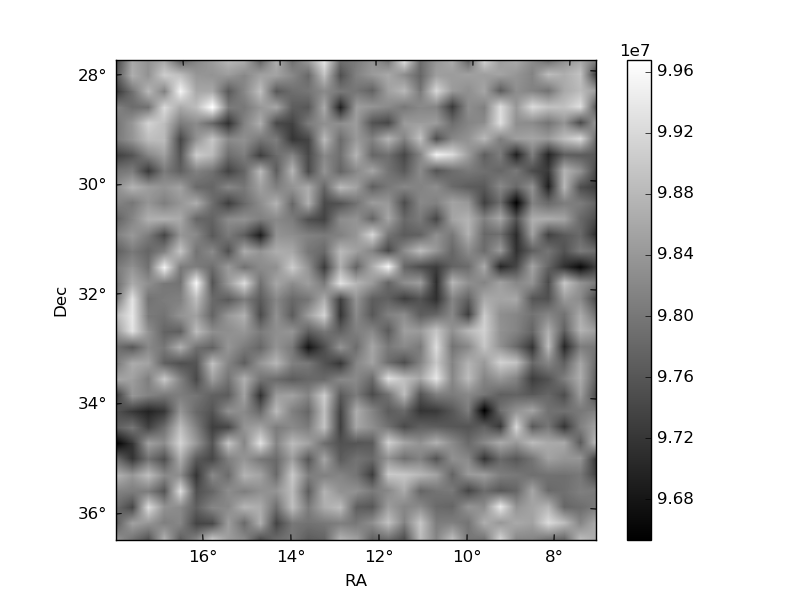
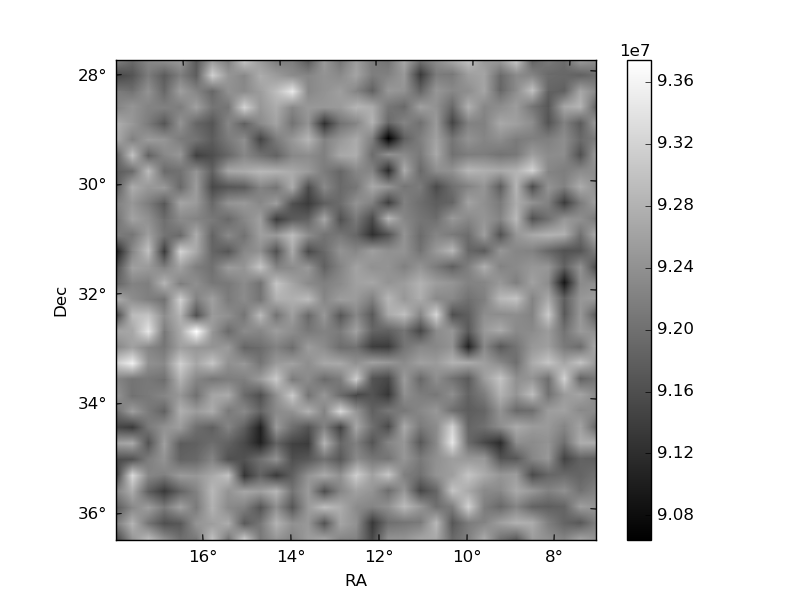
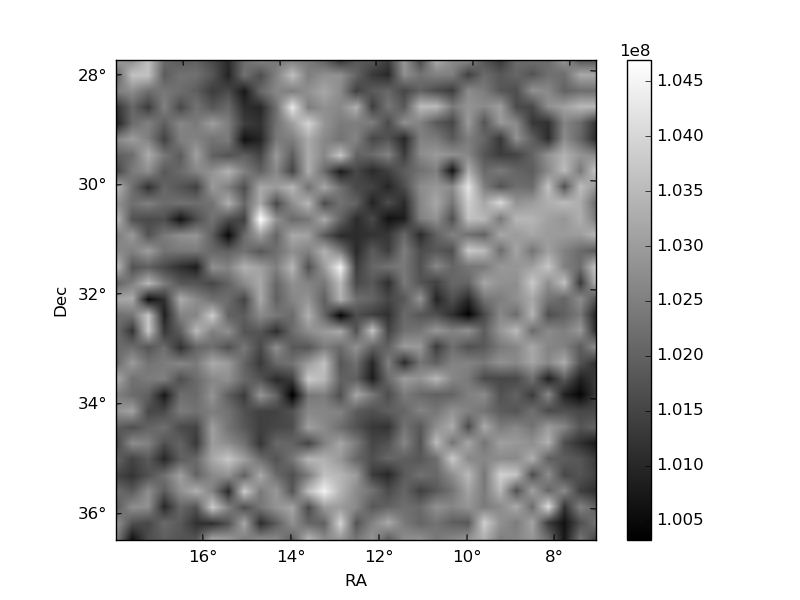
Histogram calculated using DETX and DETY for each event in the final _common_clean file
| Quadrant A | 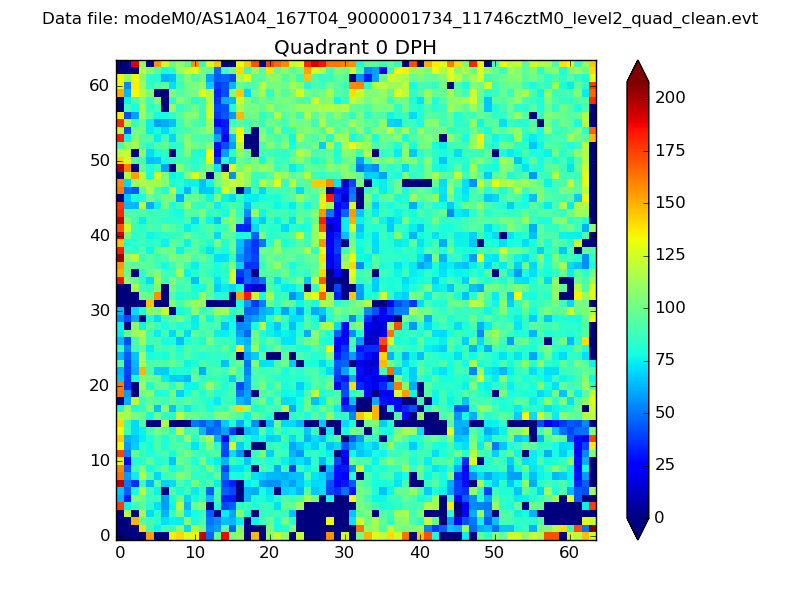 |
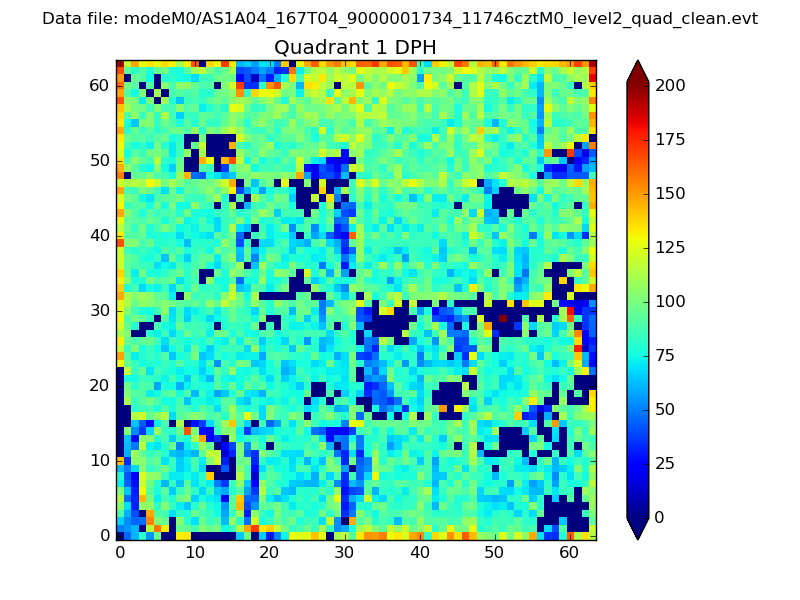 |
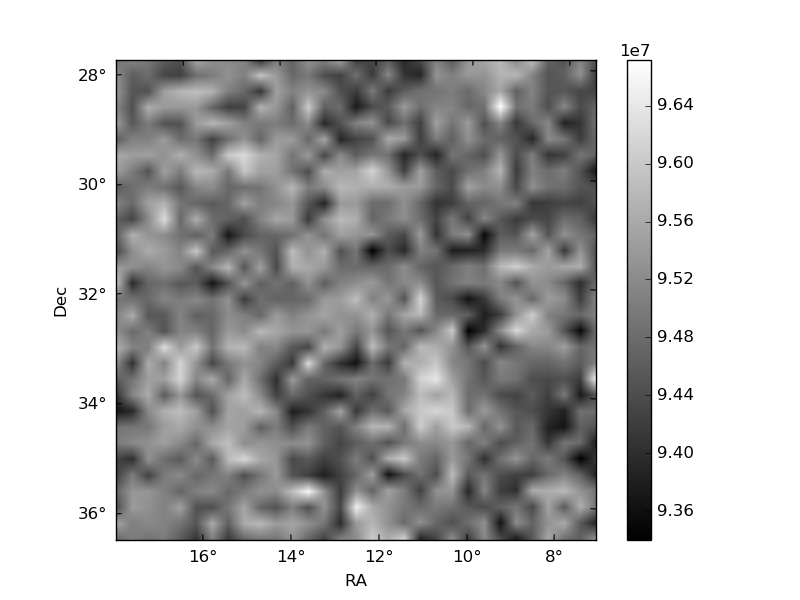
Quadrant B |
|---|---|---|---|
| Quadrant D | 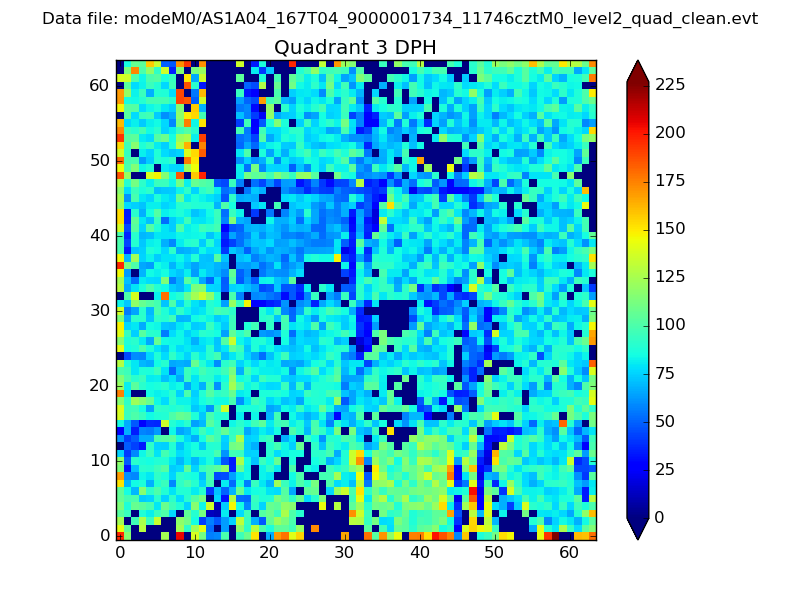 |
 |
Quadrant C |
| Plot type | Count rate plots | Images |
|---|---|---|
| Comparison with Poisson distribution Blue bars denote a histogram of data divided into 1 sec bins. Red curve is a Poisson curve with rate = median count rate of data. |
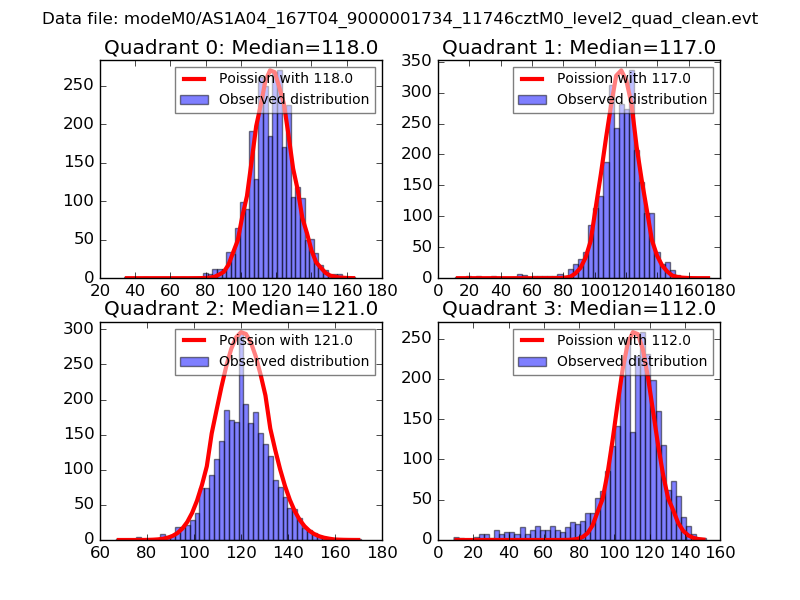 |
 |
| Quadrant-wise count rates Data is divided into 100 sec bins |
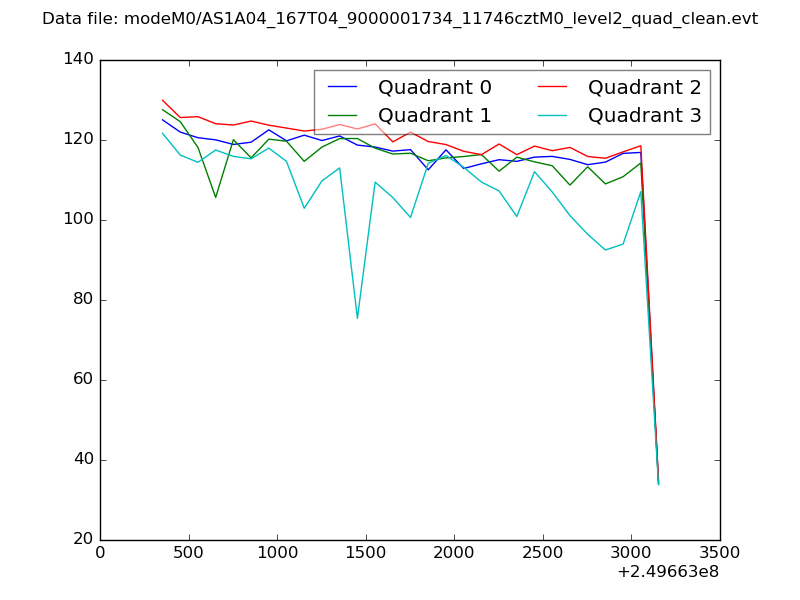 |
|
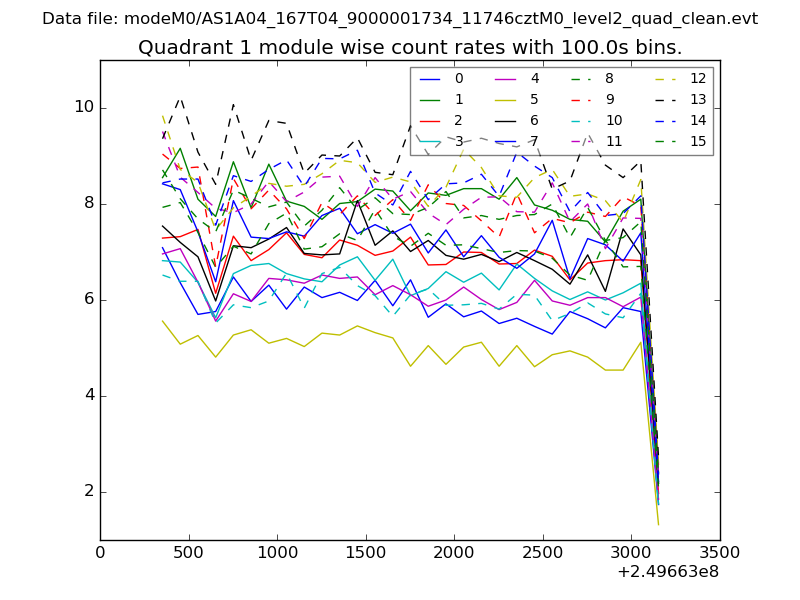
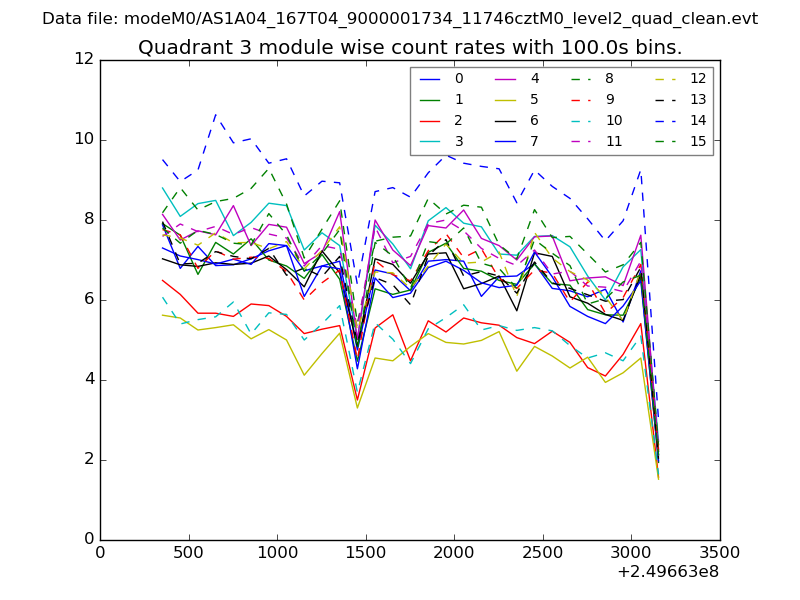
| Module-wise count rates for Quadrant A Data is divided into 100 sec bins |
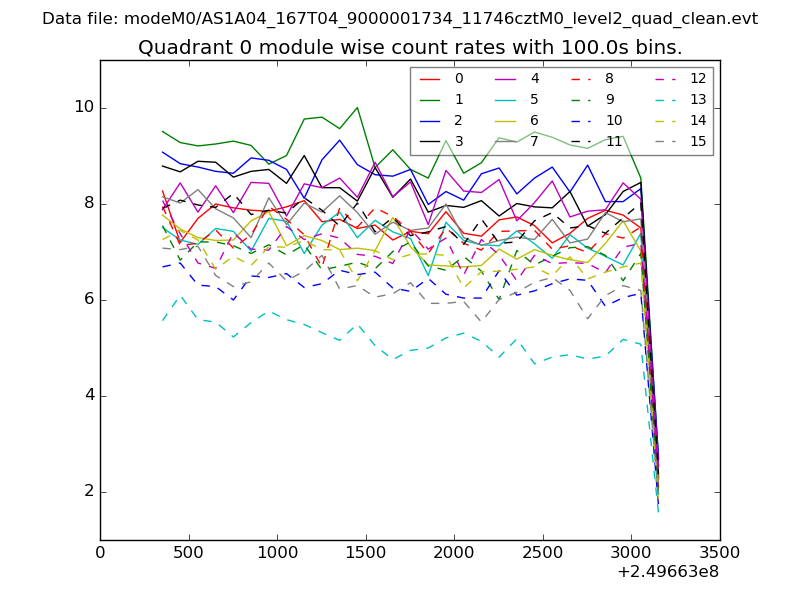 |
 |
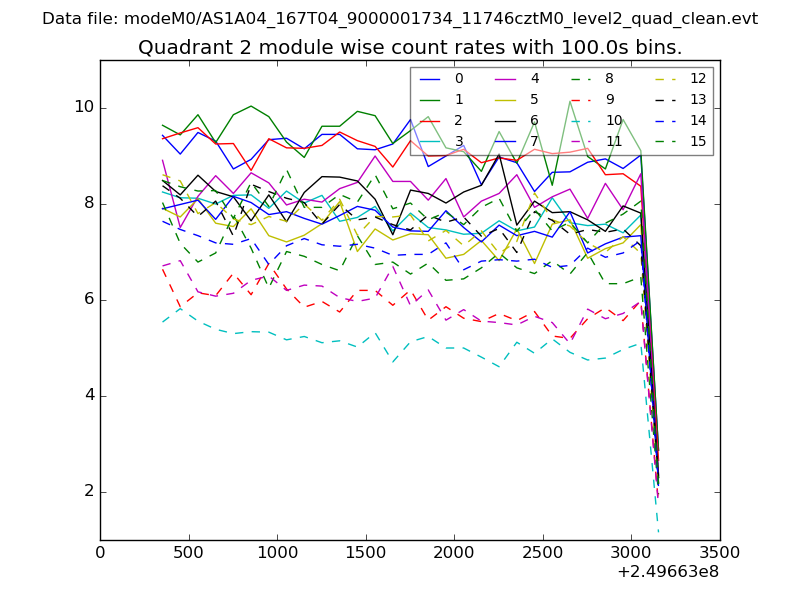
| Module-wise count rates for Quadrant B Data is divided into 100 sec bins |
 |
 |
| Module-wise count rates for Quadrant C Data is divided into 100 sec bins |
 |
 |
| Module-wise count rates for Quadrant D Data is divided into 100 sec bins |
 |
 |
| Parameter | Plot |
|---|---|
| CZT HV Monitor | 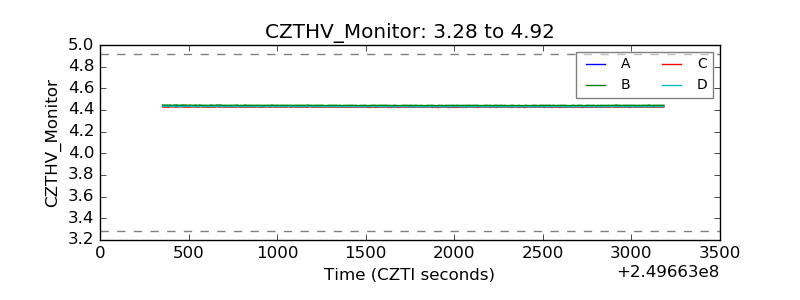 |
| D_VDD | 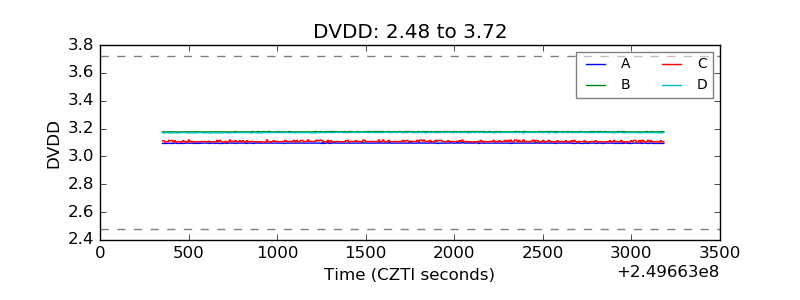 |
| Temperature 1 | 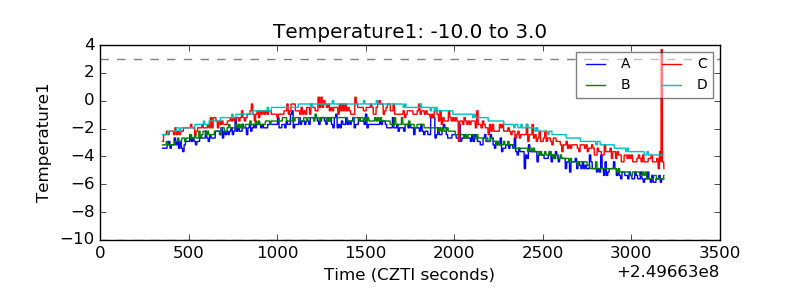 |
| Veto HV Monitor | 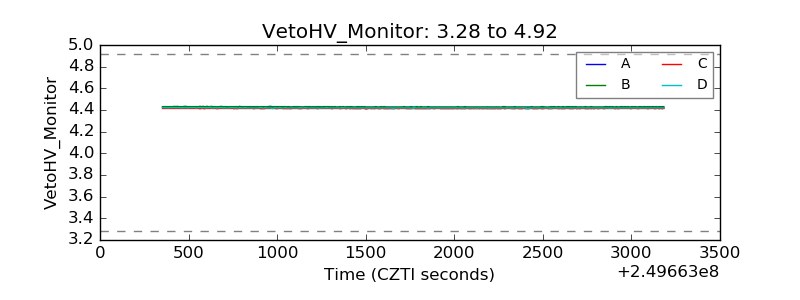 |
| Veto LLD | 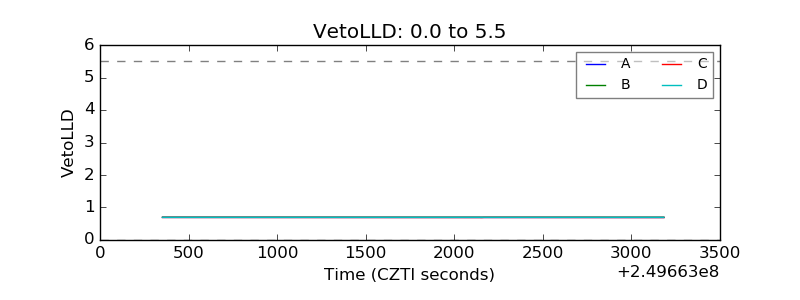 |
| Alpha Counter | 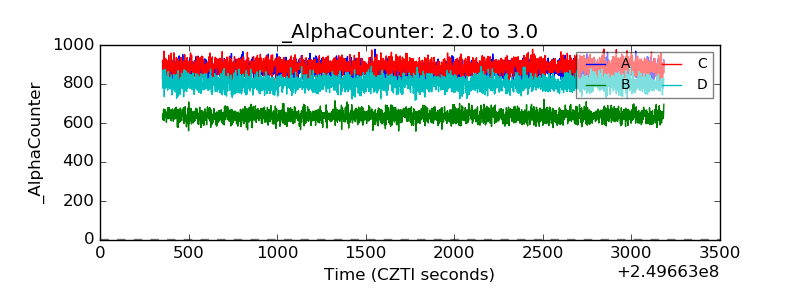 |
| _CPM_Rate | 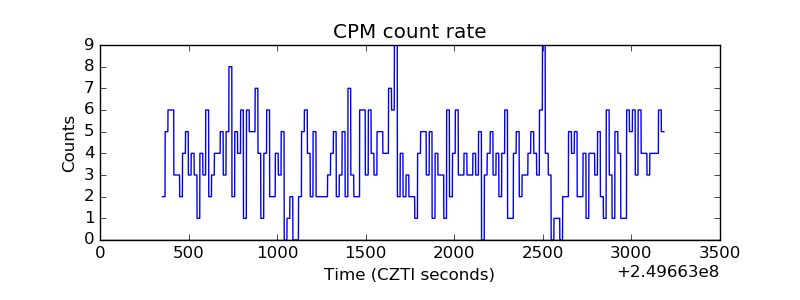 |
| CZT Counter | 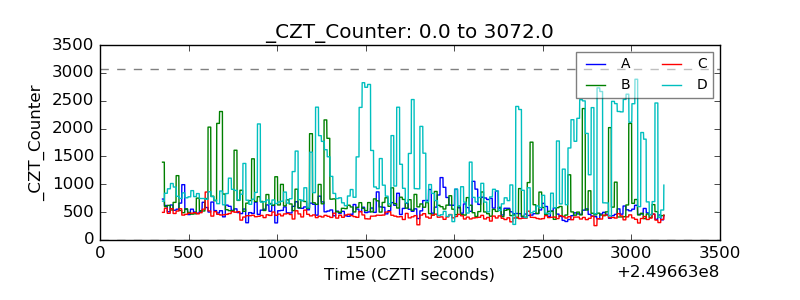 |
| +2.5 Volts monitor | 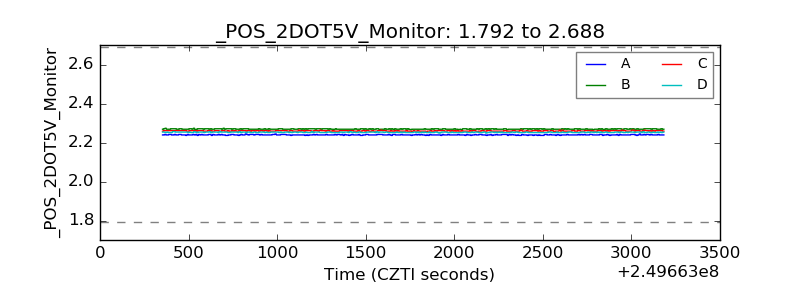 |
| +5 Volts monitor | 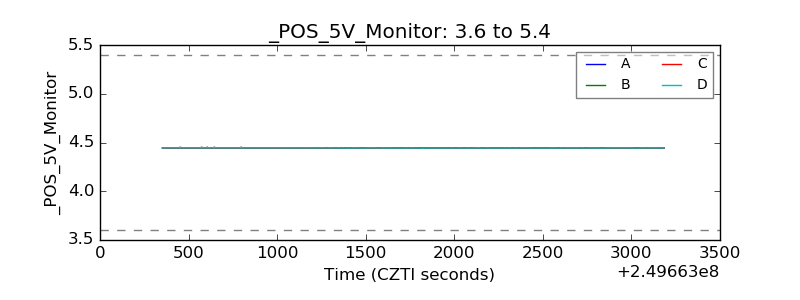 |
| _ROLL_ROT | 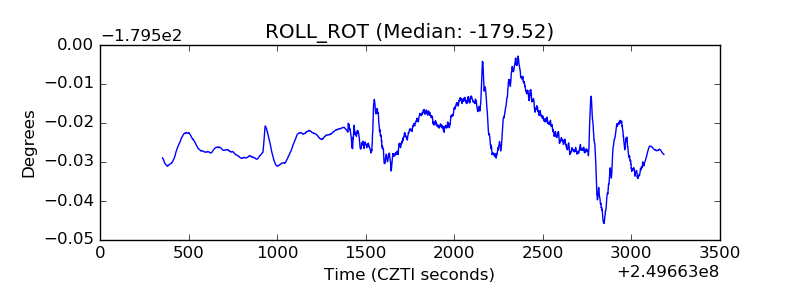 |
| _Roll_DEC | 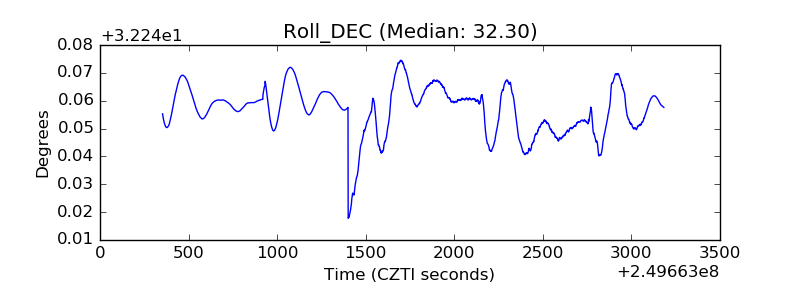 |
| _Roll_RA | 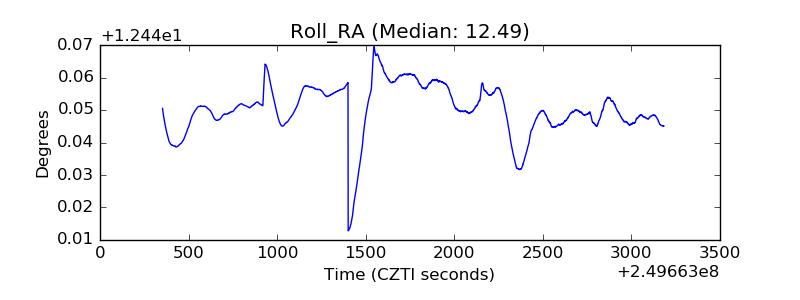 |
| Veto Counter | 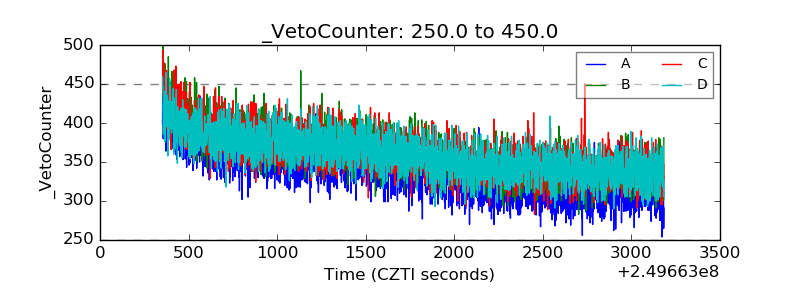 |