| Param | Original file | Final file |
|---|---|---|
| Filename | modeM0/AS1G08_060T01_9000001736cztM0_level2.fits | modeM0/AS1G08_060T01_9000001736cztM0_level2_quad_clean.evt |
| Size (bytes) | 173,266,560 | 216,103,680 |
| Size | 165.2 MB | 206.1 MB |
| Events in quadrant A | 1,036,100 | 1,383,049 |
| Events in quadrant B | 985,098 | 1,352,836 |
| Events in quadrant C | 1,034,604 | 1,302,896 |
| Events in quadrant D | 860,080 | 1,175,090 |
| Mode M9 | |||
|---|---|---|---|
| Quadrant | BADHDUFLAG | Total packets | Discarded packets |
| A | 0 | 31 | 0 |
| B | 0 | 31 | 0 |
| C | 0 | 31 | 0 |
| D | 0 | 31 | 0 |
| Mode SS | |||
|---|---|---|---|
| Quadrant | BADHDUFLAG | Total packets | Discarded packets |
| A | 0 | 396 | 0 |
| B | 0 | 396 | 0 |
| C | 0 | 396 | 0 |
| D | 0 | 396 | 0 |
| Mode M0 | |||
|---|---|---|---|
| Quadrant | BADHDUFLAG | Total packets | Discarded packets |
| A | 0 | 45955 | 0 |
| B | 0 | 49343 | 0 |
| C | 0 | 39144 | 0 |
| D | 0 | 55824 | 0 |
| Quadrant | Total seconds | Saturated seconds | Saturation percentage |
|---|---|---|---|
| A | 19311 | 253 | 1.310134% |
| B | 19311 | 972 | 5.033401% |
| C | 19311 | 63 | 0.326239% |
| D | 19311 | 1315 | 6.809590% |
Noise dominated data is calculated using 1-second bins in cleaned event files. If a bin has >2000 counts, and if more than 50% of those come from <1% of pixels, then it is considered to be noise-dominated and hence unusable.
| Quadrant | # 1 sec bins | Bins with >0 counts | Bins with >2000 counts | High rate bins dominated by noise | Noise dominated (total time) | Noise dominated (detector-on time) | Marked lightcurve |
|---|---|---|---|---|---|---|---|
| A | 22496 | 19311 | 0 | 0 | 0.00% | 0.00% |  |
| B | 22496 | 19301 | 0 | 0 | 0.00% | 0.00% |  |
| C | 22496 | 19311 | 0 | 0 | 0.00% | 0.00% |  |
| D | 22496 | 19304 | 0 | 0 | 0.00% | 0.00% |  |
Top three noisy pixels from each quadrant. If the there are fewer than three noisy pixels in the level2.evt file, extra rows are filled as -1
| Pixel properties | Quadrant properties | ||||||
|---|---|---|---|---|---|---|---|
| Quadrant | DetID | PixID | Counts | Sigma | Mean | Median | Sigma |
| A | 0 | 29 | 1087 | 11.89 | 270 | 254 | 70.1 |
| A | 14 | 188 | 1020 | 10.93 | 270 | 254 | 70.1 |
| A | 7 | 110 | 945 | 9.86 | 270 | 254 | 70.1 |
| B | 2 | 9 | 874 | 11.77 | 260 | 248 | 53.2 |
| B | 14 | 254 | 683 | 8.18 | 260 | 248 | 53.2 |
| B | 2 | 8 | 664 | 7.82 | 260 | 248 | 53.2 |
| C | 12 | 241 | 767 | 7.07 | 273 | 253 | 72.7 |
| C | 3 | 126 | 696 | 6.09 | 273 | 253 | 72.7 |
| C | 4 | 254 | 689 | 6.0 | 273 | 253 | 72.7 |
| D | 3 | 14 | 663 | 6.5 | 245 | 223 | 67.7 |
| D | 6 | 231 | 638 | 6.13 | 245 | 223 | 67.7 |
| D | 3 | 31 | 633 | 6.05 | 245 | 223 | 67.7 |
Histogram calculated using DETX and DETY for each event in the final _common_clean file
| Quadrant A | 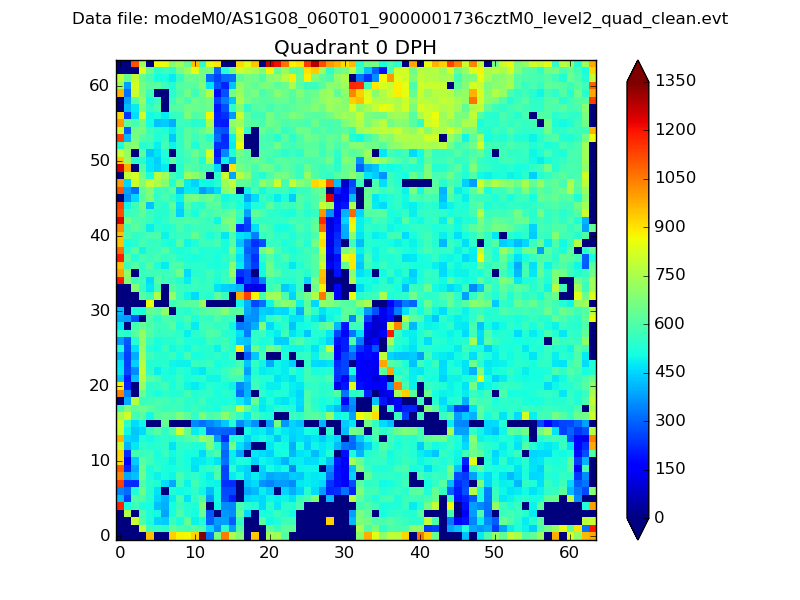 |
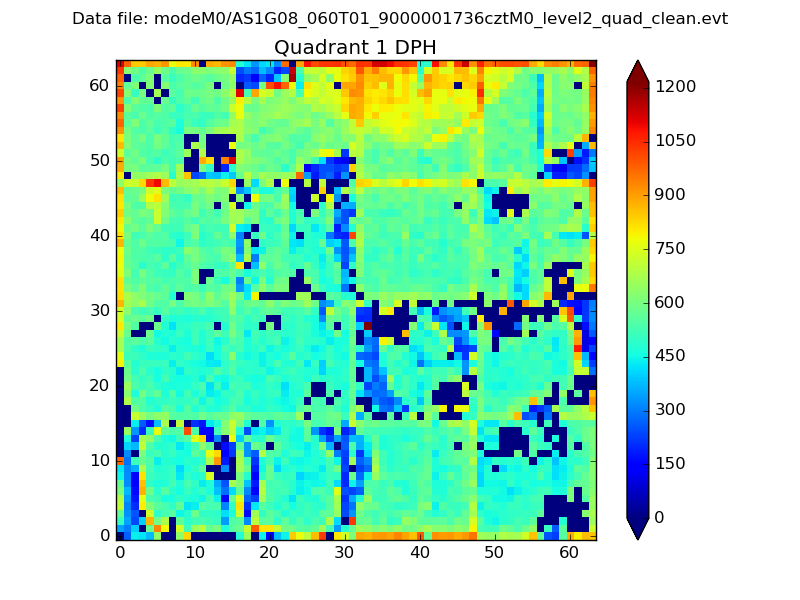 |
Quadrant B |
|---|---|---|---|
| Quadrant D |  |
 |
Quadrant C |
| Plot type | Count rate plots | Images |
|---|---|---|
| Comparison with Poisson distribution Blue bars denote a histogram of data divided into 1 sec bins. Red curve is a Poisson curve with rate = median count rate of data. |
 |
 |
| Quadrant-wise count rates Data is divided into 100 sec bins |
 |
|
| Module-wise count rates for Quadrant A Data is divided into 100 sec bins |
 |
 |
| Module-wise count rates for Quadrant B Data is divided into 100 sec bins |
 |
 |
| Module-wise count rates for Quadrant C Data is divided into 100 sec bins |
 |
 |
| Module-wise count rates for Quadrant D Data is divided into 100 sec bins |
 |
 |
| Parameter | Plot |
|---|---|
| CZT HV Monitor |  |
| D_VDD | 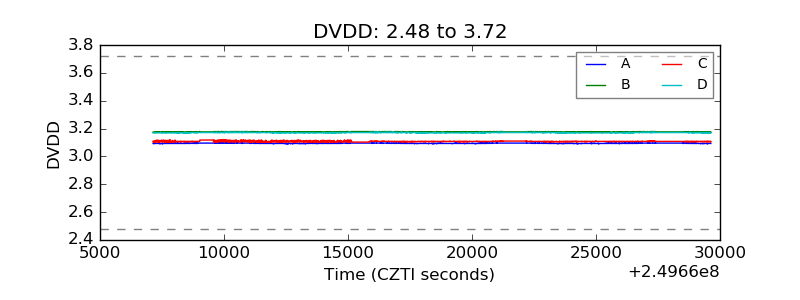 |
| Temperature 1 | 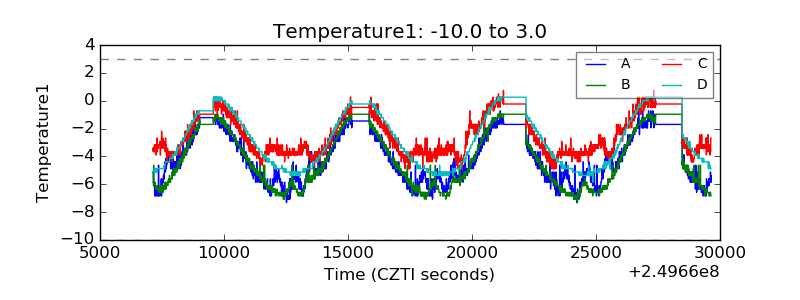 |
| Veto HV Monitor |  |
| Veto LLD |  |
| Alpha Counter |  |
| _CPM_Rate |  |
| CZT Counter |  |
| +2.5 Volts monitor |  |
| +5 Volts monitor |  |
| _ROLL_ROT |  |
| _Roll_DEC |  |
| _Roll_RA |  |
| Veto Counter |  |