| Param | Original file | Final file |
|---|---|---|
| Filename | modeM0/AS1G08_060T01_9000001736_11746cztM0_level2.evt | modeM0/AS1G08_060T01_9000001736_11746cztM0_level2_quad_clean.evt |
| Size (bytes) | 25,853,760 | 5,356,800 |
| Size | 24.7 MB | 5.1 MB |
| Events in quadrant A | 129,350 | 34,846 |
| Events in quadrant B | 125,582 | 34,699 |
| Events in quadrant C | 115,651 | 34,023 |
| Events in quadrant D | 389,024 | 29,533 |
| Mode SS | |||
|---|---|---|---|
| Quadrant | BADHDUFLAG | Total packets | Discarded packets |
| A | 0 | 6 | 0 |
| B | 0 | 6 | 0 |
| C | 0 | 6 | 0 |
| D | 0 | 6 | 0 |
| Mode M0 | |||
|---|---|---|---|
| Quadrant | BADHDUFLAG | Total packets | Discarded packets |
| A | 0 | 589 | 1 |
| B | 0 | 579 | 0 |
| C | 0 | 578 | 0 |
| D | 0 | 1359 | 0 |
| Quadrant | Total seconds | Saturated seconds | Saturation percentage |
|---|---|---|---|
| A | 289 | 1 | 0.346021% |
| B | 289 | 0 | 0.000000% |
| C | 289 | 0 | 0.000000% |
| D | 289 | 72 | 24.913495% |
Noise dominated data is calculated using 1-second bins in cleaned event files. If a bin has >2000 counts, and if more than 50% of those come from <1% of pixels, then it is considered to be noise-dominated and hence unusable.
| Quadrant | # 1 sec bins | Bins with >0 counts | Bins with >2000 counts | High rate bins dominated by noise | Noise dominated (total time) | Noise dominated (detector-on time) | Marked lightcurve |
|---|---|---|---|---|---|---|---|
| A | 290 | 290 | 0 | 0 | 0.00% | 0.00% | 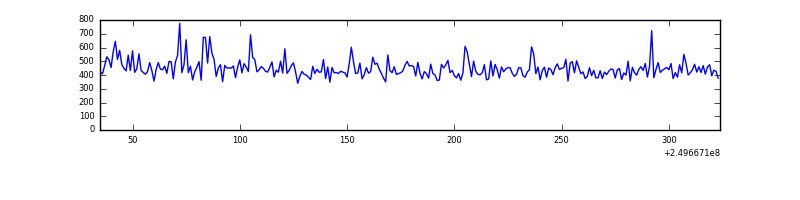 |
| B | 290 | 290 | 0 | 0 | 0.00% | 0.00% | 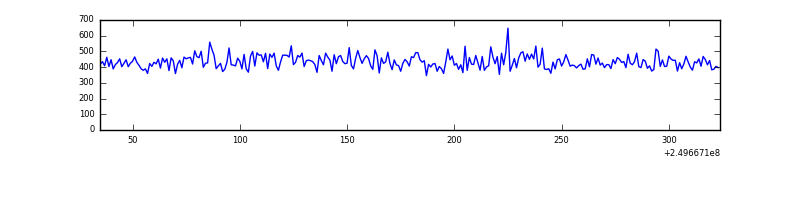 |
| C | 290 | 290 | 0 | 0 | 0.00% | 0.00% | 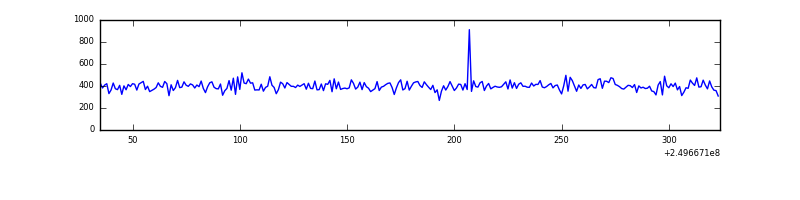 |
| D | 290 | 290 | 86 | 86 | 29.66% | 29.66% | 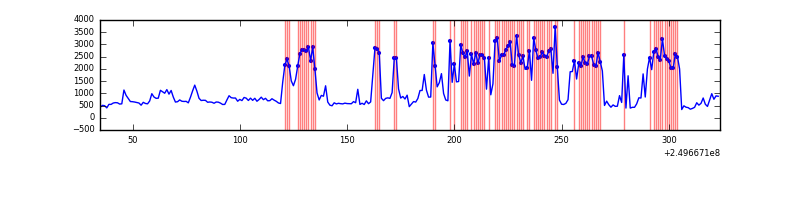 |
Top three noisy pixels from each quadrant. If the there are fewer than three noisy pixels in the level2.evt file, extra rows are filled as -1
| Pixel properties | Quadrant properties | ||||||
|---|---|---|---|---|---|---|---|
| Quadrant | DetID | PixID | Counts | Sigma | Mean | Median | Sigma |
| A | 1 | 162 | 2718 | 321.75 | 30 | 30 | 8.4 |
| A | 8 | 15 | 2471 | 292.19 | 30 | 30 | 8.4 |
| A | 1 | 178 | 1339 | 156.69 | 30 | 30 | 8.4 |
| B | 15 | 204 | 1738 | 209.17 | 31 | 30 | 8.2 |
| B | 0 | 187 | 1429 | 171.33 | 31 | 30 | 8.2 |
| B | 12 | 111 | 683 | 79.97 | 31 | 30 | 8.2 |
| C | 8 | 128 | 403 | 42.99 | 29 | 29 | 8.7 |
| C | 8 | 112 | 293 | 30.35 | 29 | 29 | 8.7 |
| C | 13 | 61 | 228 | 22.88 | 29 | 29 | 8.7 |
| D | 1 | 52 | 243299 | 30240.33 | 26 | 25 | 8.0 |
| D | 8 | 195 | 34124 | 4238.7 | 26 | 25 | 8.0 |
| D | 7 | 80 | 7968 | 987.36 | 26 | 25 | 8.0 |
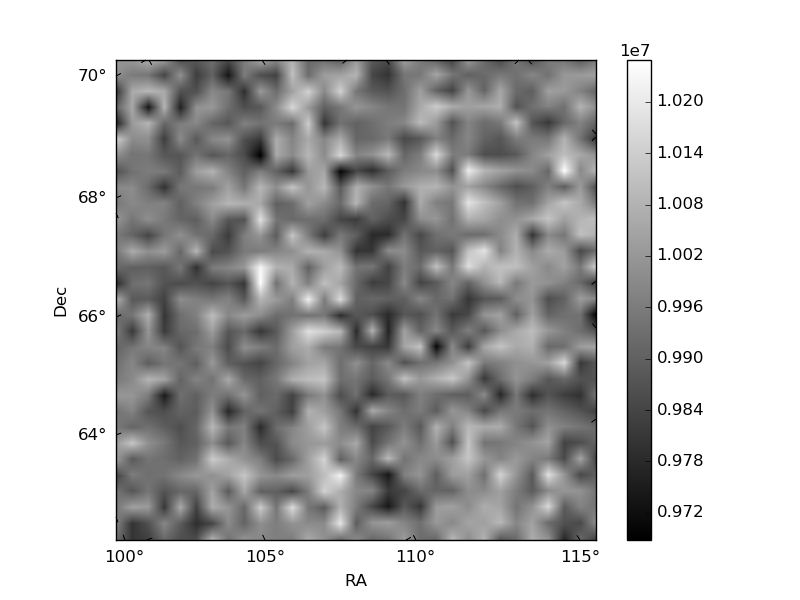
Histogram calculated using DETX and DETY for each event in the final _common_clean file
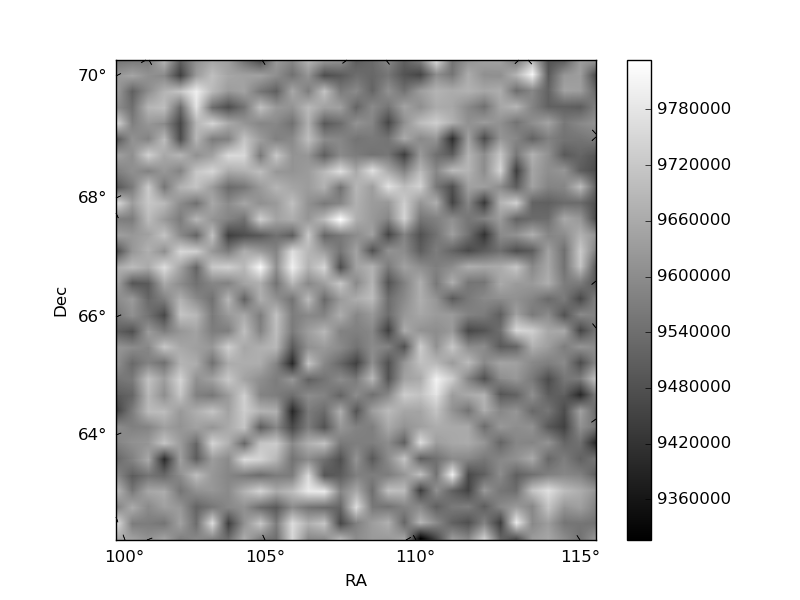
| Quadrant A | 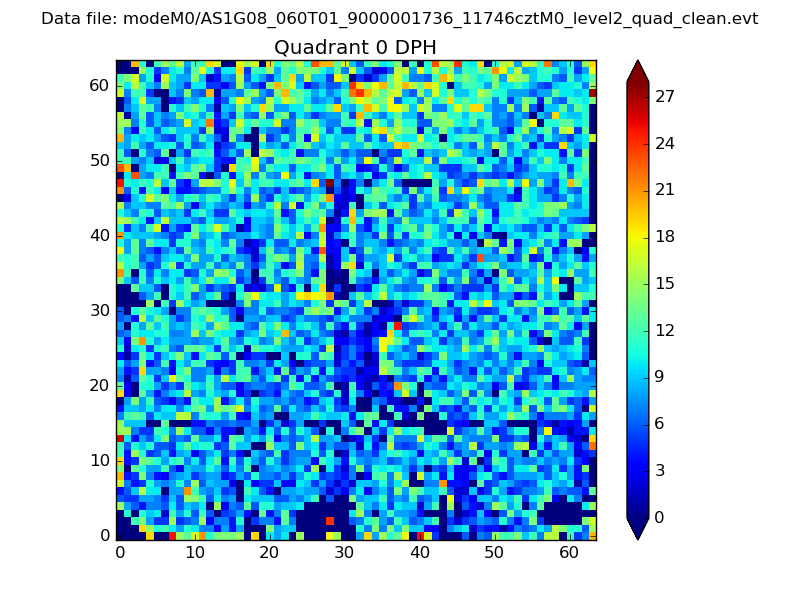 |
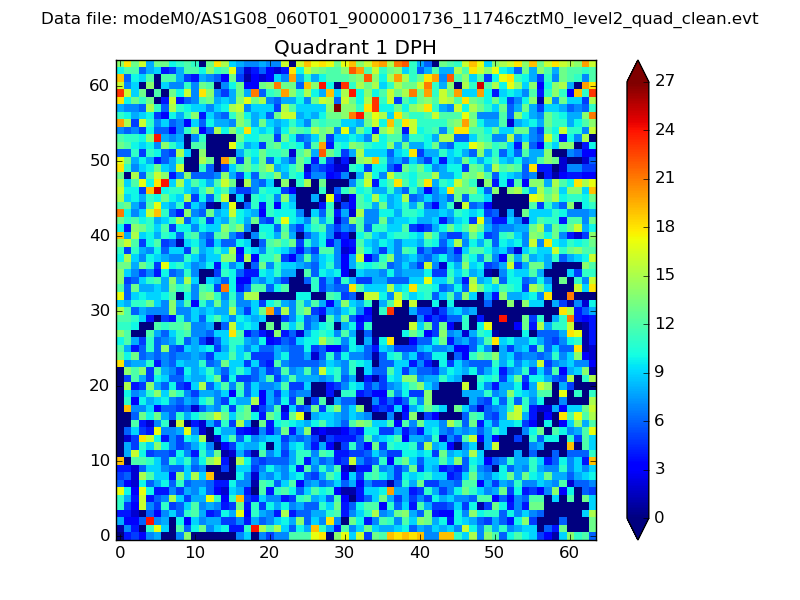 |
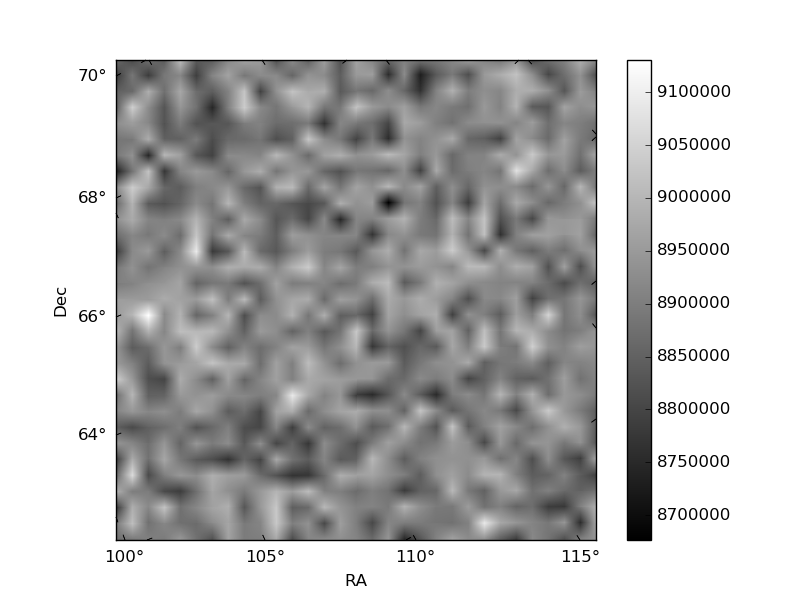
Quadrant B |
|---|---|---|---|
| Quadrant D | 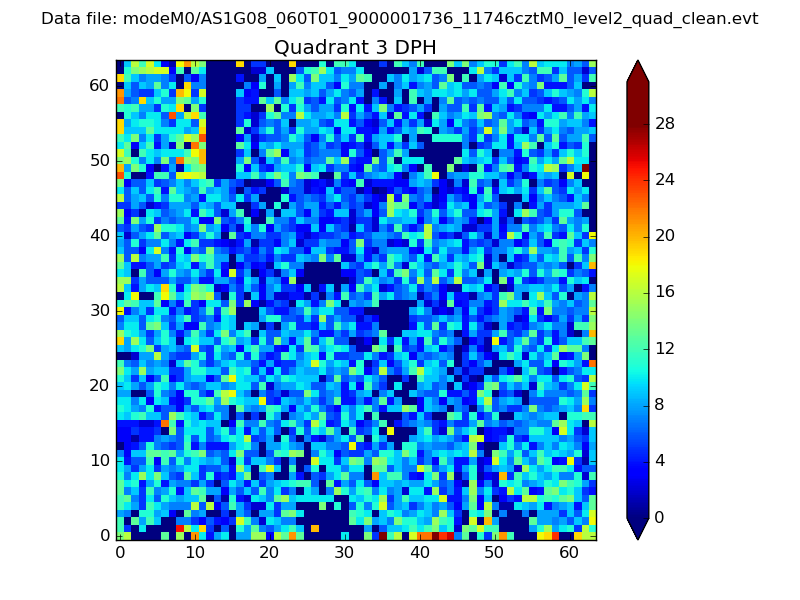 |
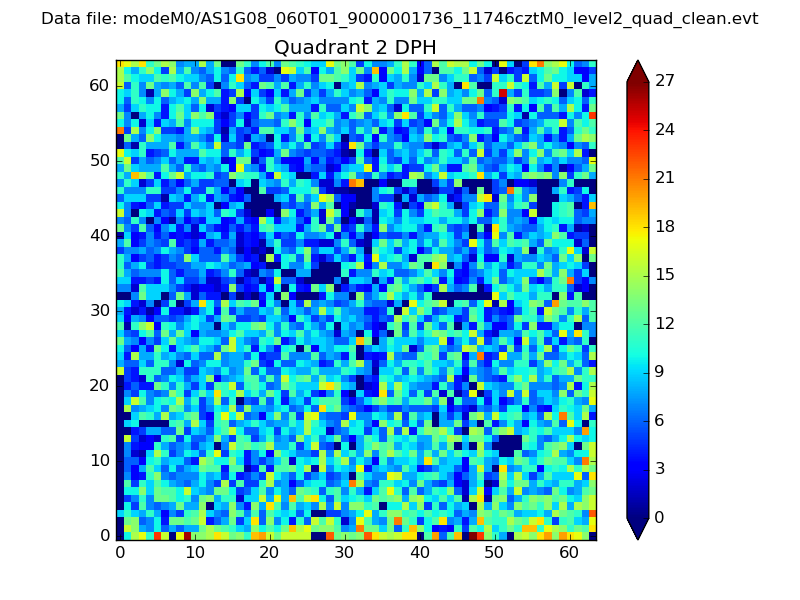 |
Quadrant C |
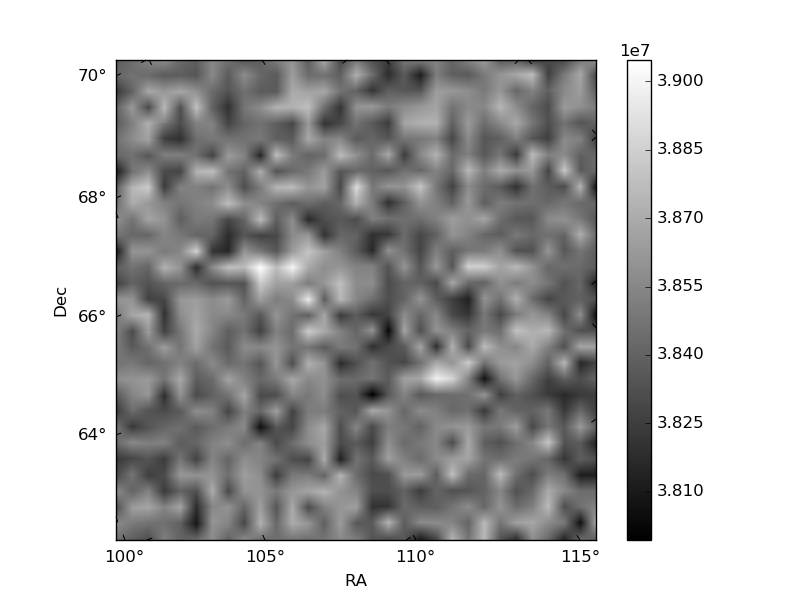
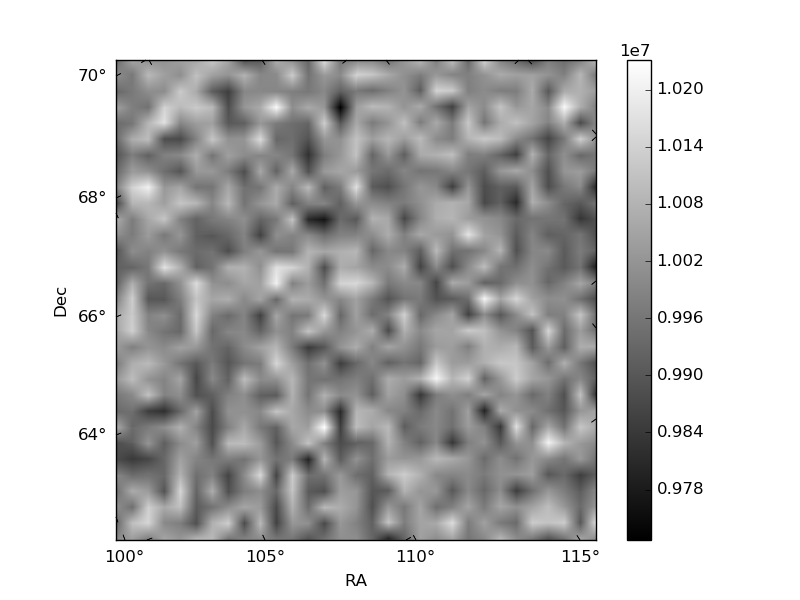
| Plot type | Count rate plots | Images |
|---|---|---|
| Comparison with Poisson distribution Blue bars denote a histogram of data divided into 1 sec bins. Red curve is a Poisson curve with rate = median count rate of data. |
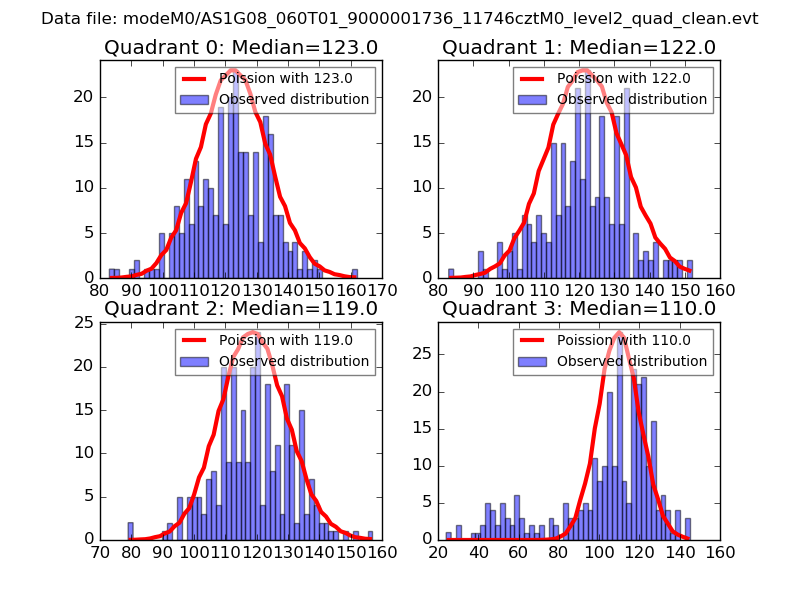 |
 |
| Quadrant-wise count rates Data is divided into 100 sec bins |
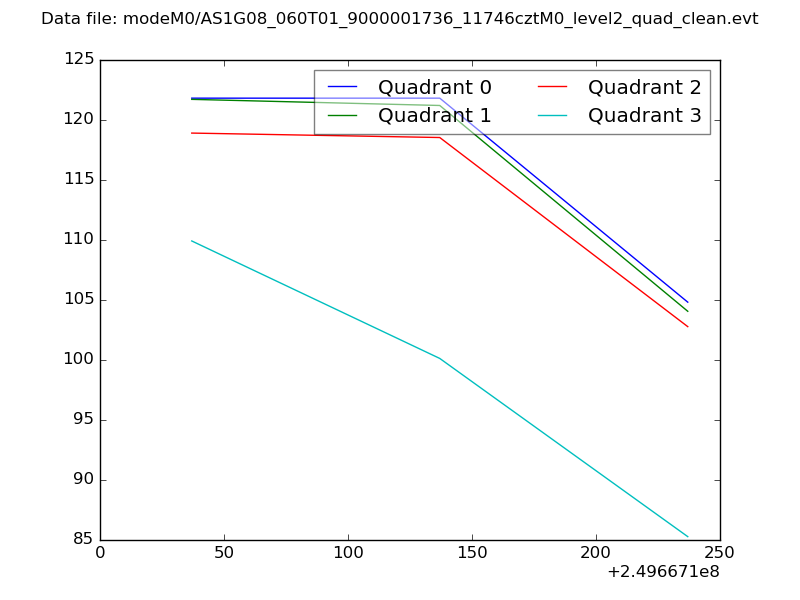 |
|
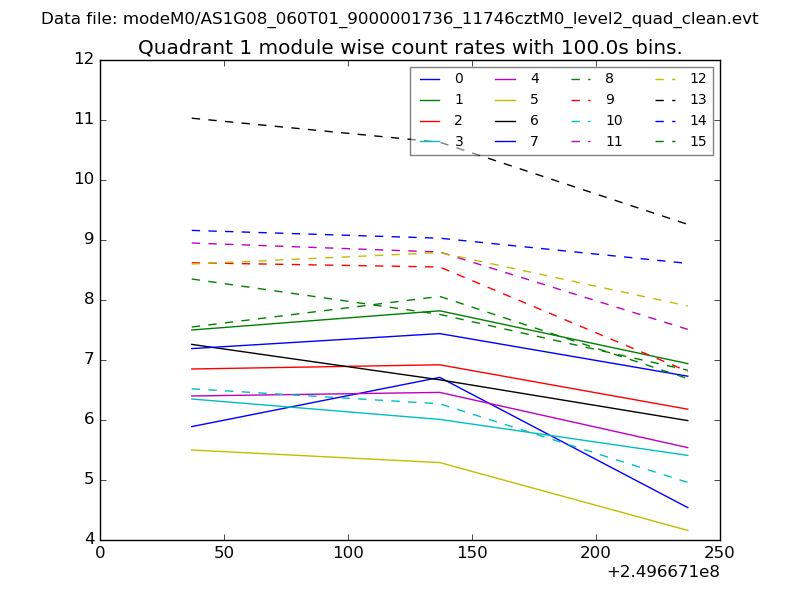
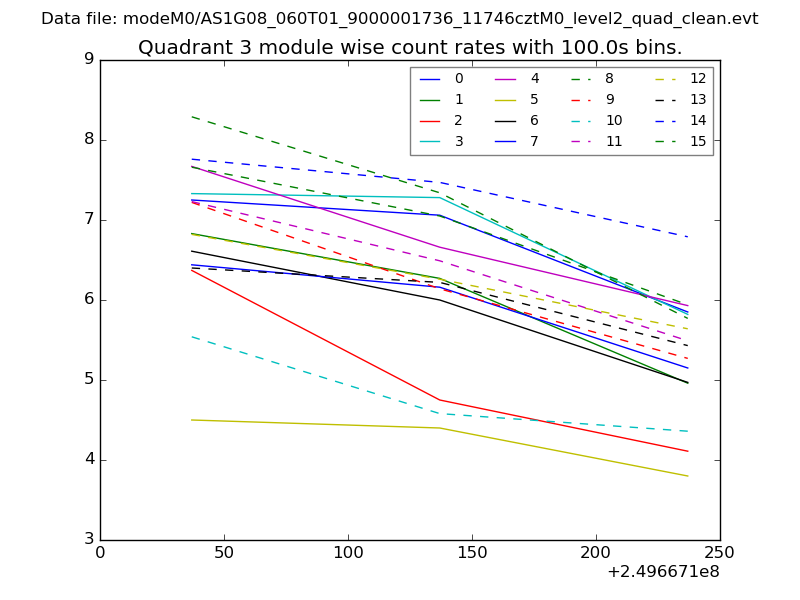
| Module-wise count rates for Quadrant A Data is divided into 100 sec bins |
 |
 |
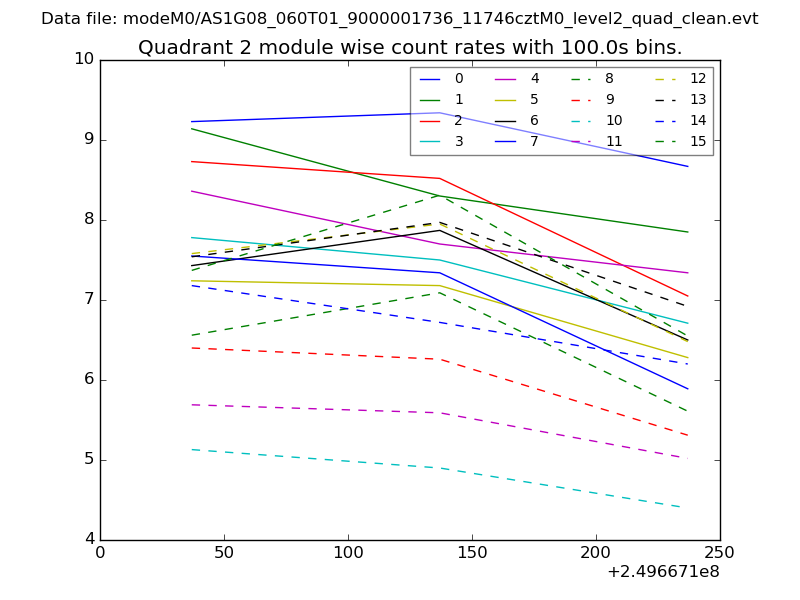
| Module-wise count rates for Quadrant B Data is divided into 100 sec bins |
 |
 |
| Module-wise count rates for Quadrant C Data is divided into 100 sec bins |
 |
 |
| Module-wise count rates for Quadrant D Data is divided into 100 sec bins |
 |
 |
| Parameter | Plot |
|---|---|
| CZT HV Monitor | 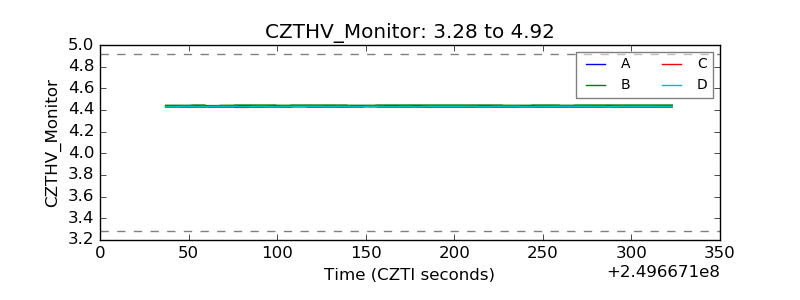 |
| D_VDD | 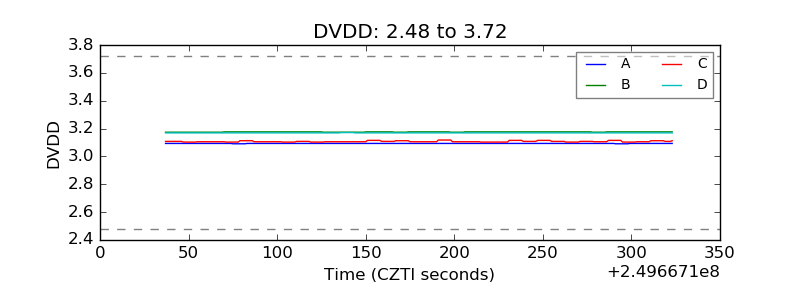 |
| Temperature 1 | 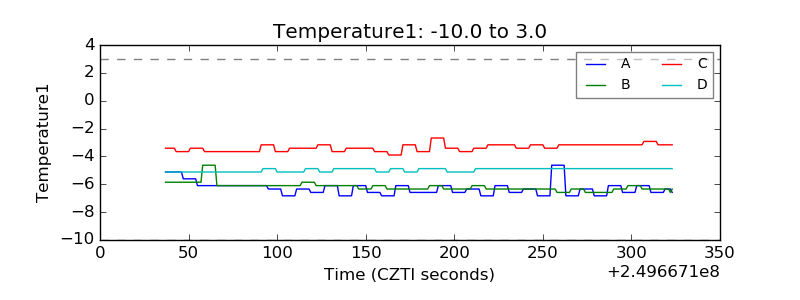 |
| Veto HV Monitor | 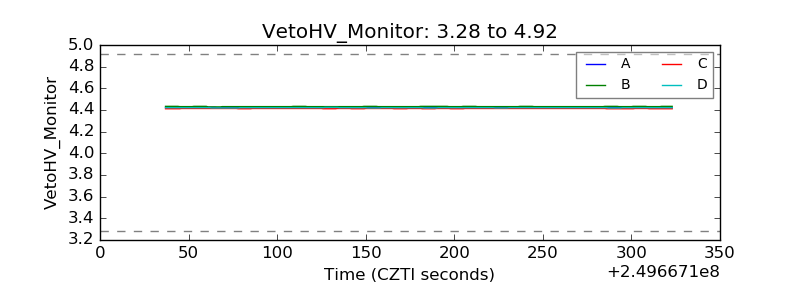 |
| Veto LLD |  |
| Alpha Counter | 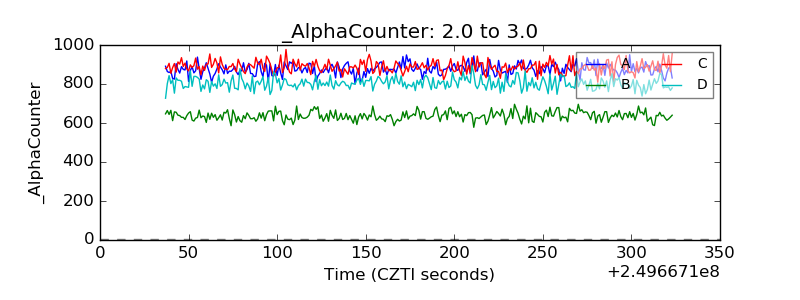 |
| _CPM_Rate | 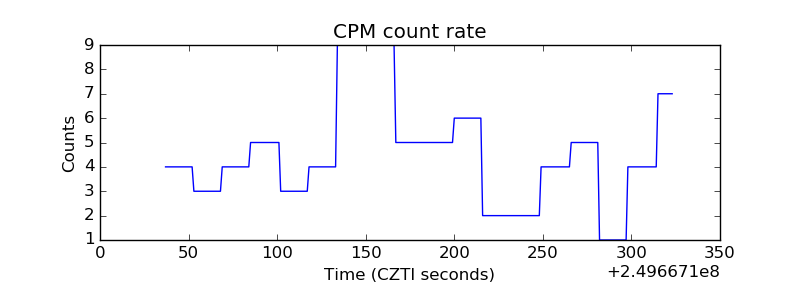 |
| CZT Counter | 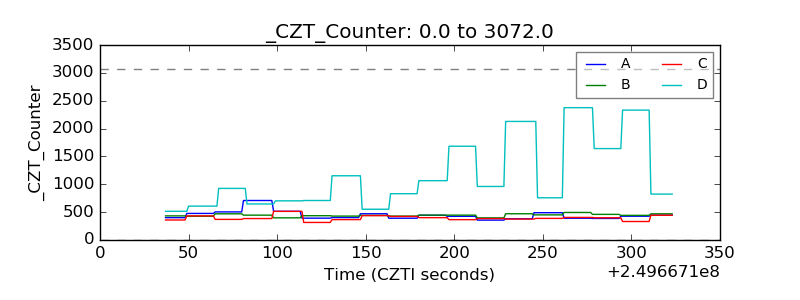 |
| +2.5 Volts monitor |  |
| +5 Volts monitor |  |
| _ROLL_ROT | 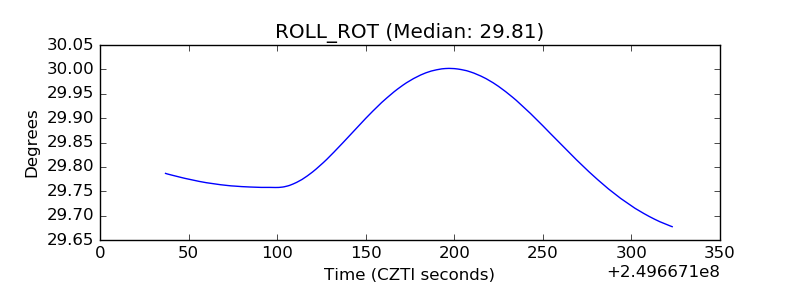 |
| _Roll_DEC | 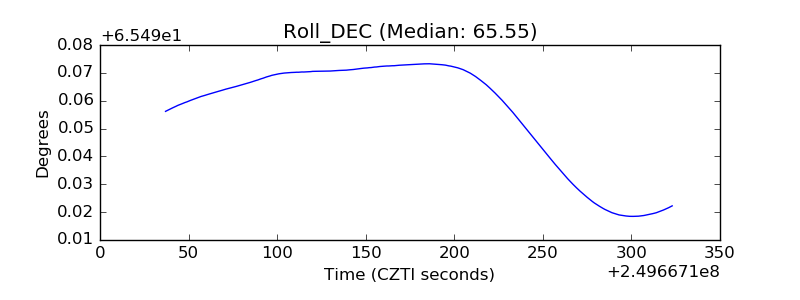 |
| _Roll_RA | 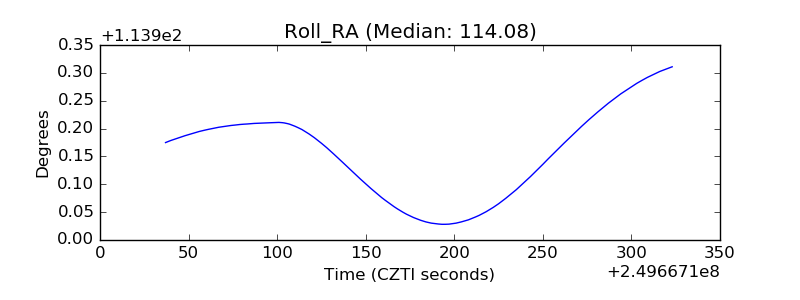 |
| Veto Counter | 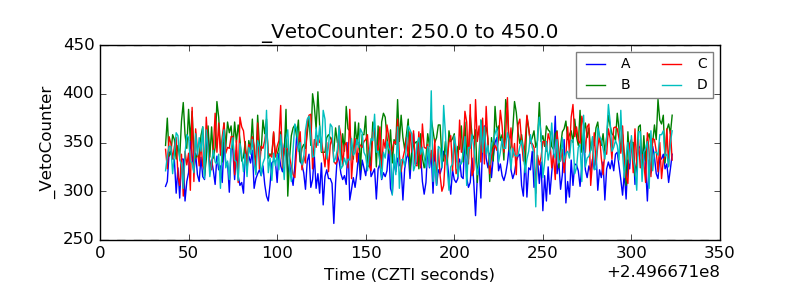 |