| Param | Original file | Final file |
|---|---|---|
| Filename | modeM0/AS1G08_060T01_9000001736_11750cztM0_level2.evt | modeM0/AS1G08_060T01_9000001736_11750cztM0_level2_quad_clean.evt |
| Size (bytes) | 536,008,320 | 106,626,240 |
| Size | 511.2 MB | 101.7 MB |
| Events in quadrant A | 3,945,750 | 709,572 |
| Events in quadrant B | 4,473,981 | 700,082 |
| Events in quadrant C | 2,845,041 | 707,488 |
| Events in quadrant D | 4,533,845 | 664,986 |
| Mode M9 | |||
|---|---|---|---|
| Quadrant | BADHDUFLAG | Total packets | Discarded packets |
| A | 0 | 12 | 0 |
| B | 0 | 12 | 0 |
| C | 0 | 12 | 0 |
| D | 0 | 13 | 0 |
| Mode SS | |||
|---|---|---|---|
| Quadrant | BADHDUFLAG | Total packets | Discarded packets |
| A | 0 | 132 | 0 |
| B | 0 | 132 | 0 |
| C | 0 | 132 | 0 |
| D | 0 | 132 | 0 |
| Mode M0 | |||
|---|---|---|---|
| Quadrant | BADHDUFLAG | Total packets | Discarded packets |
| A | 0 | 16110 | 2 |
| B | 0 | 17843 | 2 |
| C | 0 | 13047 | 2 |
| D | 0 | 17846 | 2 |
| Quadrant | Total seconds | Saturated seconds | Saturation percentage |
|---|---|---|---|
| A | 6401 | 99 | 1.546633% |
| B | 6401 | 501 | 7.826902% |
| C | 6401 | 8 | 0.124980% |
| D | 6401 | 234 | 3.655679% |
Noise dominated data is calculated using 1-second bins in cleaned event files. If a bin has >2000 counts, and if more than 50% of those come from <1% of pixels, then it is considered to be noise-dominated and hence unusable.
| Quadrant | # 1 sec bins | Bins with >0 counts | Bins with >2000 counts | High rate bins dominated by noise | Noise dominated (total time) | Noise dominated (detector-on time) | Marked lightcurve |
|---|---|---|---|---|---|---|---|
| A | 7462 | 6403 | 17 | 17 | 0.23% | 0.27% | 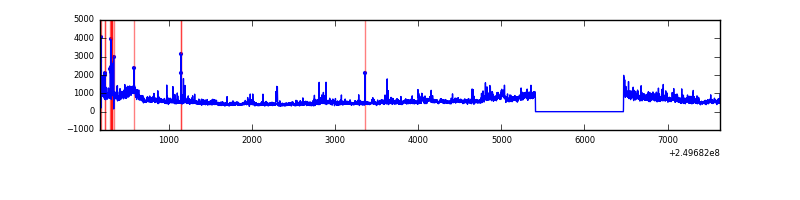 |
| B | 7462 | 6403 | 242 | 242 | 3.24% | 3.78% | 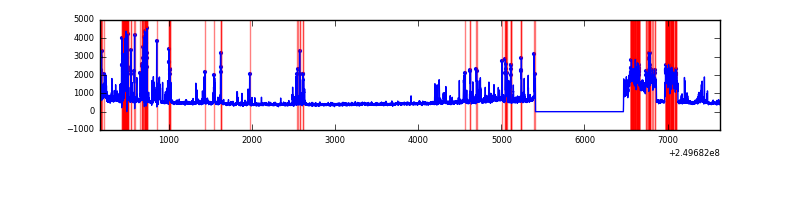 |
| C | 7462 | 6403 | 0 | 0 | 0.00% | 0.00% | 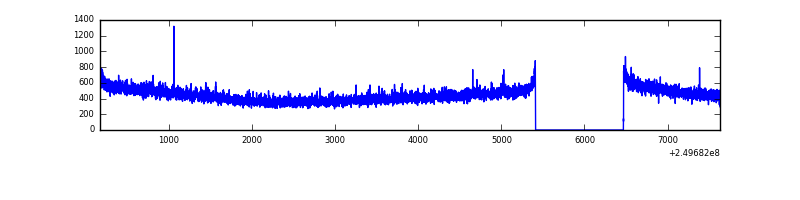 |
| D | 7462 | 6403 | 152 | 152 | 2.04% | 2.37% | 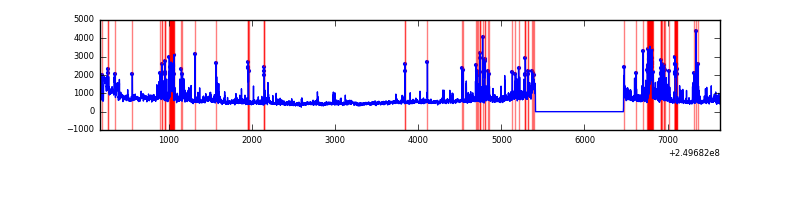 |
Top three noisy pixels from each quadrant. If the there are fewer than three noisy pixels in the level2.evt file, extra rows are filled as -1
| Pixel properties | Quadrant properties | ||||||
|---|---|---|---|---|---|---|---|
| Quadrant | DetID | PixID | Counts | Sigma | Mean | Median | Sigma |
| A | 8 | 15 | 700888 | 4626.83 | 740 | 725 | 151.3 |
| A | 1 | 162 | 97249 | 637.85 | 740 | 725 | 151.3 |
| A | 13 | 248 | 92708 | 607.84 | 740 | 725 | 151.3 |
| B | 4 | 239 | 842000 | 6015.62 | 729 | 712 | 139.9 |
| B | 10 | 16 | 571678 | 4082.68 | 729 | 712 | 139.9 |
| B | 15 | 204 | 86802 | 615.59 | 729 | 712 | 139.9 |
| C | 12 | 4 | 7959 | 42.94 | 727 | 728 | 168.4 |
| C | 13 | 61 | 5398 | 27.73 | 727 | 728 | 168.4 |
| C | 14 | 234 | 2204 | 8.76 | 727 | 728 | 168.4 |
| D | 8 | 195 | 612836 | 3556.78 | 711 | 689 | 172.1 |
| D | 1 | 52 | 506885 | 2941.17 | 711 | 689 | 172.1 |
| D | 13 | 137 | 218556 | 1265.88 | 711 | 689 | 172.1 |
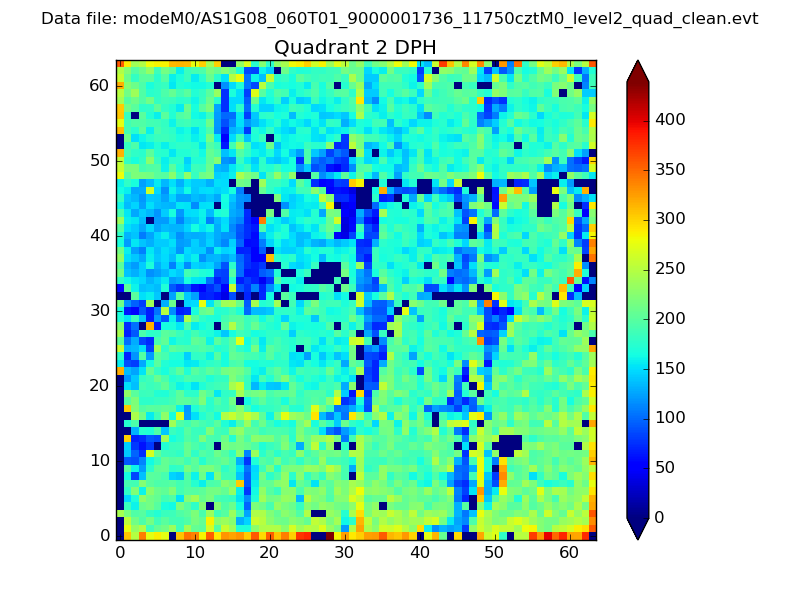
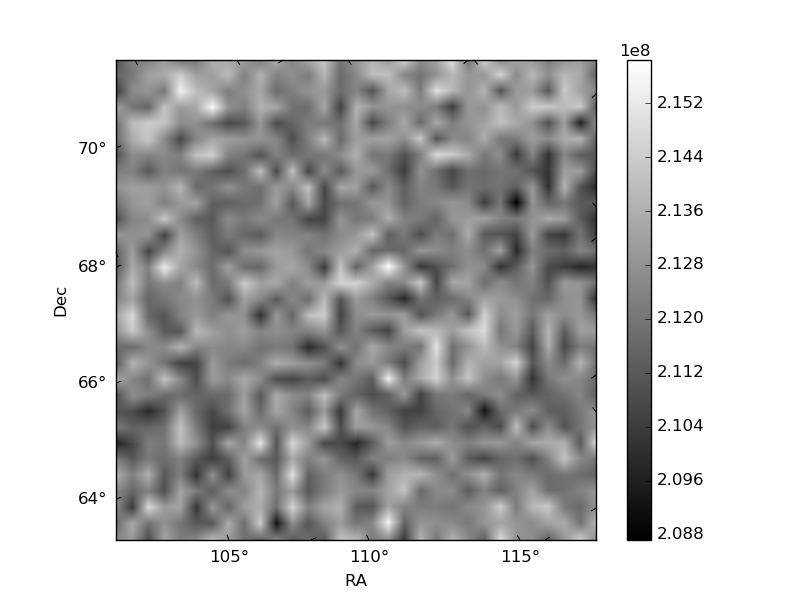
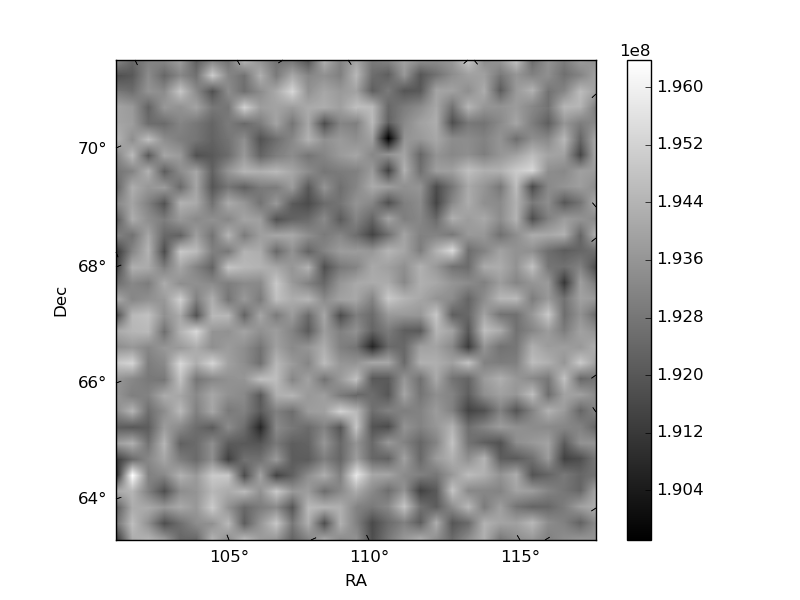
Histogram calculated using DETX and DETY for each event in the final _common_clean file
| Quadrant A | 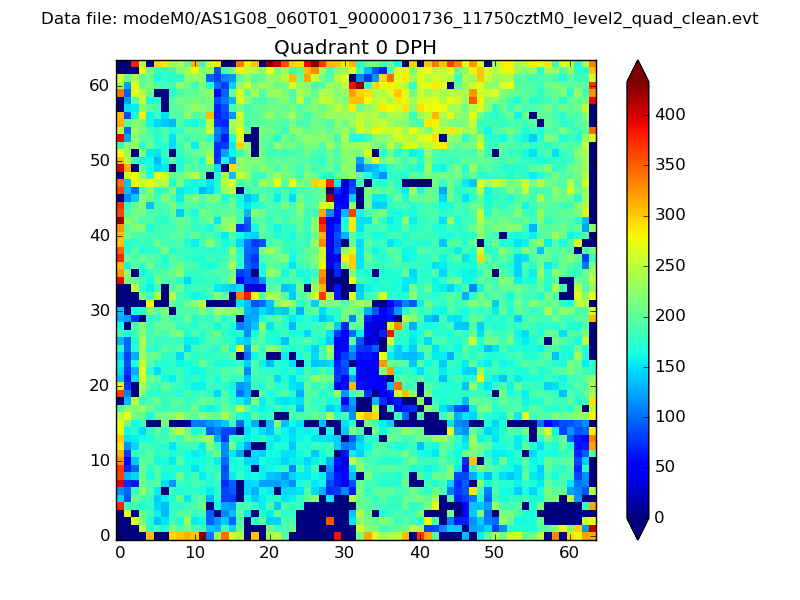 |
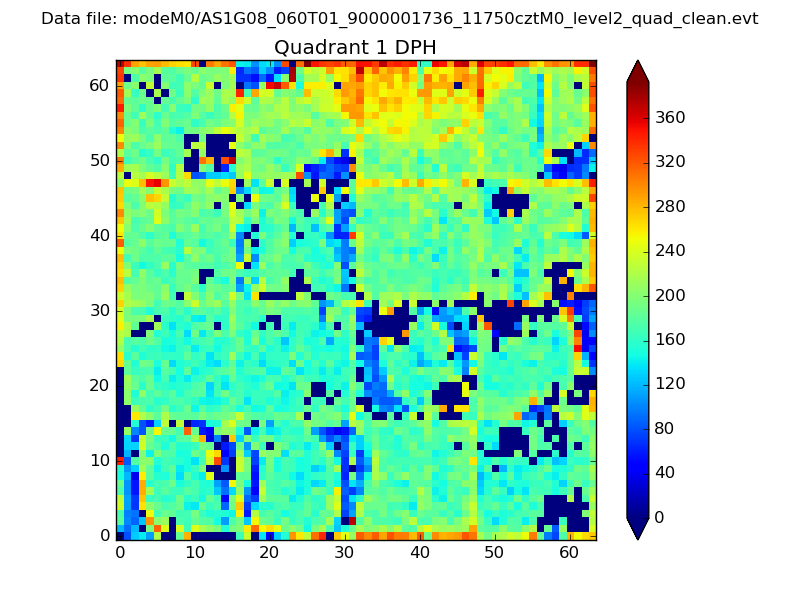 |
Quadrant B |
|---|---|---|---|
| Quadrant D | 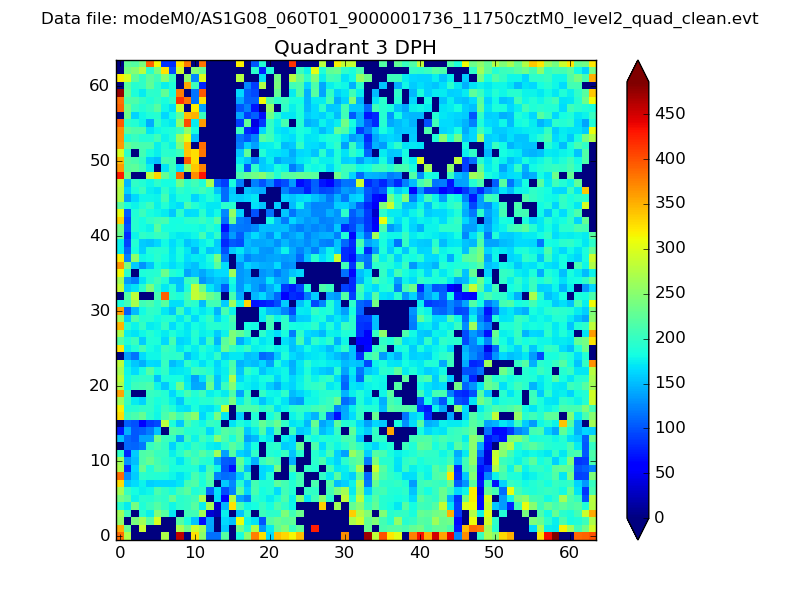 |
 |
Quadrant C |
| Plot type | Count rate plots | Images |
|---|---|---|
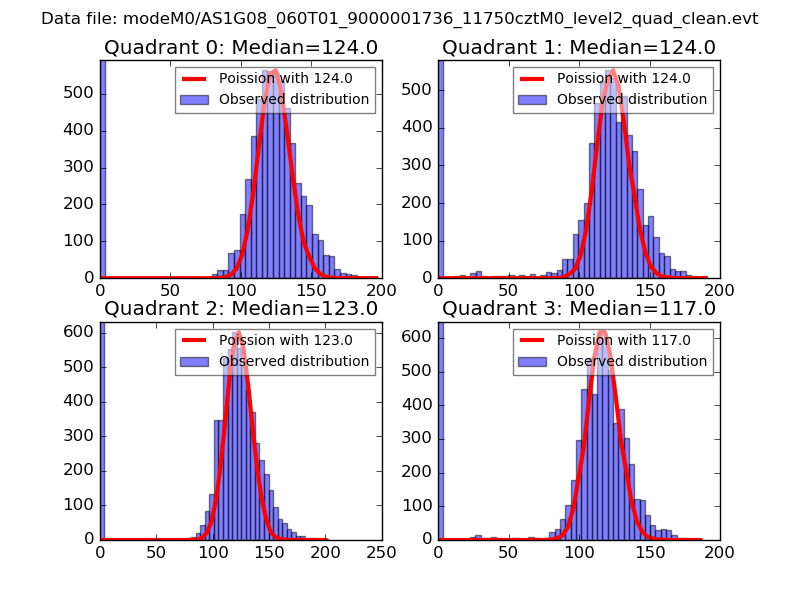
| Comparison with Poisson distribution Blue bars denote a histogram of data divided into 1 sec bins. Red curve is a Poisson curve with rate = median count rate of data. |
 |
 |
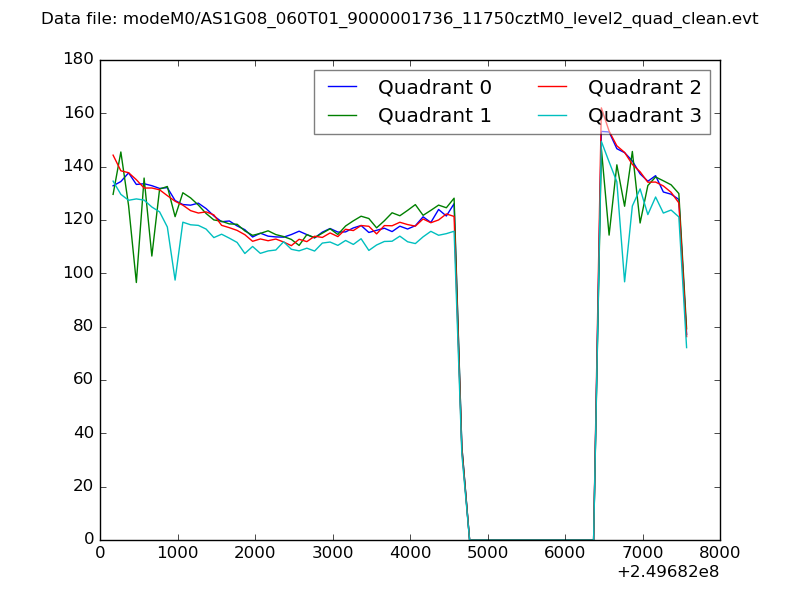
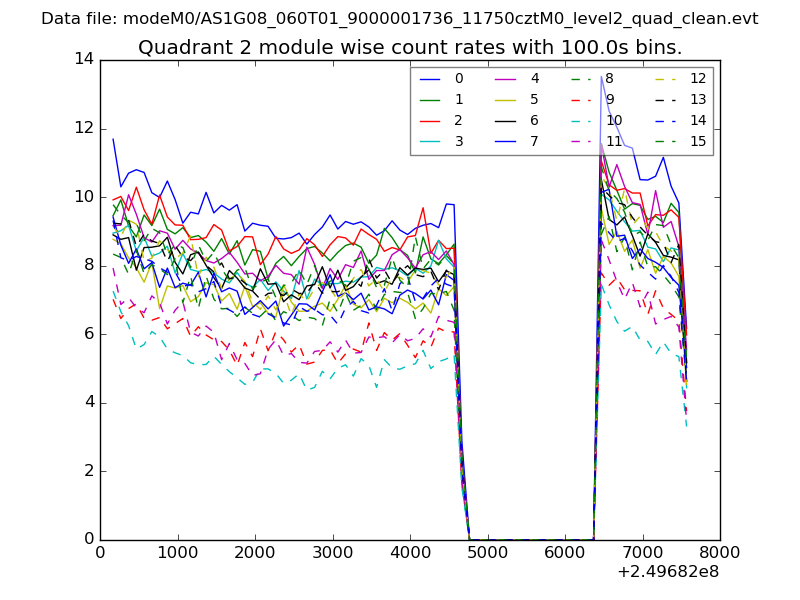
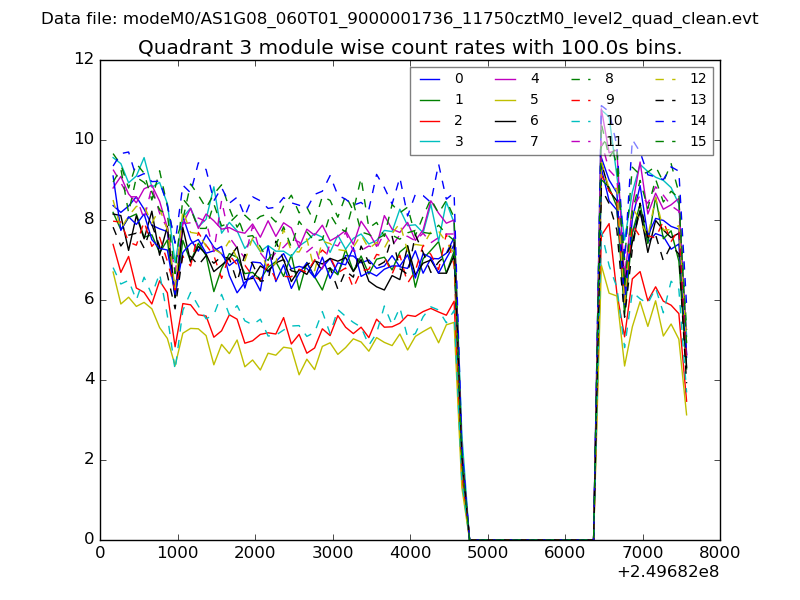
| Quadrant-wise count rates Data is divided into 100 sec bins |
 |
|
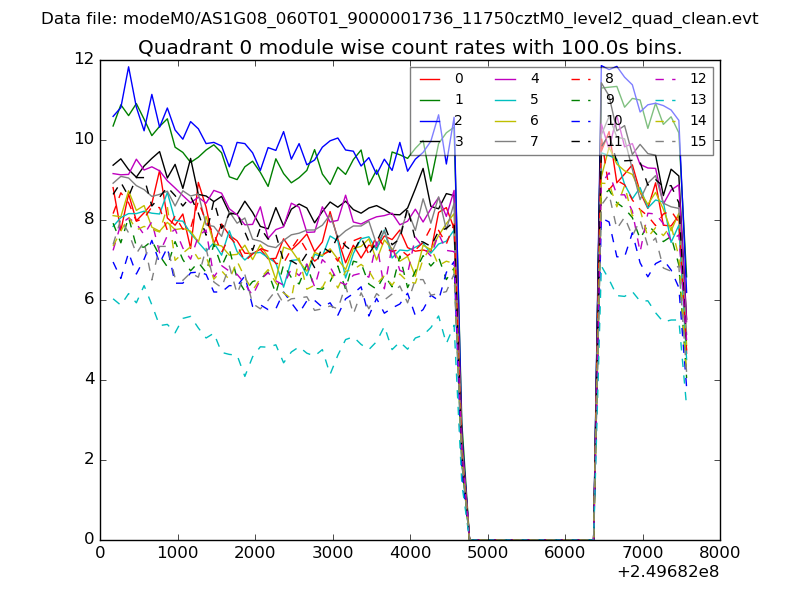
| Module-wise count rates for Quadrant A Data is divided into 100 sec bins |
 |
 |
| Module-wise count rates for Quadrant B Data is divided into 100 sec bins |
 |
 |
| Module-wise count rates for Quadrant C Data is divided into 100 sec bins |
 |
 |
| Module-wise count rates for Quadrant D Data is divided into 100 sec bins |
 |
 |
| Parameter | Plot |
|---|---|
| CZT HV Monitor | 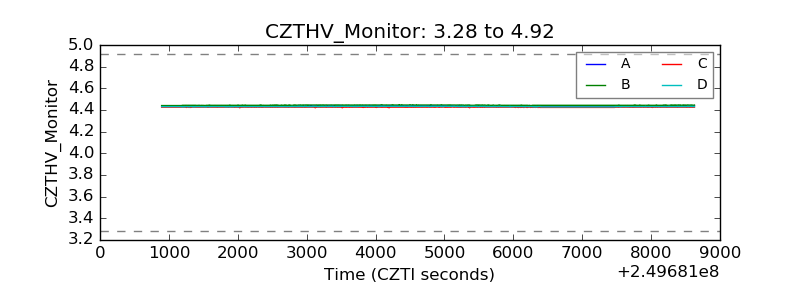 |
| D_VDD | 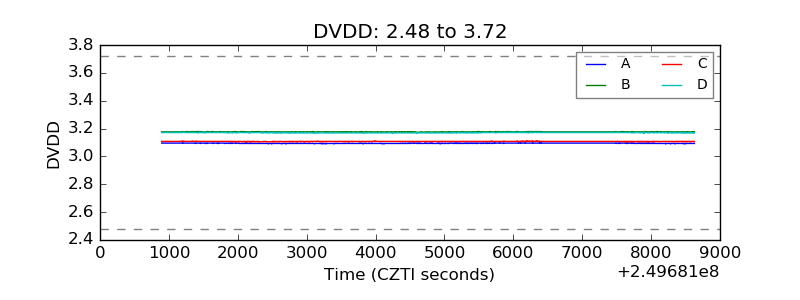 |
| Temperature 1 | 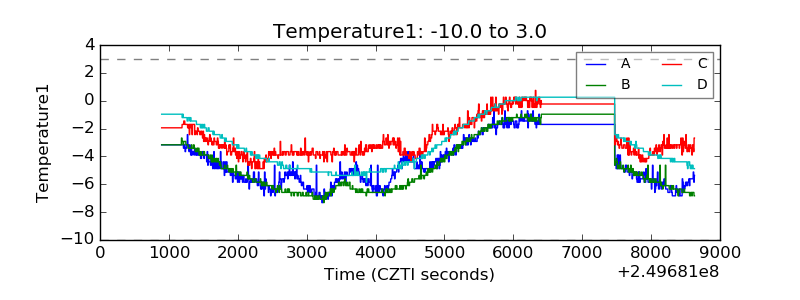 |
| Veto HV Monitor | 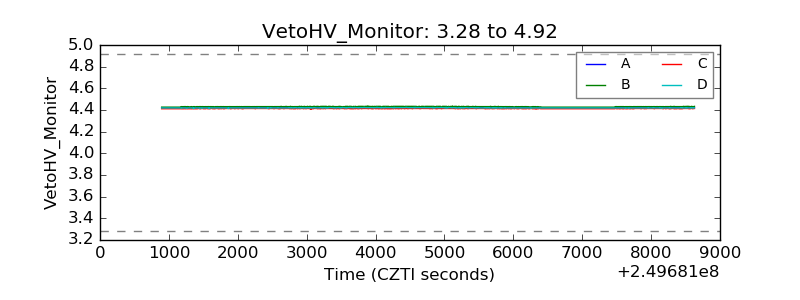 |
| Veto LLD | 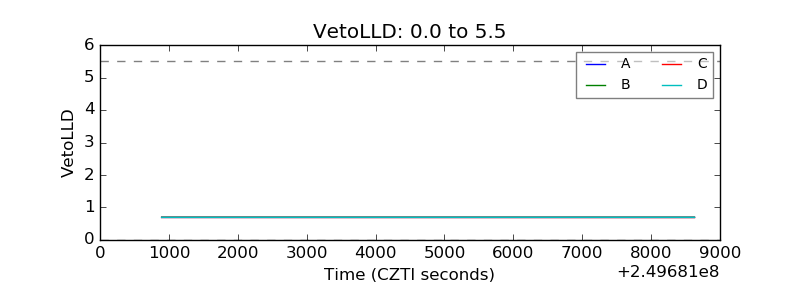 |
| Alpha Counter | 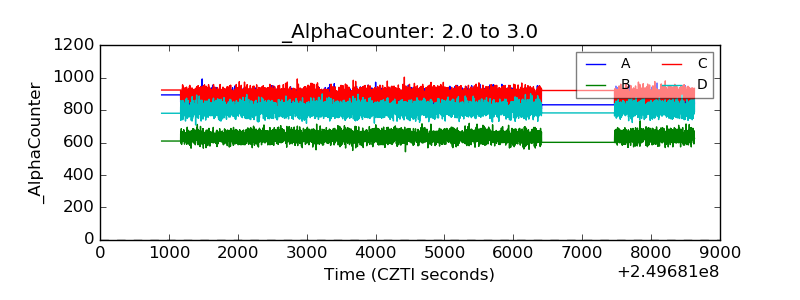 |
| _CPM_Rate | 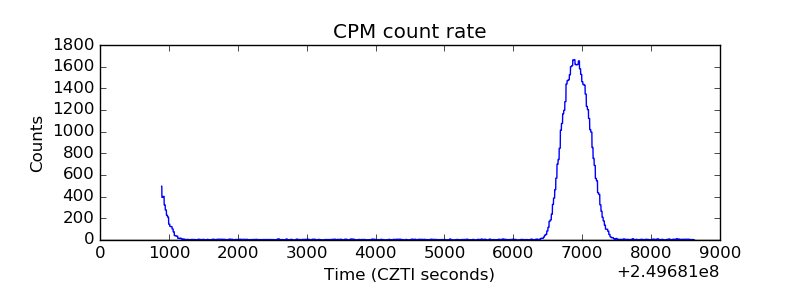 |
| CZT Counter | 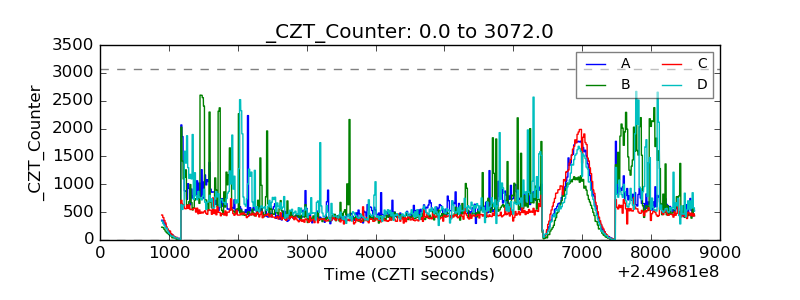 |
| +2.5 Volts monitor | 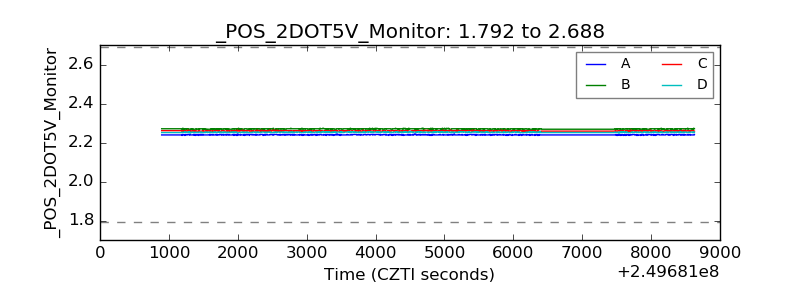 |
| +5 Volts monitor |  |
| _ROLL_ROT | 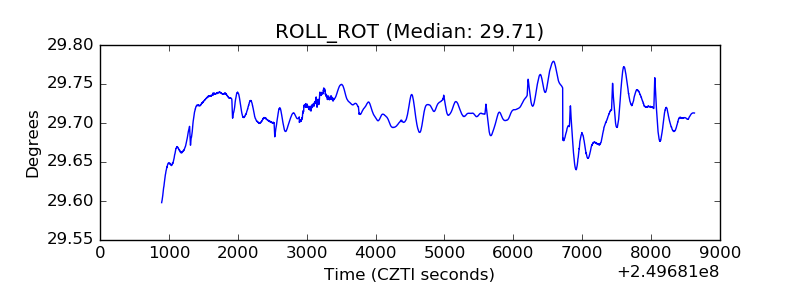 |
| _Roll_DEC | 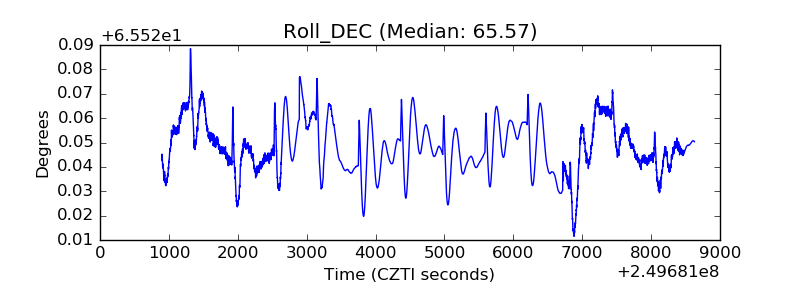 |
| _Roll_RA | 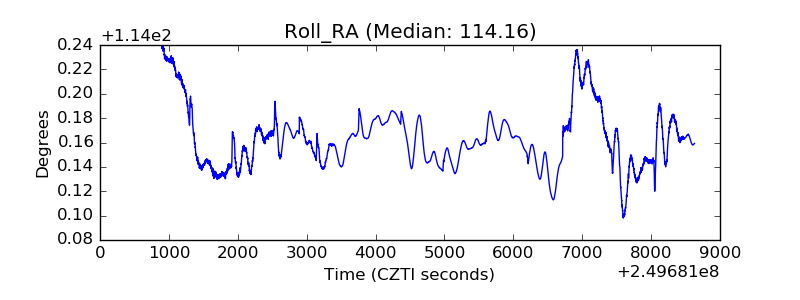 |
| Veto Counter | 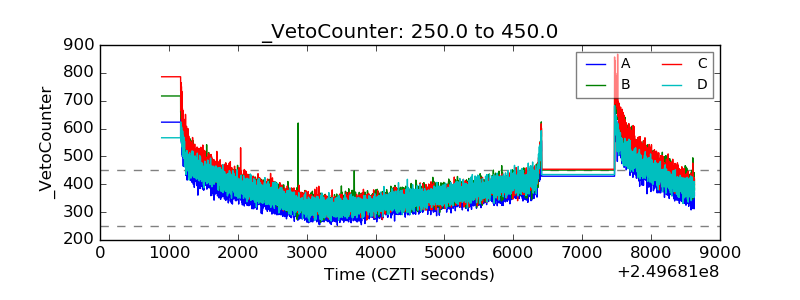 |