| Param | Original file | Final file |
|---|---|---|
| Filename | modeM0/AS1A04_231T01_9000001740cztM0_level2.fits | modeM0/AS1A04_231T01_9000001740cztM0_level2_quad_clean.evt |
| Size (bytes) | 510,560,640 | 451,753,920 |
| Size | 486.9 MB | 430.8 MB |
| Events in quadrant A | 3,096,848 | 2,740,898 |
| Events in quadrant B | 2,856,140 | 2,368,251 |
| Events in quadrant C | 3,186,080 | 2,683,245 |
| Events in quadrant D | 2,506,090 | 2,078,010 |
| Mode SS | |||
|---|---|---|---|
| Quadrant | BADHDUFLAG | Total packets | Discarded packets |
| A | 0 | 1130 | 0 |
| B | 0 | 1130 | 0 |
| C | 0 | 1130 | 0 |
| D | 0 | 1130 | 0 |
| Mode M9 | |||
|---|---|---|---|
| Quadrant | BADHDUFLAG | Total packets | Discarded packets |
| A | 0 | 89 | 0 |
| B | 0 | 89 | 0 |
| C | 0 | 89 | 0 |
| D | 0 | 89 | 0 |
| Mode M0 | |||
|---|---|---|---|
| Quadrant | BADHDUFLAG | Total packets | Discarded packets |
| A | 0 | 136978 | 0 |
| B | 0 | 204546 | 0 |
| C | 0 | 114074 | 0 |
| D | 0 | 193703 | 0 |
| Quadrant | Total seconds | Saturated seconds | Saturation percentage |
|---|---|---|---|
| A | 55506 | 1832 | 3.300544% |
| B | 55506 | 8971 | 16.162217% |
| C | 55506 | 616 | 1.109790% |
| D | 55506 | 8281 | 14.919108% |
Noise dominated data is calculated using 1-second bins in cleaned event files. If a bin has >2000 counts, and if more than 50% of those come from <1% of pixels, then it is considered to be noise-dominated and hence unusable.
| Quadrant | # 1 sec bins | Bins with >0 counts | Bins with >2000 counts | High rate bins dominated by noise | Noise dominated (total time) | Noise dominated (detector-on time) | Marked lightcurve |
|---|---|---|---|---|---|---|---|
| A | 64641 | 55503 | 0 | 0 | 0.00% | 0.00% |  |
| B | 64641 | 55455 | 0 | 0 | 0.00% | 0.00% |  |
| C | 64641 | 55507 | 0 | 0 | 0.00% | 0.00% |  |
| D | 64641 | 55390 | 0 | 0 | 0.00% | 0.00% |  |
Top three noisy pixels from each quadrant. If the there are fewer than three noisy pixels in the level2.evt file, extra rows are filled as -1
| Pixel properties | Quadrant properties | ||||||
|---|---|---|---|---|---|---|---|
| Quadrant | DetID | PixID | Counts | Sigma | Mean | Median | Sigma |
| A | 0 | 29 | 3041 | 11.22 | 807 | 754 | 203.9 |
| A | 7 | 110 | 2503 | 8.58 | 807 | 754 | 203.9 |
| A | 0 | 30 | 2381 | 7.98 | 807 | 754 | 203.9 |
| B | 2 | 9 | 2455 | 11.6 | 756 | 722 | 149.4 |
| B | 3 | 17 | 1924 | 8.05 | 756 | 722 | 149.4 |
| B | 5 | 128 | 1901 | 7.89 | 756 | 722 | 149.4 |
| C | 1 | 80 | 2432 | 7.59 | 841 | 786 | 216.9 |
| C | 1 | 81 | 2341 | 7.17 | 841 | 786 | 216.9 |
| C | 12 | 241 | 2272 | 6.85 | 841 | 786 | 216.9 |
| D | 6 | 231 | 1873 | 6.41 | 715 | 652 | 190.4 |
| D | 3 | 14 | 1856 | 6.32 | 715 | 652 | 190.4 |
| D | 10 | 189 | 1821 | 6.14 | 715 | 652 | 190.4 |
Histogram calculated using DETX and DETY for each event in the final _common_clean file
| Quadrant A | 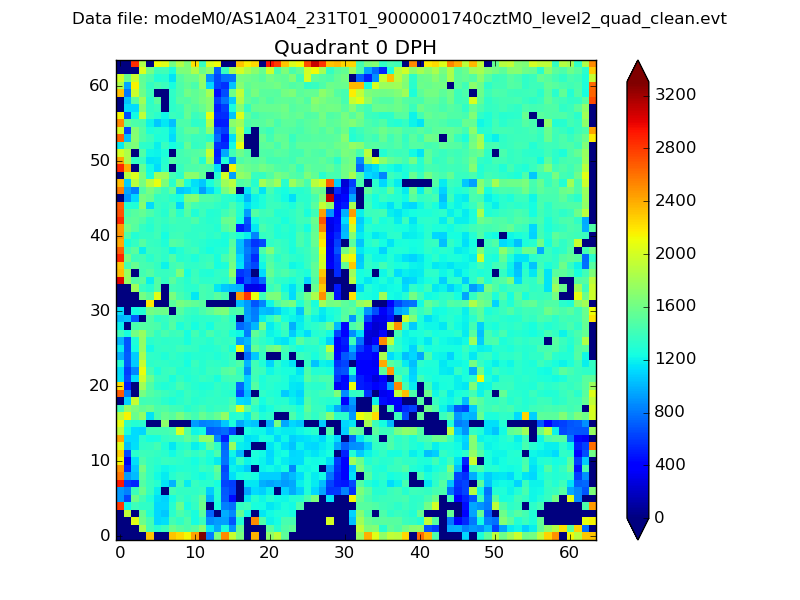 |
 |
Quadrant B |
|---|---|---|---|
| Quadrant D |  |
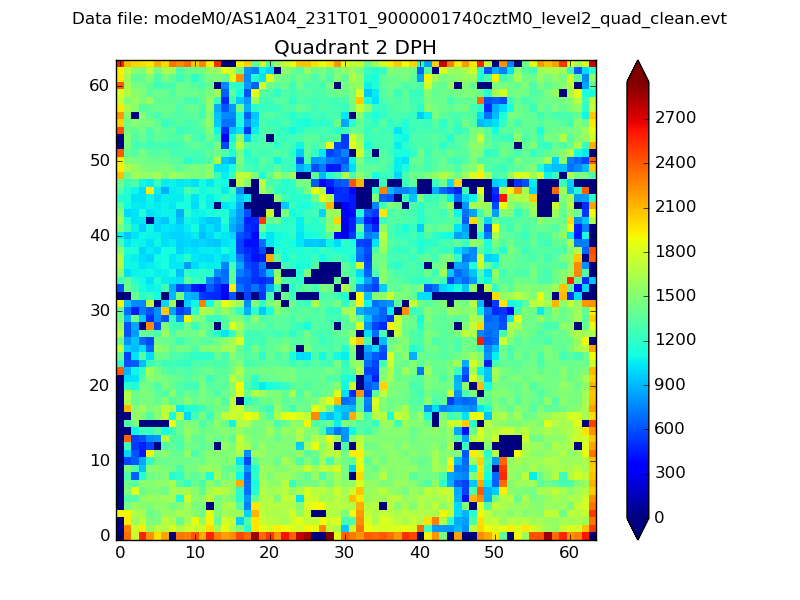 |
Quadrant C |
| Plot type | Count rate plots | Images |
|---|---|---|
| Comparison with Poisson distribution Blue bars denote a histogram of data divided into 1 sec bins. Red curve is a Poisson curve with rate = median count rate of data. |
 |
 |
| Quadrant-wise count rates Data is divided into 100 sec bins |
 |
|
| Module-wise count rates for Quadrant A Data is divided into 100 sec bins |
 |
 |
| Module-wise count rates for Quadrant B Data is divided into 100 sec bins |
 |
 |
| Module-wise count rates for Quadrant C Data is divided into 100 sec bins |
 |
 |
| Module-wise count rates for Quadrant D Data is divided into 100 sec bins |
 |
 |
| Parameter | Plot |
|---|---|
| CZT HV Monitor |  |
| D_VDD | 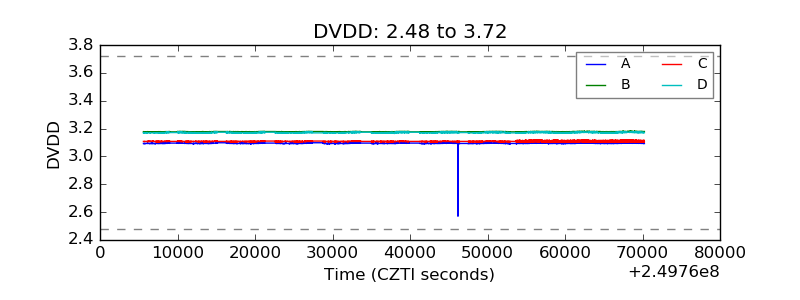 |
| Temperature 1 |  |
| Veto HV Monitor |  |
| Veto LLD |  |
| Alpha Counter |  |
| _CPM_Rate |  |
| CZT Counter |  |
| +2.5 Volts monitor |  |
| +5 Volts monitor |  |
| _ROLL_ROT |  |
| _Roll_DEC |  |
| _Roll_RA |  |
| Veto Counter |  |