| Param | Original file | Final file |
|---|---|---|
| Filename | modeM0/AS1A04_231T01_9000001740_11762cztM0_level2.evt | modeM0/AS1A04_231T01_9000001740_11762cztM0_level2_quad_clean.evt |
| Size (bytes) | 403,698,240 | 77,120,640 |
| Size | 385.0 MB | 73.5 MB |
| Events in quadrant A | 3,064,392 | 501,375 |
| Events in quadrant B | 3,441,297 | 501,500 |
| Events in quadrant C | 2,134,988 | 514,124 |
| Events in quadrant D | 3,257,766 | 480,119 |
| Mode SS | |||
|---|---|---|---|
| Quadrant | BADHDUFLAG | Total packets | Discarded packets |
| A | 0 | 98 | 0 |
| B | 0 | 98 | 0 |
| C | 0 | 98 | 0 |
| D | 0 | 98 | 0 |
| Mode M9 | |||
|---|---|---|---|
| Quadrant | BADHDUFLAG | Total packets | Discarded packets |
| A | 0 | 9 | 0 |
| B | 0 | 9 | 0 |
| C | 0 | 9 | 0 |
| D | 0 | 9 | 0 |
| Mode M0 | |||
|---|---|---|---|
| Quadrant | BADHDUFLAG | Total packets | Discarded packets |
| A | 0 | 12433 | 2 |
| B | 0 | 13590 | 1 |
| C | 0 | 9741 | 1 |
| D | 0 | 13018 | 1 |
| Quadrant | Total seconds | Saturated seconds | Saturation percentage |
|---|---|---|---|
| A | 4817 | 210 | 4.359560% |
| B | 4817 | 355 | 7.369732% |
| C | 4817 | 21 | 0.435956% |
| D | 4817 | 204 | 4.235001% |
Noise dominated data is calculated using 1-second bins in cleaned event files. If a bin has >2000 counts, and if more than 50% of those come from <1% of pixels, then it is considered to be noise-dominated and hence unusable.
| Quadrant | # 1 sec bins | Bins with >0 counts | Bins with >2000 counts | High rate bins dominated by noise | Noise dominated (total time) | Noise dominated (detector-on time) | Marked lightcurve |
|---|---|---|---|---|---|---|---|
| A | 5773 | 4819 | 61 | 61 | 1.06% | 1.27% | 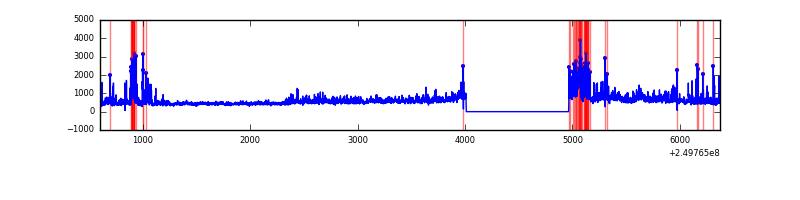 |
| B | 5773 | 4819 | 175 | 175 | 3.03% | 3.63% | 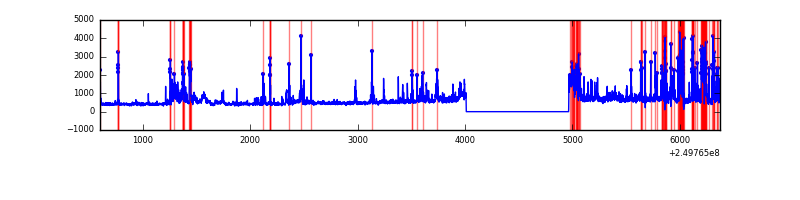 |
| C | 5773 | 4819 | 0 | 0 | 0.00% | 0.00% | 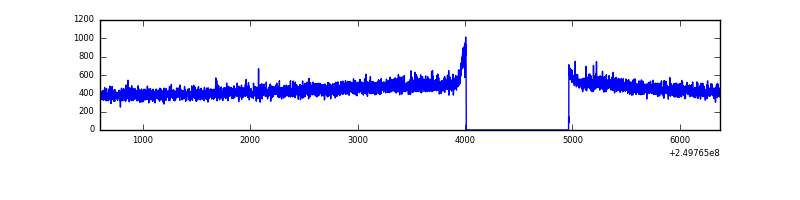 |
| D | 5773 | 4819 | 172 | 172 | 2.98% | 3.57% | 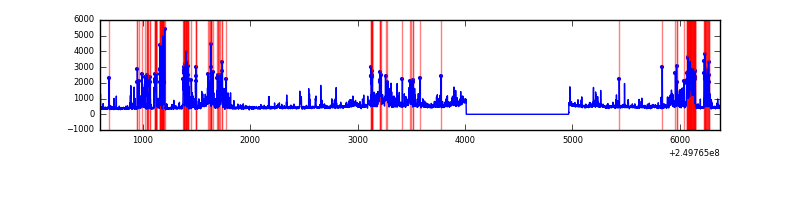 |
Top three noisy pixels from each quadrant. If the there are fewer than three noisy pixels in the level2.evt file, extra rows are filled as -1
| Pixel properties | Quadrant properties | ||||||
|---|---|---|---|---|---|---|---|
| Quadrant | DetID | PixID | Counts | Sigma | Mean | Median | Sigma |
| A | 8 | 15 | 220523 | 1925.27 | 549 | 537 | 114.3 |
| A | 5 | 16 | 218359 | 1906.33 | 549 | 537 | 114.3 |
| A | 1 | 162 | 137671 | 1200.17 | 549 | 537 | 114.3 |
| B | 4 | 239 | 592758 | 5644.14 | 545 | 531 | 104.9 |
| B | 10 | 16 | 217666 | 2069.38 | 545 | 531 | 104.9 |
| B | 3 | 64 | 206815 | 1965.96 | 545 | 531 | 104.9 |
| C | 13 | 61 | 4209 | 28.53 | 547 | 549 | 128.3 |
| C | 3 | 202 | 1414 | 6.74 | 547 | 549 | 128.3 |
| C | -1 | -1 | -1 | -1.0 | 547 | 549 | 128.3 |
| D | 1 | 52 | 968611 | 7503.5 | 535 | 520 | 129.0 |
| D | 13 | 249 | 62771 | 482.5 | 535 | 520 | 129.0 |
| D | 10 | 199 | 45521 | 348.79 | 535 | 520 | 129.0 |
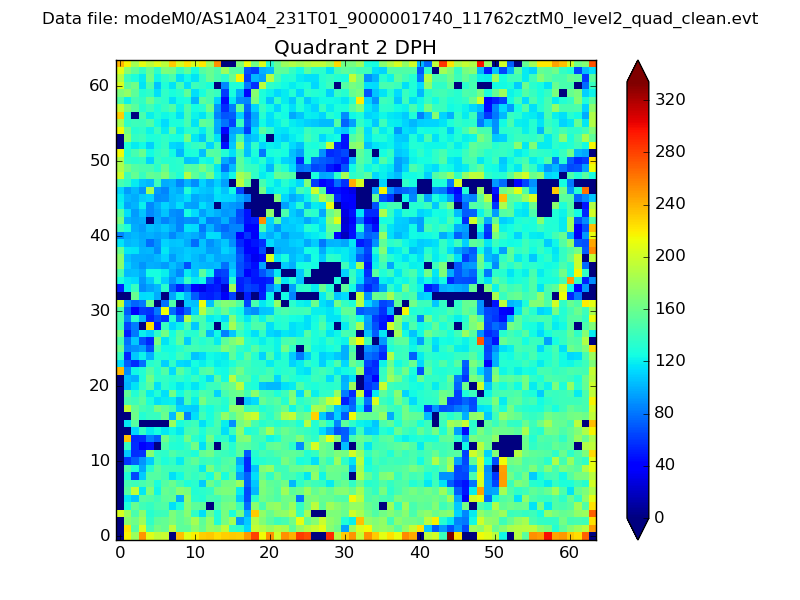
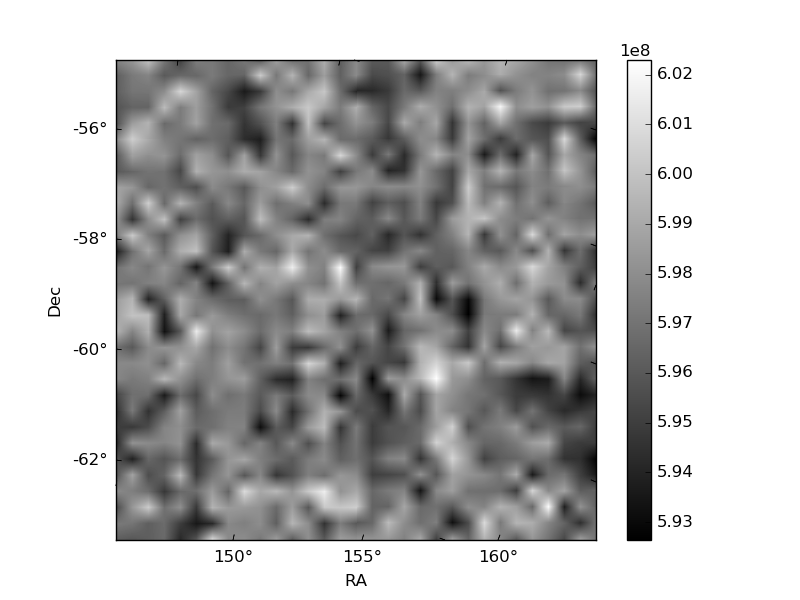
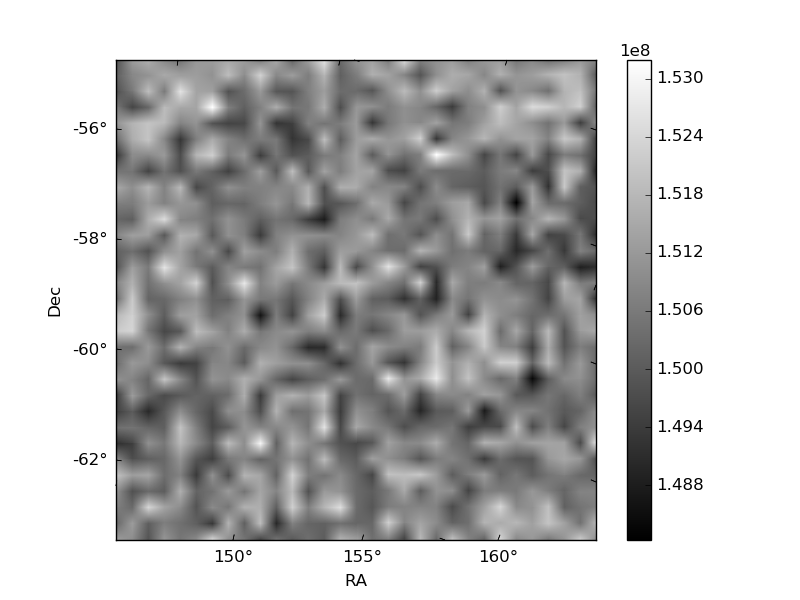
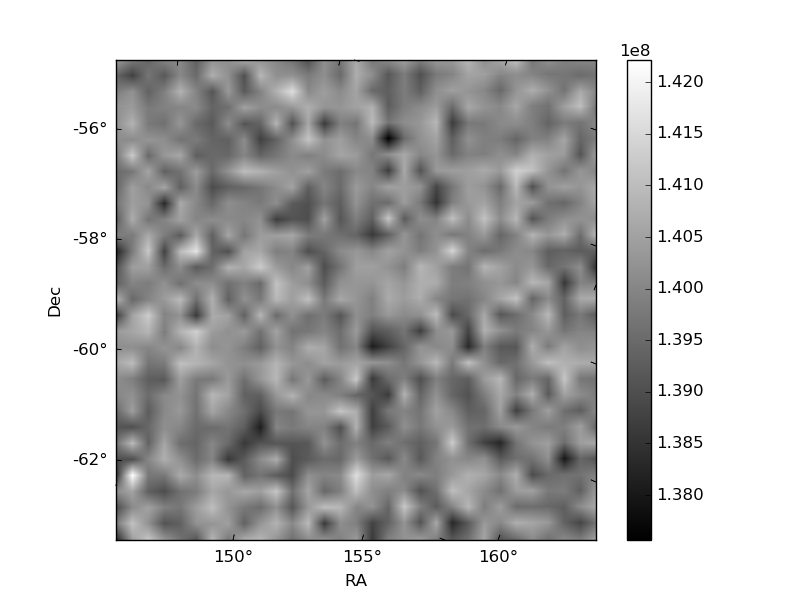
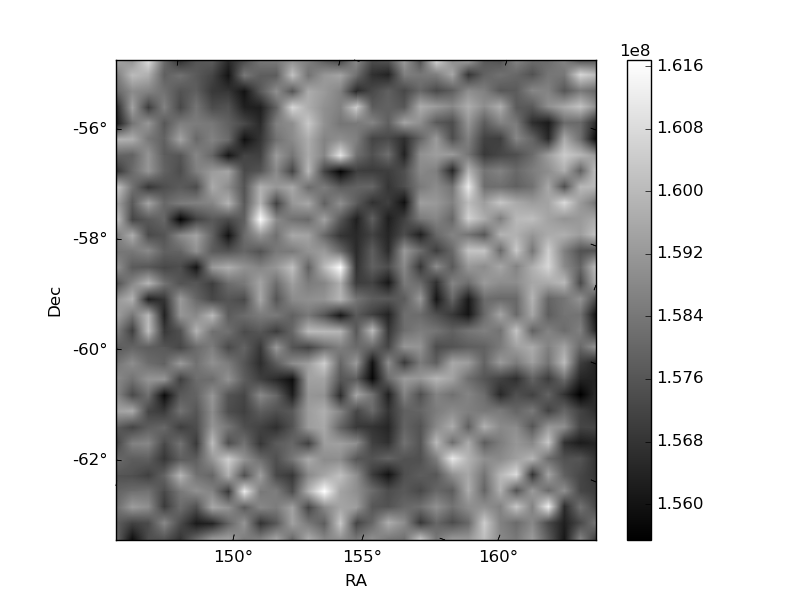
Histogram calculated using DETX and DETY for each event in the final _common_clean file
| Quadrant A | 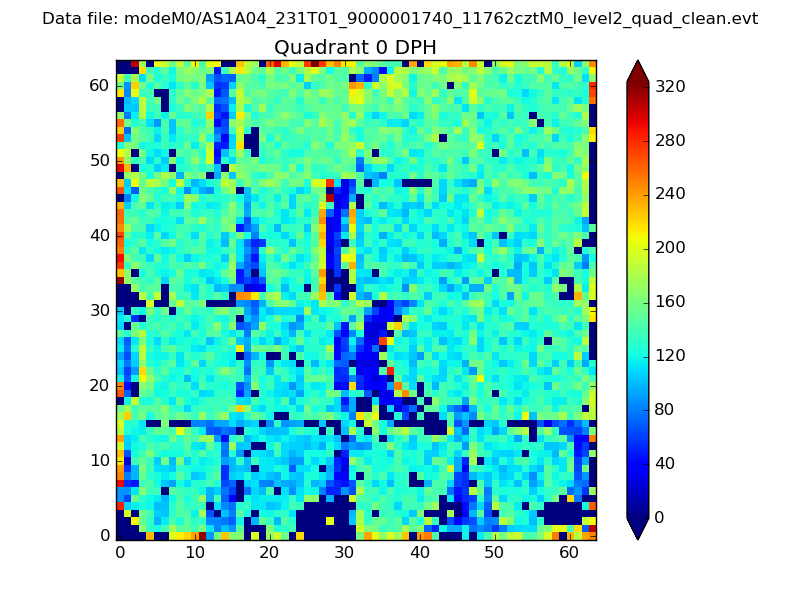 |
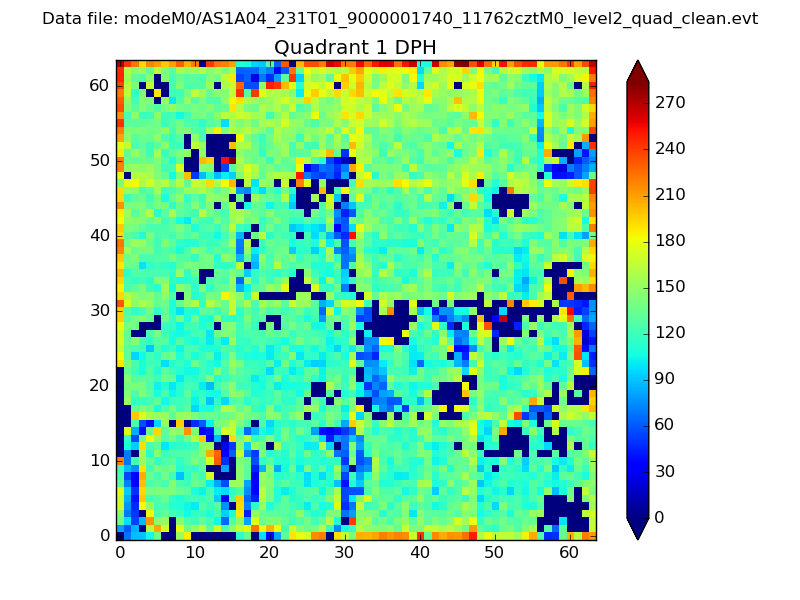 |
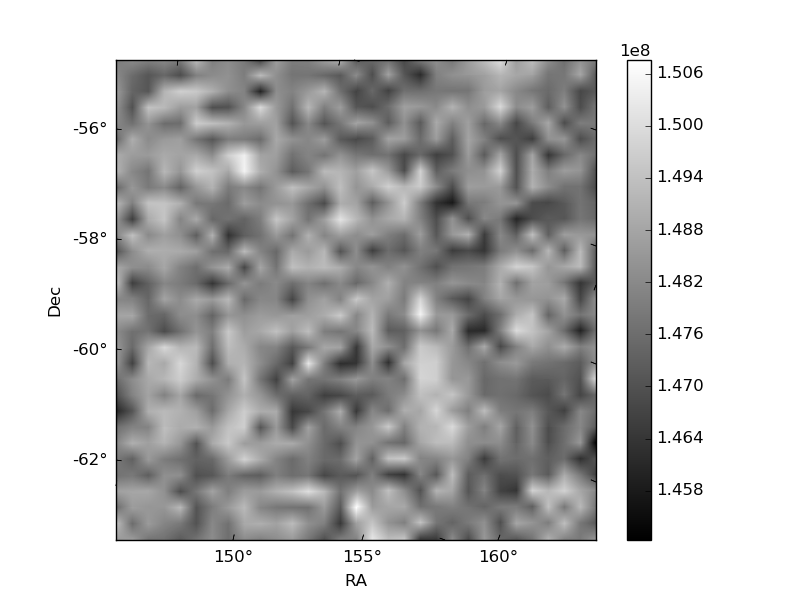
Quadrant B |
|---|---|---|---|
| Quadrant D | 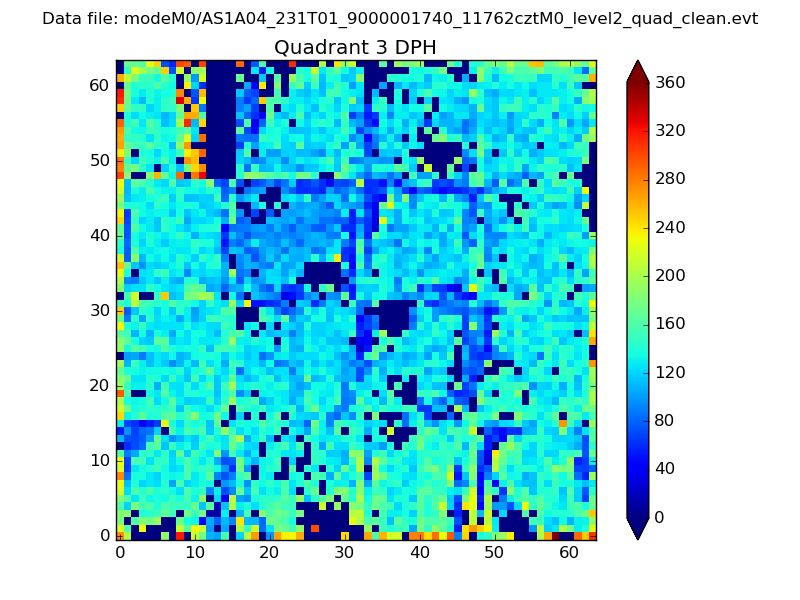 |
 |
Quadrant C |
| Plot type | Count rate plots | Images |
|---|---|---|
| Comparison with Poisson distribution Blue bars denote a histogram of data divided into 1 sec bins. Red curve is a Poisson curve with rate = median count rate of data. |
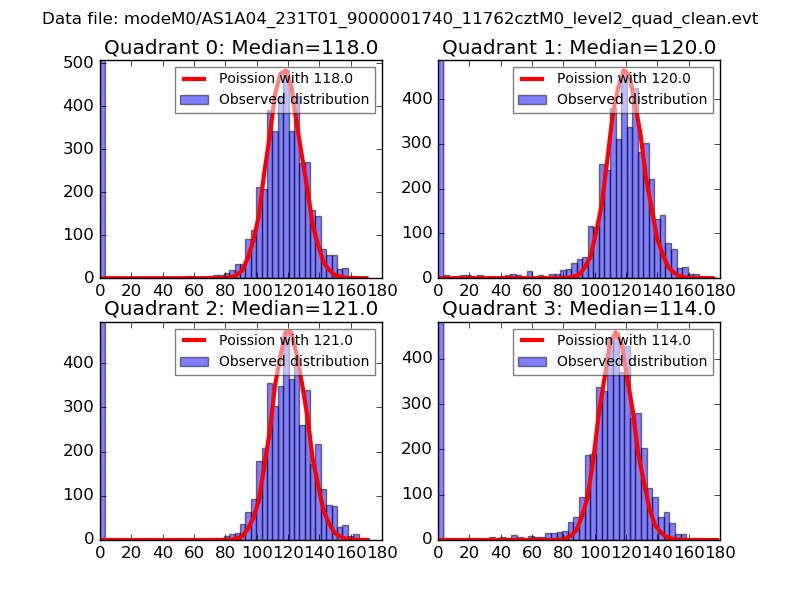 |
 |
| Quadrant-wise count rates Data is divided into 100 sec bins |
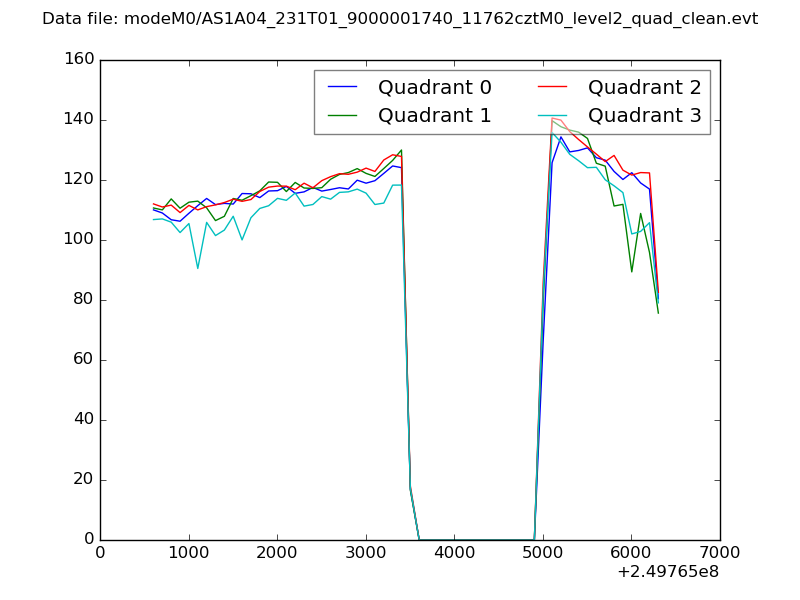 |
|
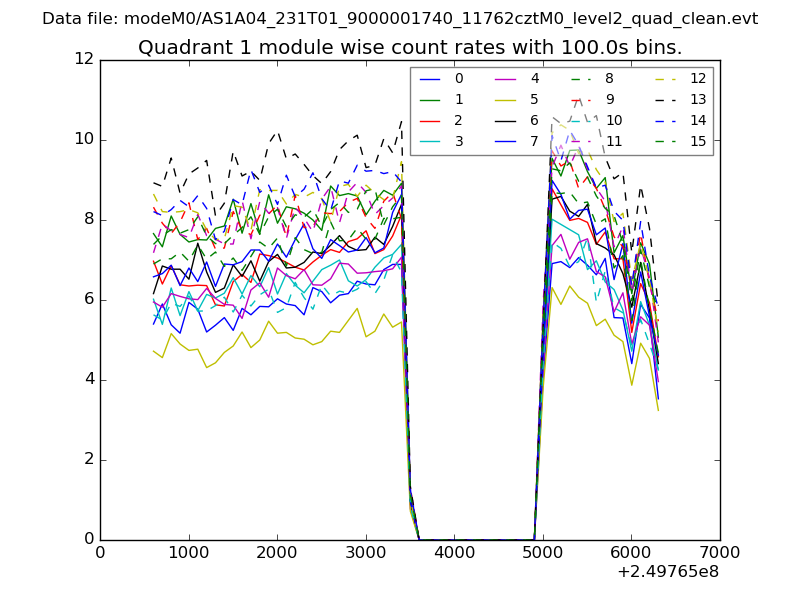
| Module-wise count rates for Quadrant A Data is divided into 100 sec bins |
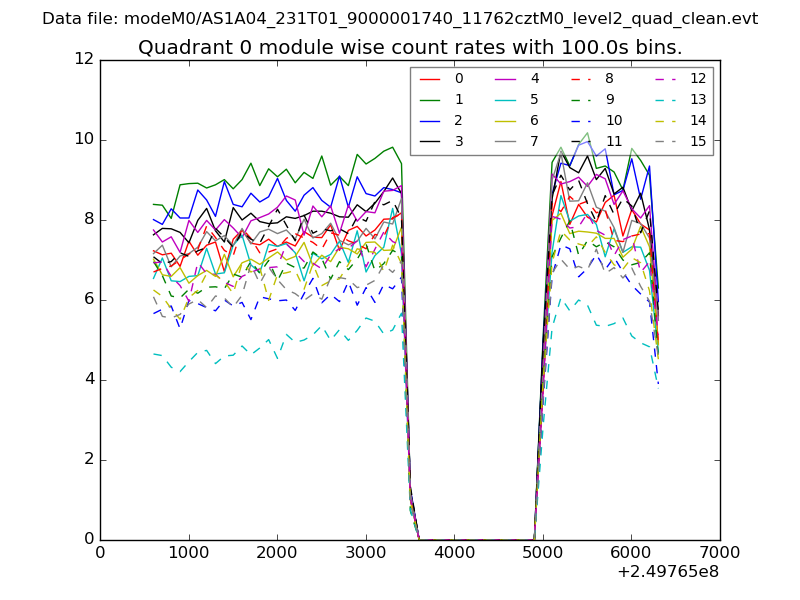 |
 |
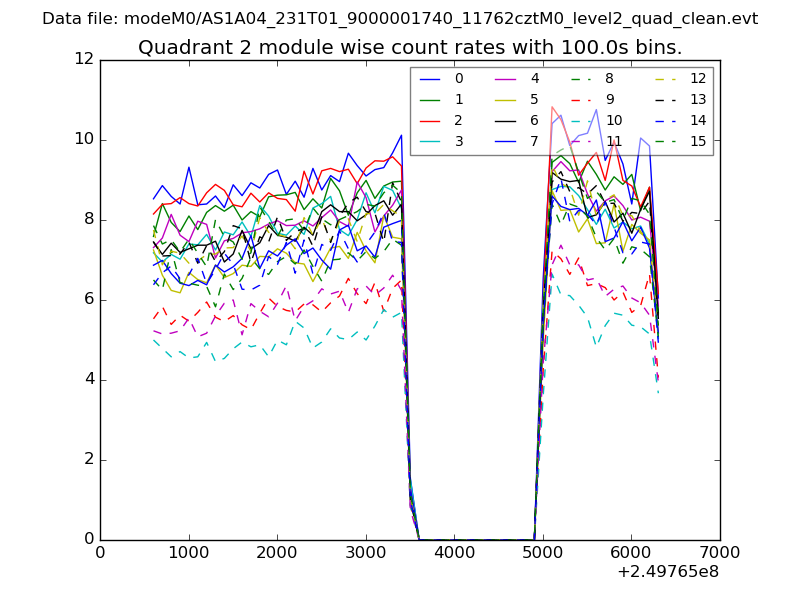
| Module-wise count rates for Quadrant B Data is divided into 100 sec bins |
 |
 |
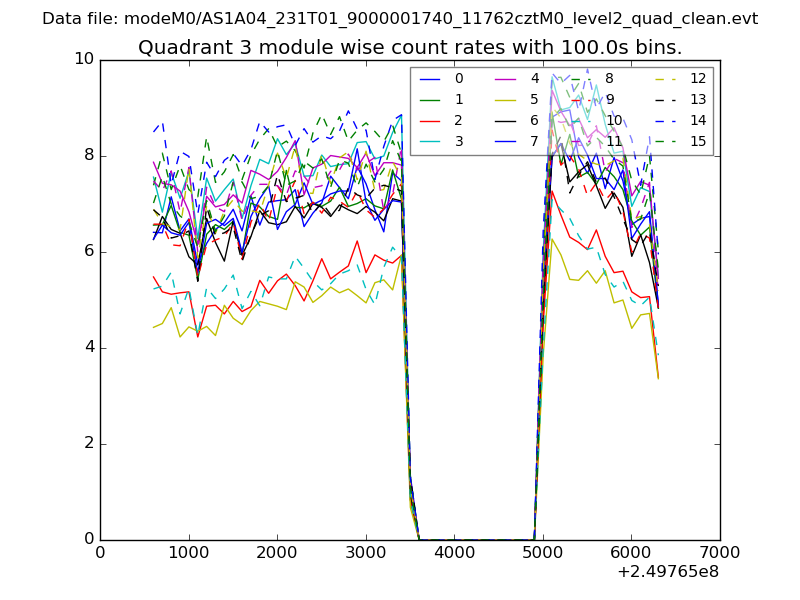
| Module-wise count rates for Quadrant C Data is divided into 100 sec bins |
 |
 |
| Module-wise count rates for Quadrant D Data is divided into 100 sec bins |
 |
 |
| Parameter | Plot |
|---|---|
| CZT HV Monitor | 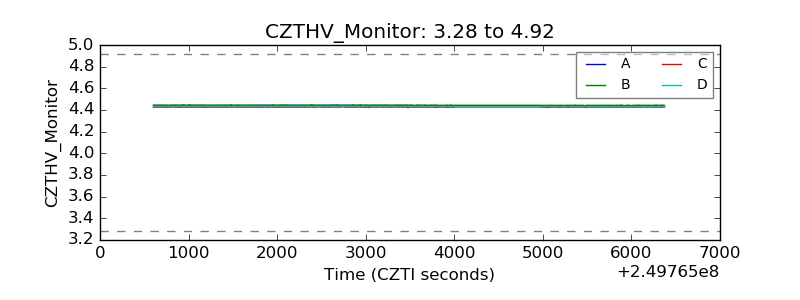 |
| D_VDD | 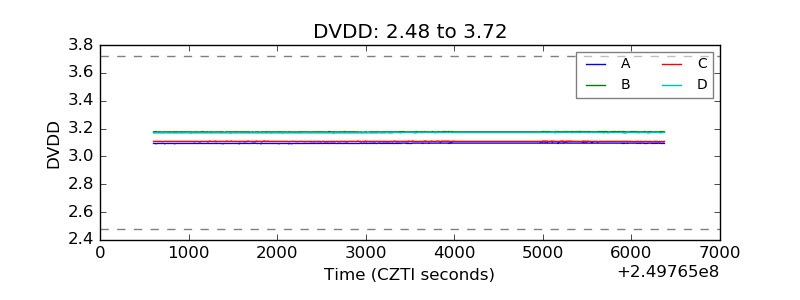 |
| Temperature 1 | 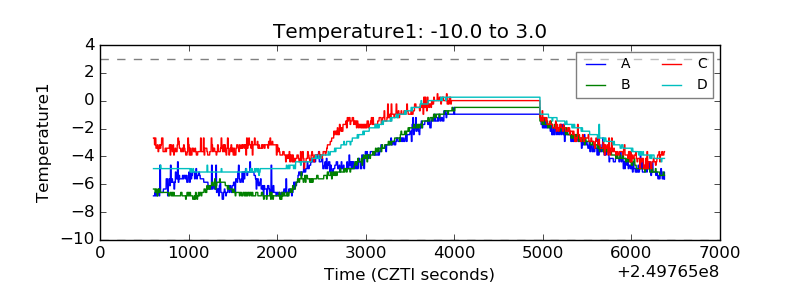 |
| Veto HV Monitor | 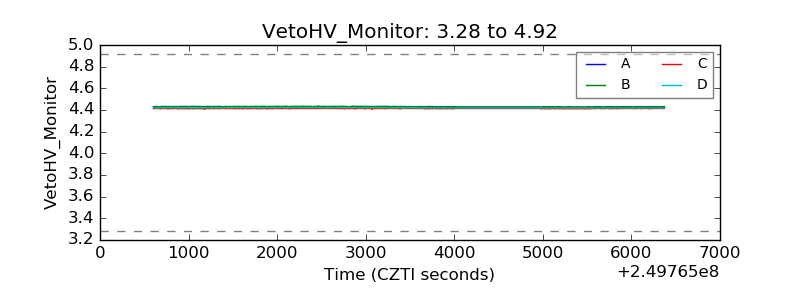 |
| Veto LLD | 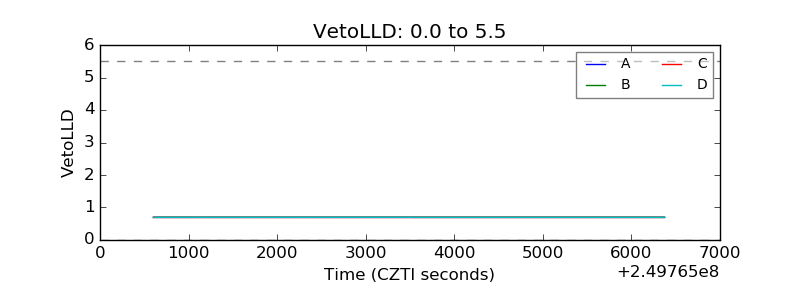 |
| Alpha Counter | 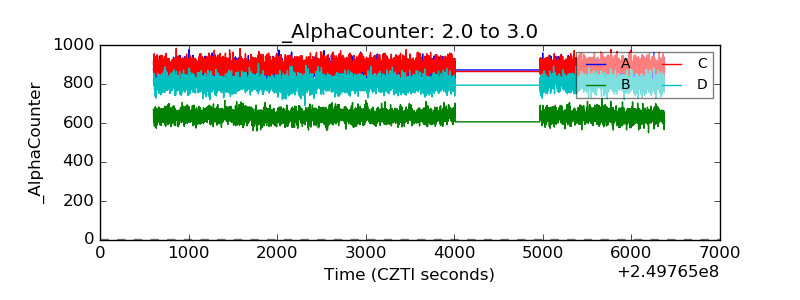 |
| _CPM_Rate | 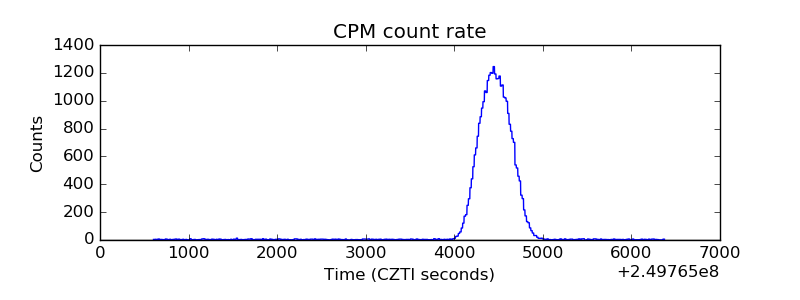 |
| CZT Counter | 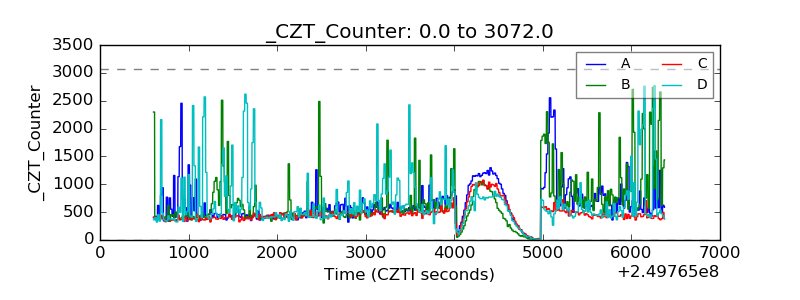 |
| +2.5 Volts monitor |  |
| +5 Volts monitor | 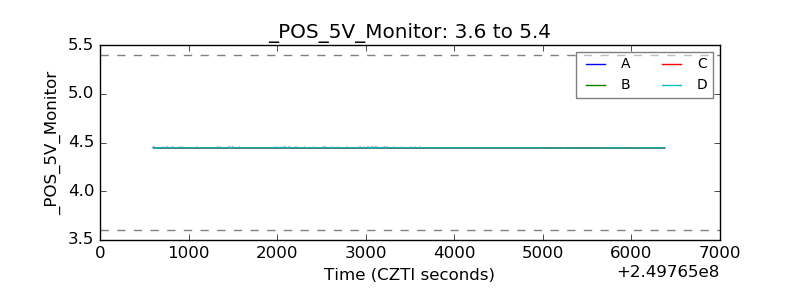 |
| _ROLL_ROT | 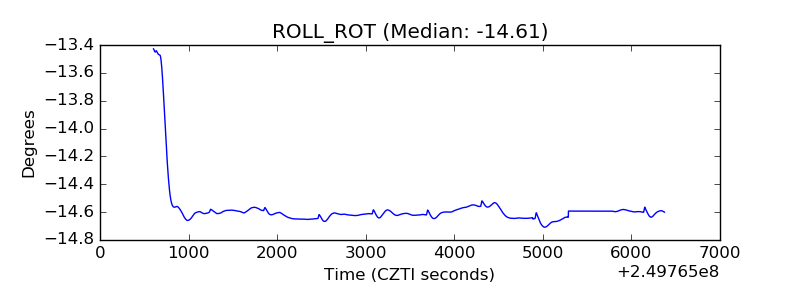 |
| _Roll_DEC | 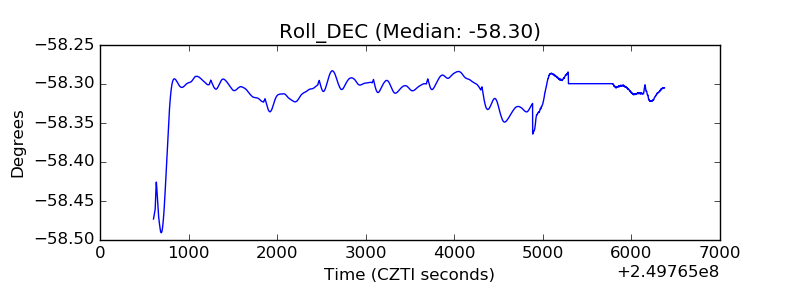 |
| _Roll_RA | 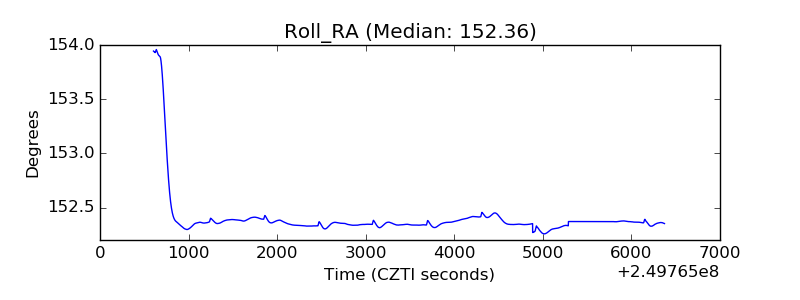 |
| Veto Counter | 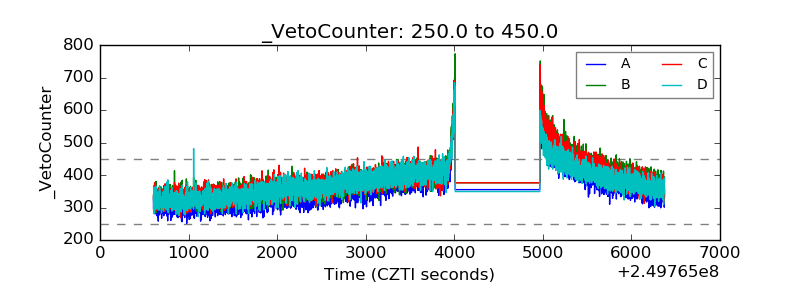 |