| Param | Original file | Final file |
|---|---|---|
| Filename | modeM0/AS1A04_231T01_9000001740_11764cztM0_level2.evt | modeM0/AS1A04_231T01_9000001740_11764cztM0_level2_quad_clean.evt |
| Size (bytes) | 586,995,840 | 105,975,360 |
| Size | 559.8 MB | 101.1 MB |
| Events in quadrant A | 4,077,095 | 697,778 |
| Events in quadrant B | 5,274,772 | 690,251 |
| Events in quadrant C | 2,977,784 | 713,068 |
| Events in quadrant D | 5,001,469 | 649,046 |
| Mode SS | |||
|---|---|---|---|
| Quadrant | BADHDUFLAG | Total packets | Discarded packets |
| A | 0 | 136 | 0 |
| B | 0 | 136 | 0 |
| C | 0 | 136 | 0 |
| D | 0 | 136 | 0 |
| Mode M9 | |||
|---|---|---|---|
| Quadrant | BADHDUFLAG | Total packets | Discarded packets |
| A | 0 | 20 | 0 |
| B | 0 | 20 | 0 |
| C | 0 | 20 | 0 |
| D | 0 | 20 | 0 |
| Mode M0 | |||
|---|---|---|---|
| Quadrant | BADHDUFLAG | Total packets | Discarded packets |
| A | 0 | 16699 | 3 |
| B | 0 | 20328 | 2 |
| C | 0 | 13420 | 2 |
| D | 0 | 19207 | 2 |
| Quadrant | Total seconds | Saturated seconds | Saturation percentage |
|---|---|---|---|
| A | 6580 | 280 | 4.255319% |
| B | 6580 | 676 | 10.273556% |
| C | 6580 | 42 | 0.638298% |
| D | 6580 | 484 | 7.355623% |
Noise dominated data is calculated using 1-second bins in cleaned event files. If a bin has >2000 counts, and if more than 50% of those come from <1% of pixels, then it is considered to be noise-dominated and hence unusable.
| Quadrant | # 1 sec bins | Bins with >0 counts | Bins with >2000 counts | High rate bins dominated by noise | Noise dominated (total time) | Noise dominated (detector-on time) | Marked lightcurve |
|---|---|---|---|---|---|---|---|
| A | 8636 | 6583 | 59 | 59 | 0.68% | 0.90% | 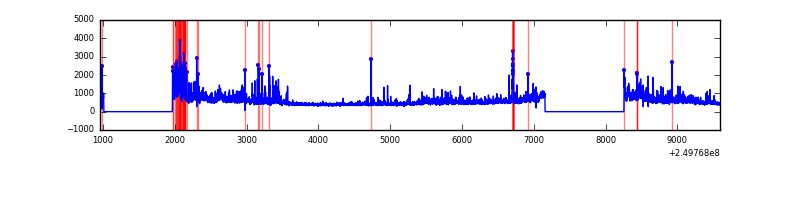 |
| B | 8636 | 6582 | 378 | 378 | 4.38% | 5.74% | 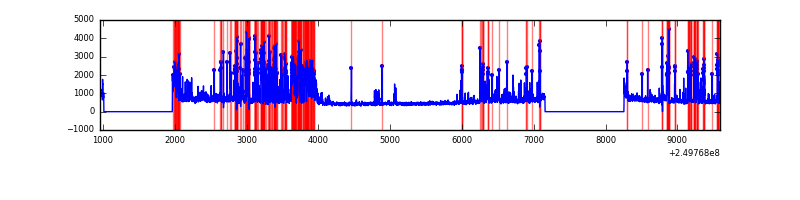 |
| C | 8636 | 6583 | 1 | 1 | 0.01% | 0.02% | 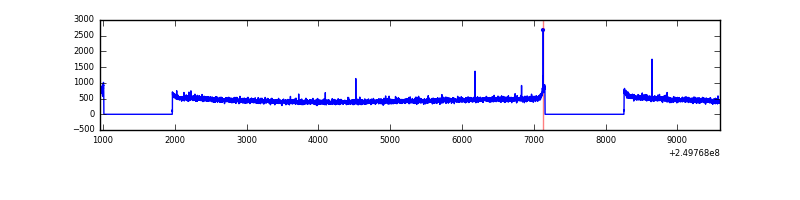 |
| D | 8636 | 6583 | 361 | 361 | 4.18% | 5.48% | 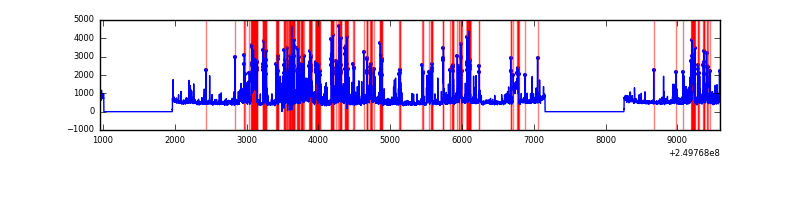 |
Top three noisy pixels from each quadrant. If the there are fewer than three noisy pixels in the level2.evt file, extra rows are filled as -1
| Pixel properties | Quadrant properties | ||||||
|---|---|---|---|---|---|---|---|
| Quadrant | DetID | PixID | Counts | Sigma | Mean | Median | Sigma |
| A | 5 | 16 | 286478 | 1818.97 | 768 | 750 | 157.1 |
| A | 8 | 15 | 252482 | 1602.55 | 768 | 750 | 157.1 |
| A | 1 | 162 | 170970 | 1083.64 | 768 | 750 | 157.1 |
| B | 4 | 239 | 1070425 | 7465.86 | 758 | 738 | 143.3 |
| B | 3 | 64 | 703207 | 4902.87 | 758 | 738 | 143.3 |
| B | 15 | 204 | 298412 | 2077.61 | 758 | 738 | 143.3 |
| C | 13 | 61 | 5712 | 28.27 | 761 | 764 | 175.0 |
| C | 0 | 207 | 5239 | 25.57 | 761 | 764 | 175.0 |
| C | 12 | 4 | 3542 | 15.87 | 761 | 764 | 175.0 |
| D | 1 | 52 | 1569551 | 8870.79 | 732 | 710 | 176.9 |
| D | 5 | 222 | 172441 | 971.03 | 732 | 710 | 176.9 |
| D | 7 | 80 | 129060 | 725.74 | 732 | 710 | 176.9 |
Histogram calculated using DETX and DETY for each event in the final _common_clean file
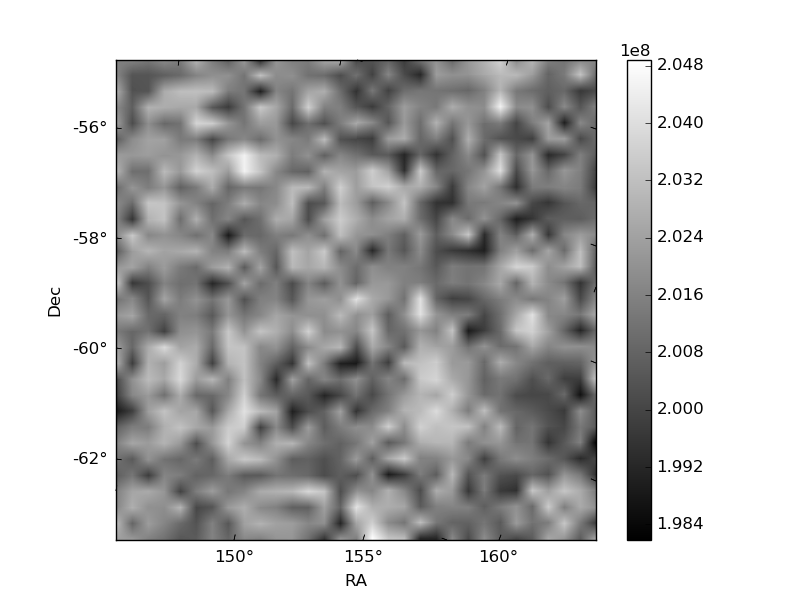
| Quadrant A | 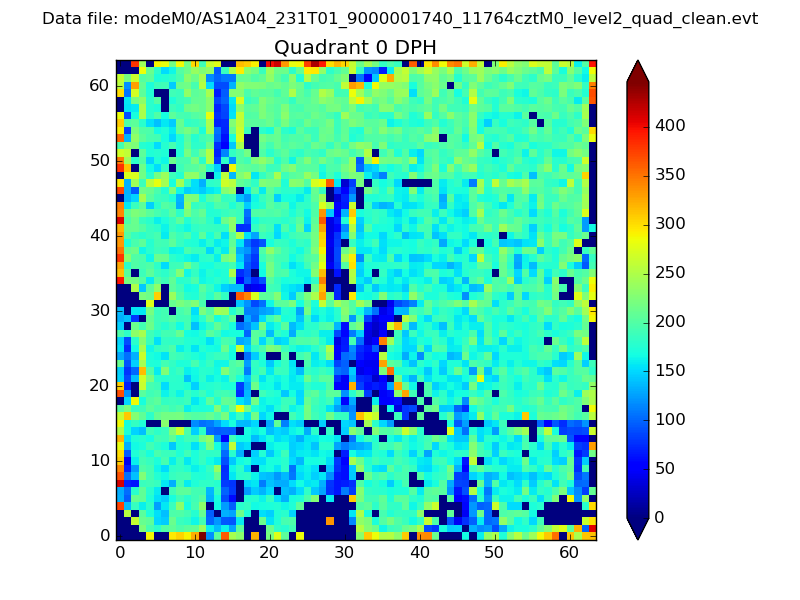 |
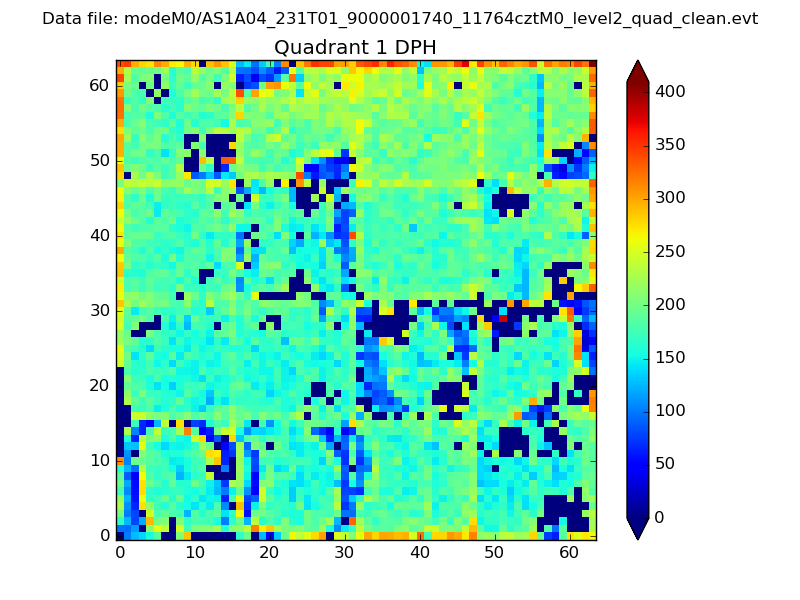 |
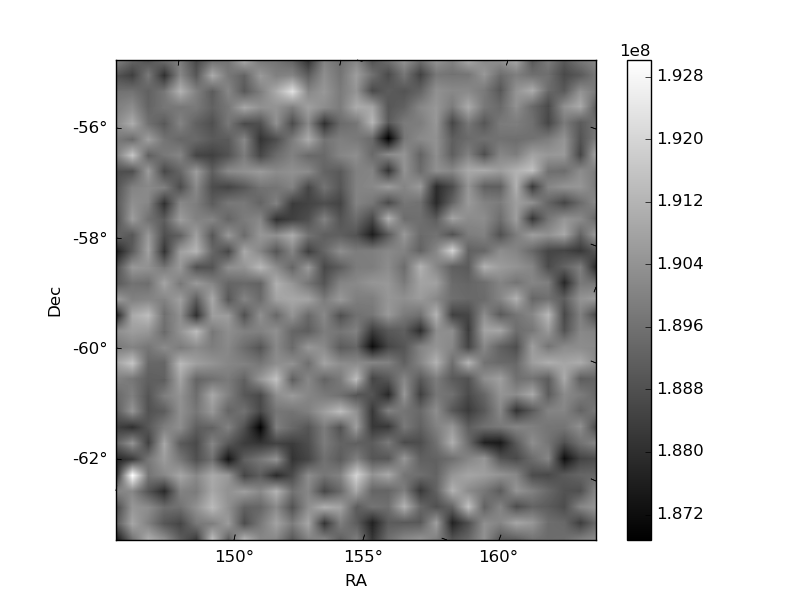
Quadrant B |
|---|---|---|---|
| Quadrant D | 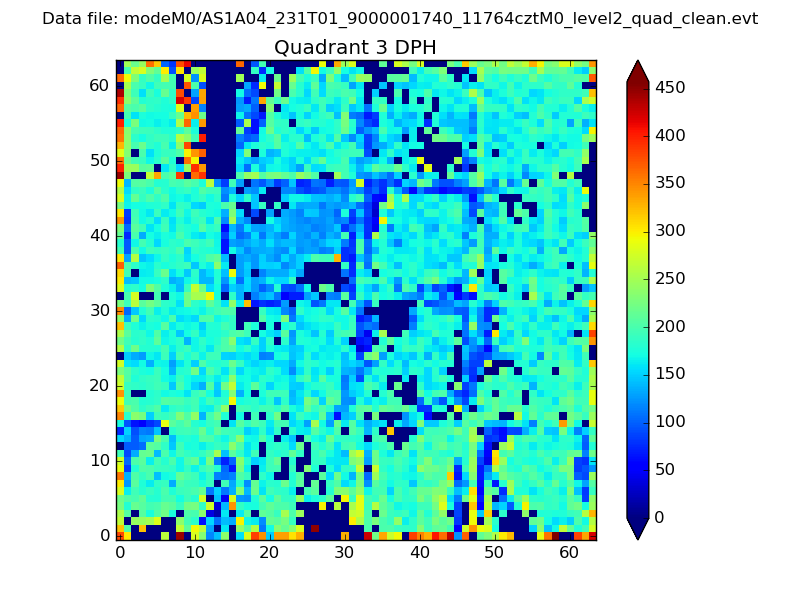 |
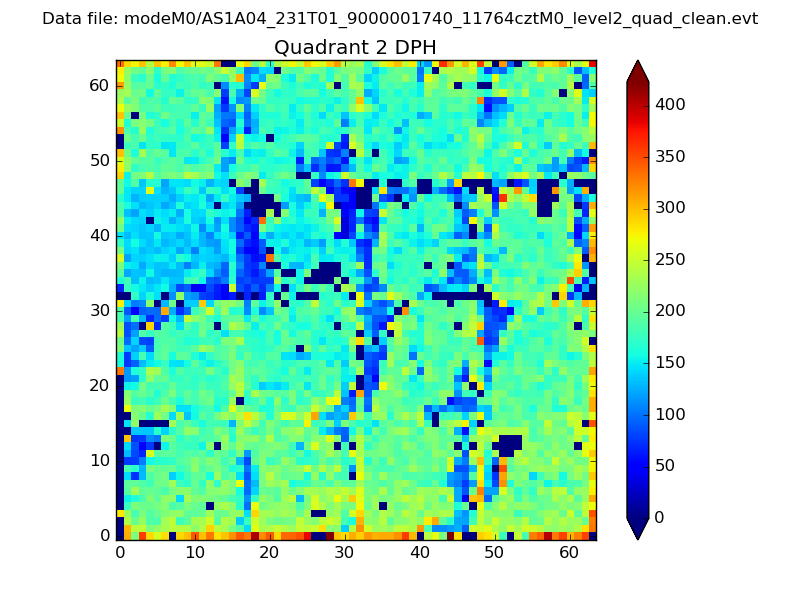 |
Quadrant C |
| Plot type | Count rate plots | Images |
|---|---|---|
| Comparison with Poisson distribution Blue bars denote a histogram of data divided into 1 sec bins. Red curve is a Poisson curve with rate = median count rate of data. |
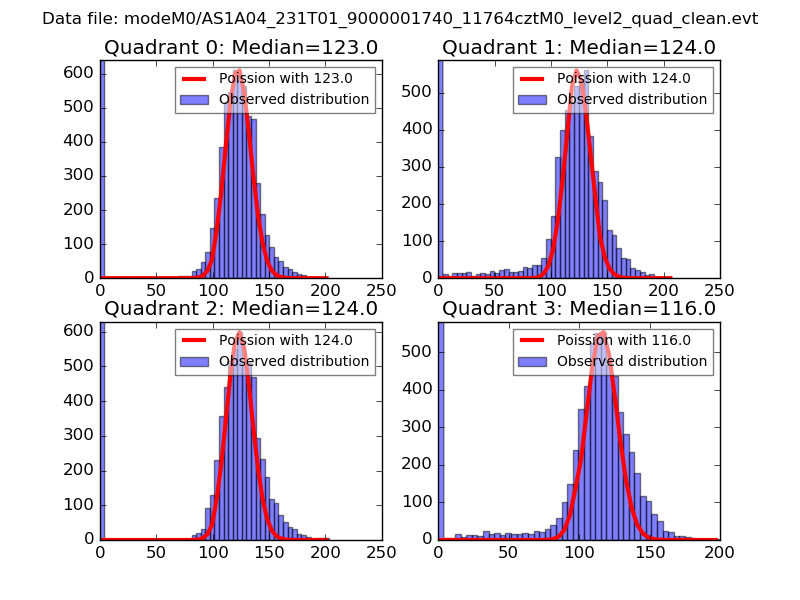 |
 |
| Quadrant-wise count rates Data is divided into 100 sec bins |
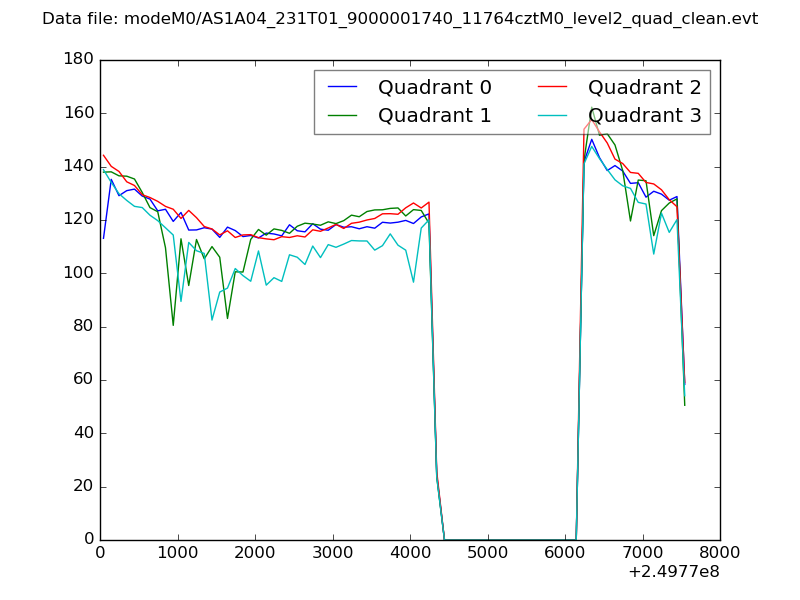 |
|
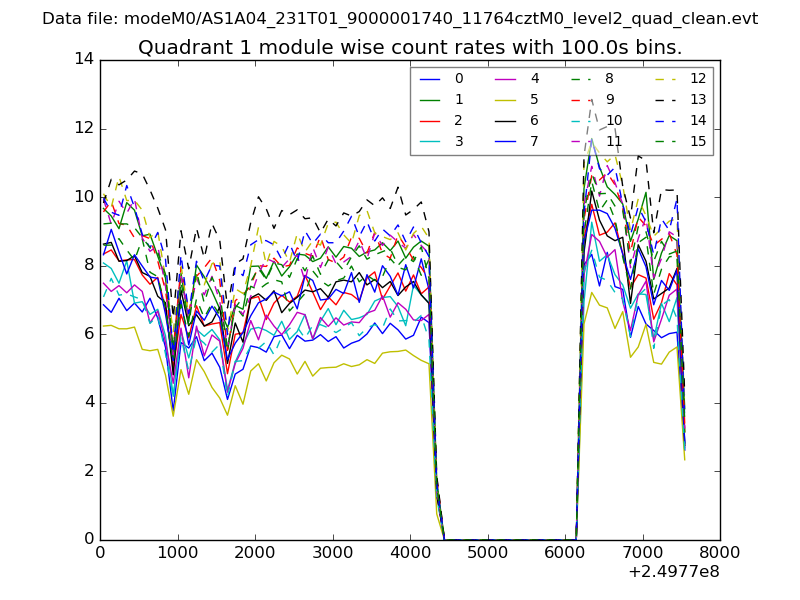
| Module-wise count rates for Quadrant A Data is divided into 100 sec bins |
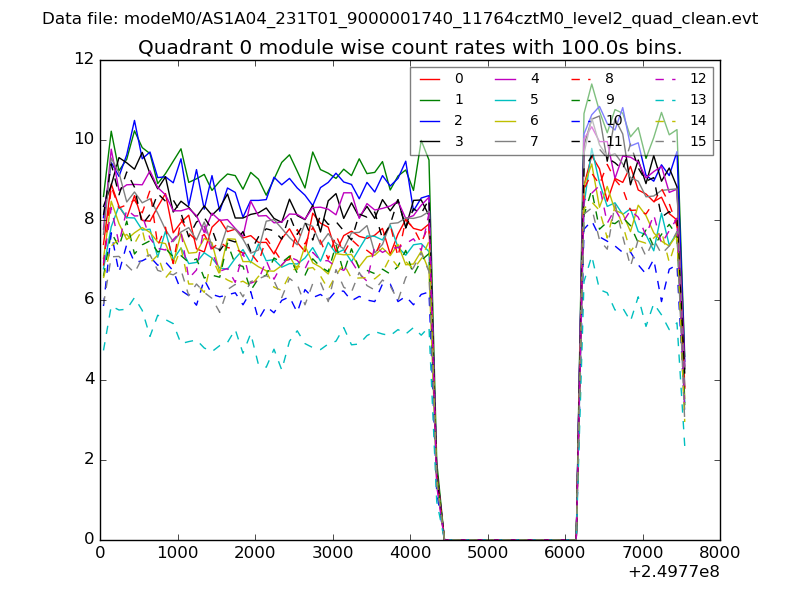 |
 |
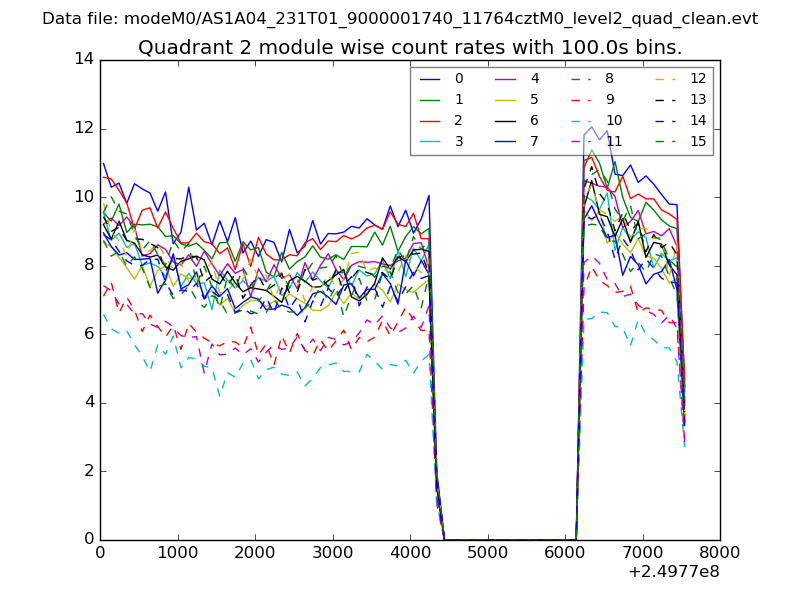
| Module-wise count rates for Quadrant B Data is divided into 100 sec bins |
 |
 |
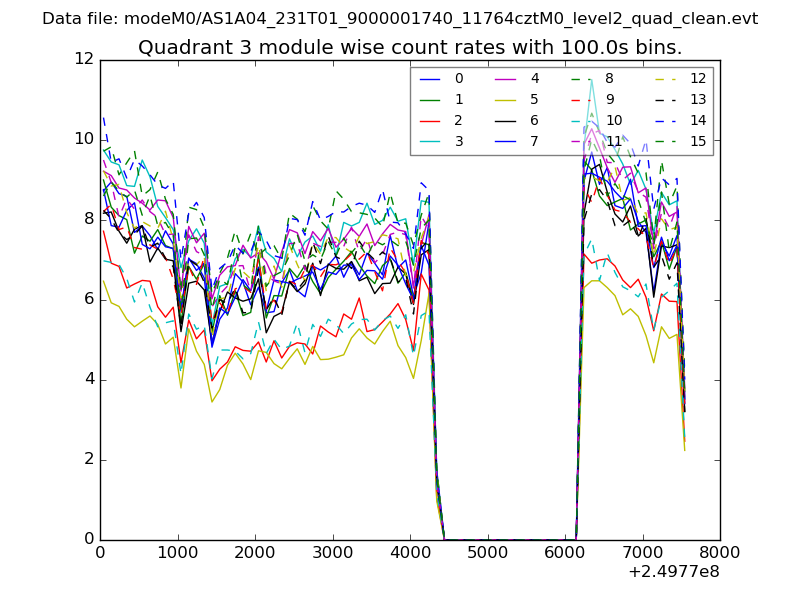
| Module-wise count rates for Quadrant C Data is divided into 100 sec bins |
 |
 |
| Module-wise count rates for Quadrant D Data is divided into 100 sec bins |
 |
 |
| Parameter | Plot |
|---|---|
| CZT HV Monitor | 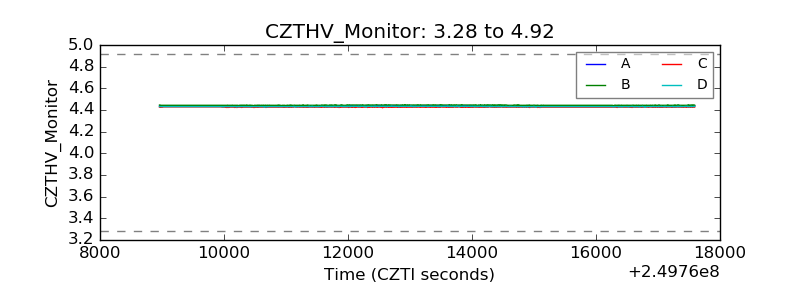 |
| D_VDD |  |
| Temperature 1 | 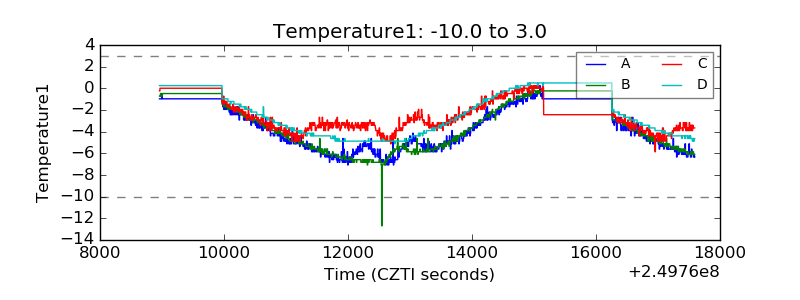 |
| Veto HV Monitor | 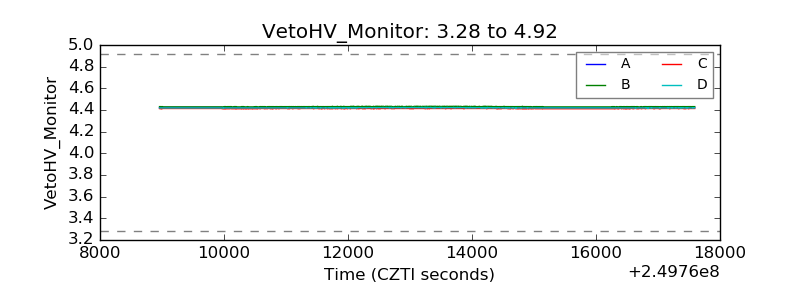 |
| Veto LLD | 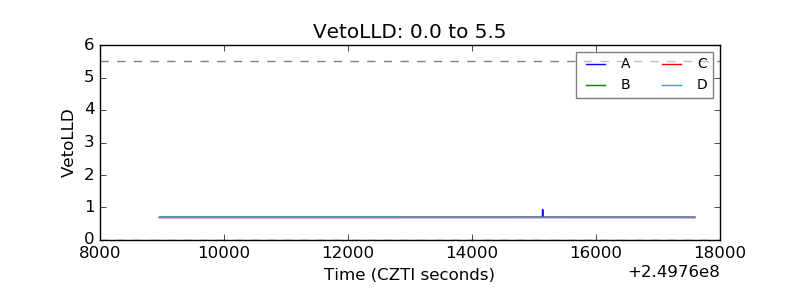 |
| Alpha Counter | 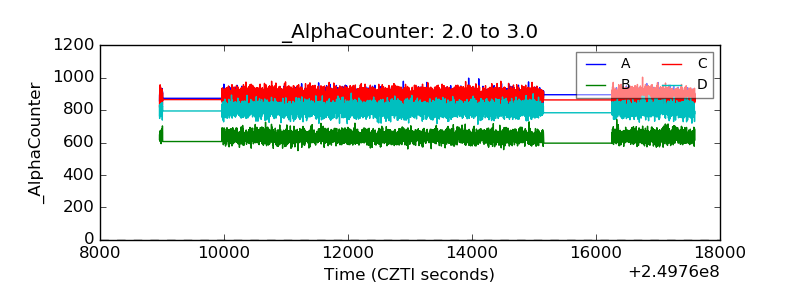 |
| _CPM_Rate | 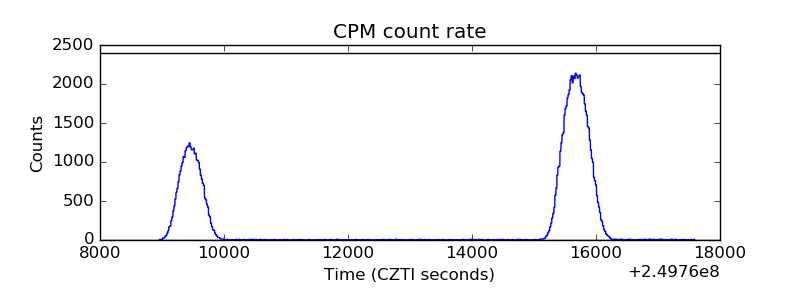 |
| CZT Counter | 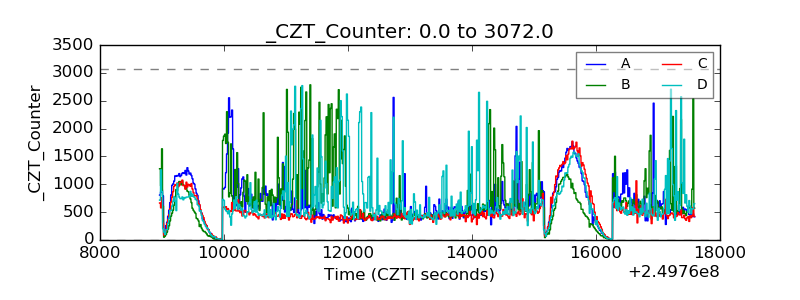 |
| +2.5 Volts monitor |  |
| +5 Volts monitor |  |
| _ROLL_ROT | 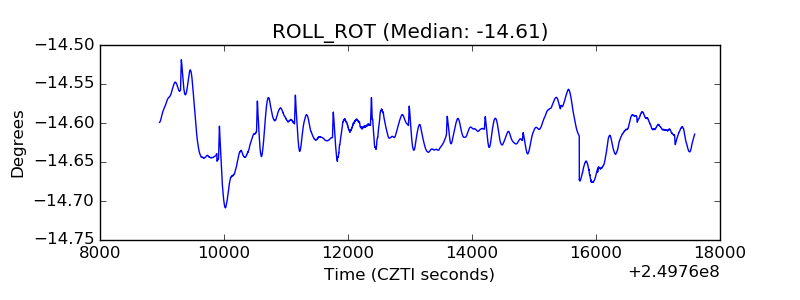 |
| _Roll_DEC | 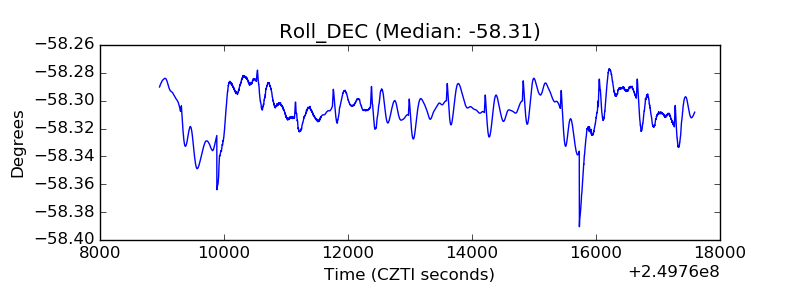 |
| _Roll_RA |  |
| Veto Counter | 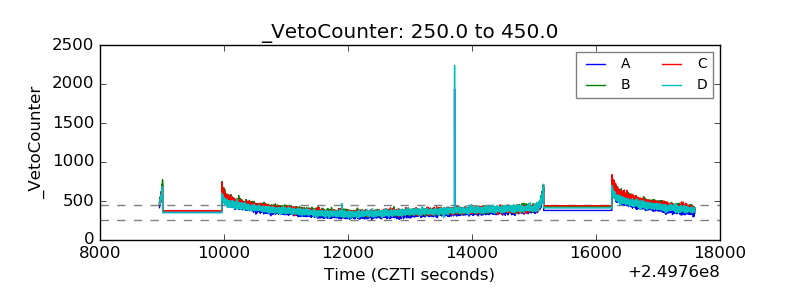 |