| Param | Original file | Final file |
|---|---|---|
| Filename | modeM0/AS1A04_231T01_9000001740_11766cztM0_level2.evt | modeM0/AS1A04_231T01_9000001740_11766cztM0_level2_quad_clean.evt |
| Size (bytes) | 608,184,000 | 106,021,440 |
| Size | 580.0 MB | 101.1 MB |
| Events in quadrant A | 3,760,161 | 693,686 |
| Events in quadrant B | 4,413,355 | 708,114 |
| Events in quadrant C | 3,055,366 | 722,717 |
| Events in quadrant D | 6,754,317 | 636,659 |
| Mode SS | |||
|---|---|---|---|
| Quadrant | BADHDUFLAG | Total packets | Discarded packets |
| A | 0 | 132 | 0 |
| B | 0 | 132 | 0 |
| C | 0 | 132 | 0 |
| D | 0 | 132 | 0 |
| Mode M9 | |||
|---|---|---|---|
| Quadrant | BADHDUFLAG | Total packets | Discarded packets |
| A | 0 | 16 | 0 |
| B | 0 | 16 | 0 |
| C | 0 | 16 | 0 |
| D | 0 | 17 | 0 |
| Mode M0 | |||
|---|---|---|---|
| Quadrant | BADHDUFLAG | Total packets | Discarded packets |
| A | 0 | 15429 | 3 |
| B | 0 | 17506 | 2 |
| C | 0 | 13204 | 2 |
| D | 0 | 24352 | 2 |
| Quadrant | Total seconds | Saturated seconds | Saturation percentage |
|---|---|---|---|
| A | 6440 | 63 | 0.978261% |
| B | 6440 | 329 | 5.108696% |
| C | 6440 | 5 | 0.077640% |
| D | 6440 | 435 | 6.754658% |
Noise dominated data is calculated using 1-second bins in cleaned event files. If a bin has >2000 counts, and if more than 50% of those come from <1% of pixels, then it is considered to be noise-dominated and hence unusable.
| Quadrant | # 1 sec bins | Bins with >0 counts | Bins with >2000 counts | High rate bins dominated by noise | Noise dominated (total time) | Noise dominated (detector-on time) | Marked lightcurve |
|---|---|---|---|---|---|---|---|
| A | 7796 | 6442 | 5 | 5 | 0.06% | 0.08% | 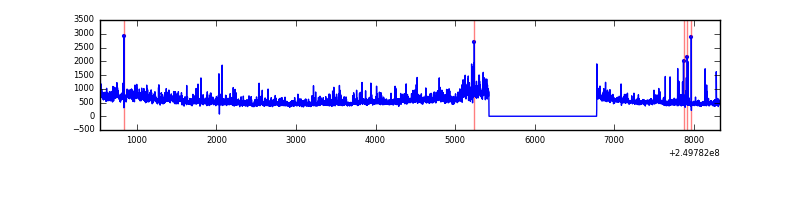 |
| B | 7796 | 6442 | 213 | 213 | 2.73% | 3.31% | 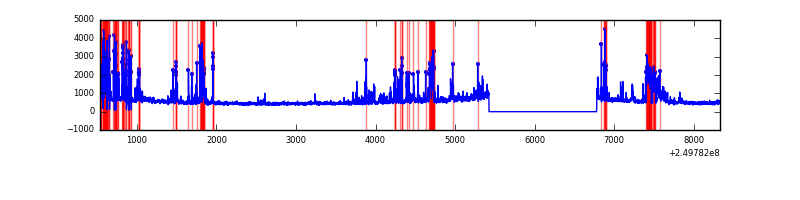 |
| C | 7796 | 6442 | 0 | 0 | 0.00% | 0.00% | 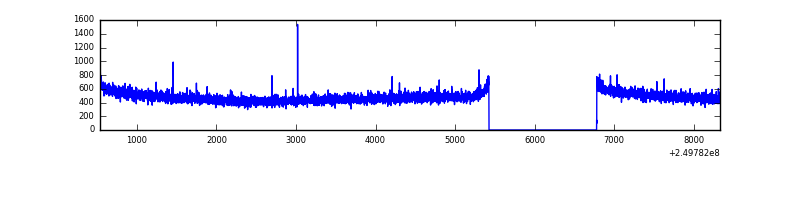 |
| D | 7796 | 6442 | 555 | 555 | 7.12% | 8.62% | 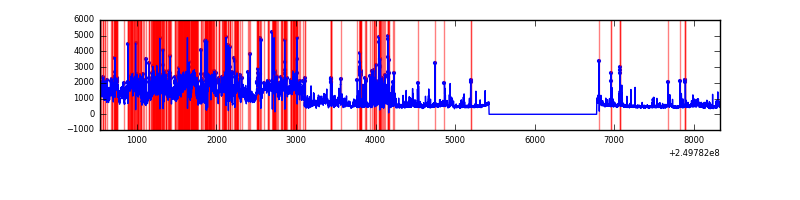 |
Top three noisy pixels from each quadrant. If the there are fewer than three noisy pixels in the level2.evt file, extra rows are filled as -1
| Pixel properties | Quadrant properties | ||||||
|---|---|---|---|---|---|---|---|
| Quadrant | DetID | PixID | Counts | Sigma | Mean | Median | Sigma |
| A | 8 | 15 | 398415 | 2562.21 | 773 | 760 | 155.2 |
| A | 1 | 162 | 112011 | 716.82 | 773 | 760 | 155.2 |
| A | 13 | 251 | 67531 | 430.23 | 773 | 760 | 155.2 |
| B | 4 | 239 | 730206 | 5055.65 | 777 | 758 | 144.3 |
| B | 10 | 16 | 240929 | 1664.57 | 777 | 758 | 144.3 |
| B | 15 | 204 | 169394 | 1168.78 | 777 | 758 | 144.3 |
| C | 13 | 61 | 5928 | 28.66 | 782 | 787 | 179.4 |
| C | 12 | 4 | 2728 | 10.82 | 782 | 787 | 179.4 |
| C | 3 | 202 | 2000 | 6.76 | 782 | 787 | 179.4 |
| D | 13 | 137 | 3053833 | 17120.8 | 746 | 724 | 178.3 |
| D | 1 | 52 | 362110 | 2026.53 | 746 | 724 | 178.3 |
| D | 8 | 195 | 150249 | 838.48 | 746 | 724 | 178.3 |
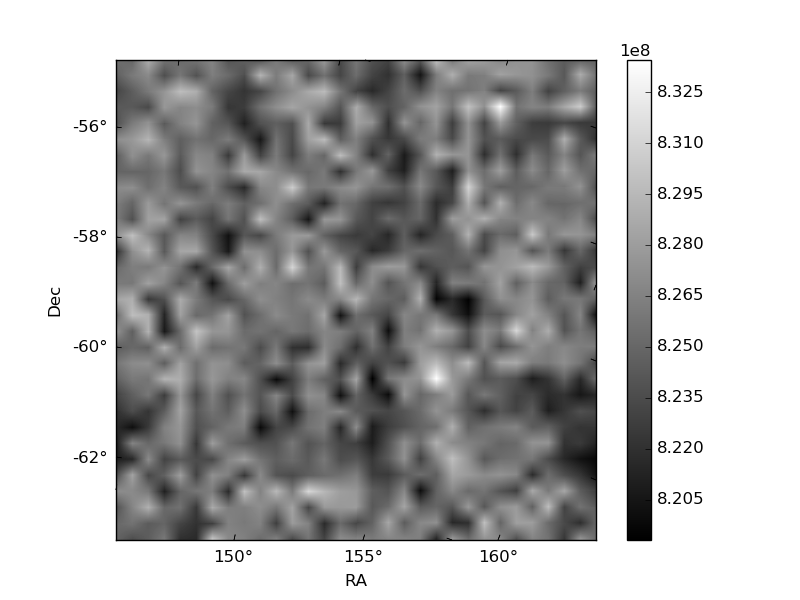
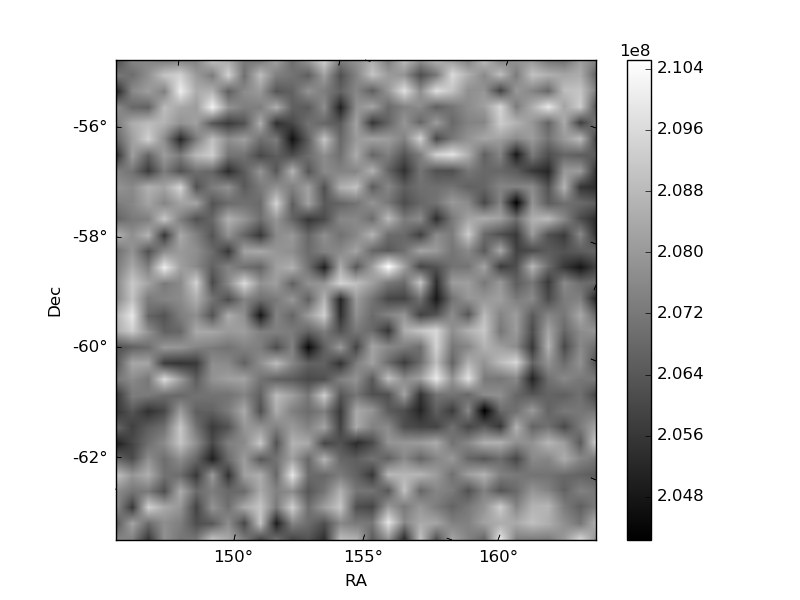
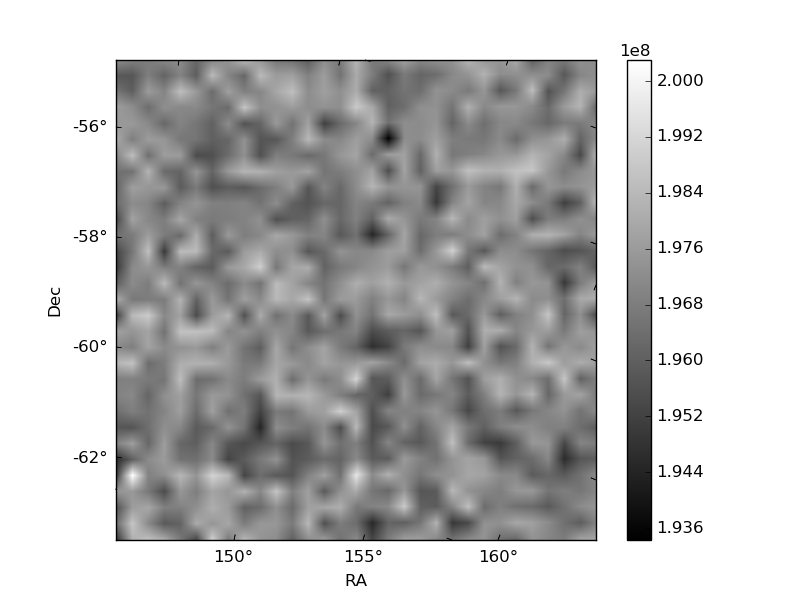
Histogram calculated using DETX and DETY for each event in the final _common_clean file
| Quadrant A | 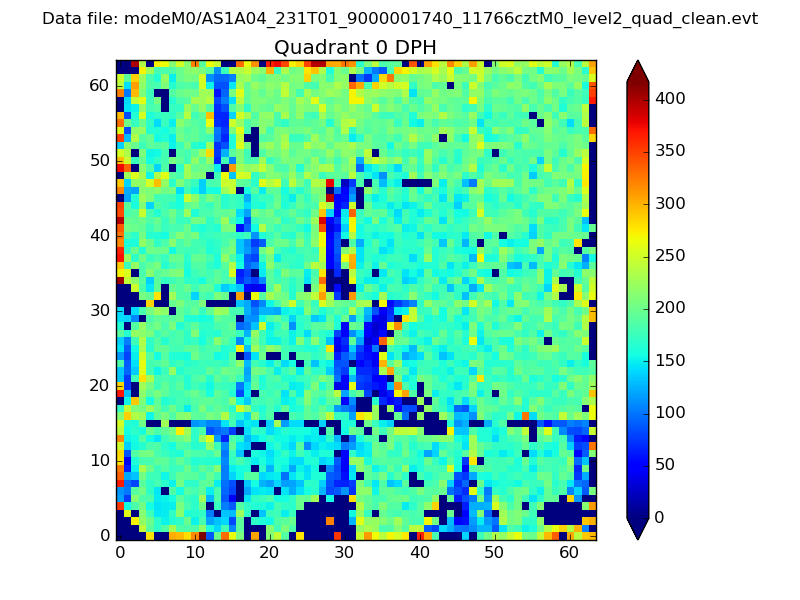 |
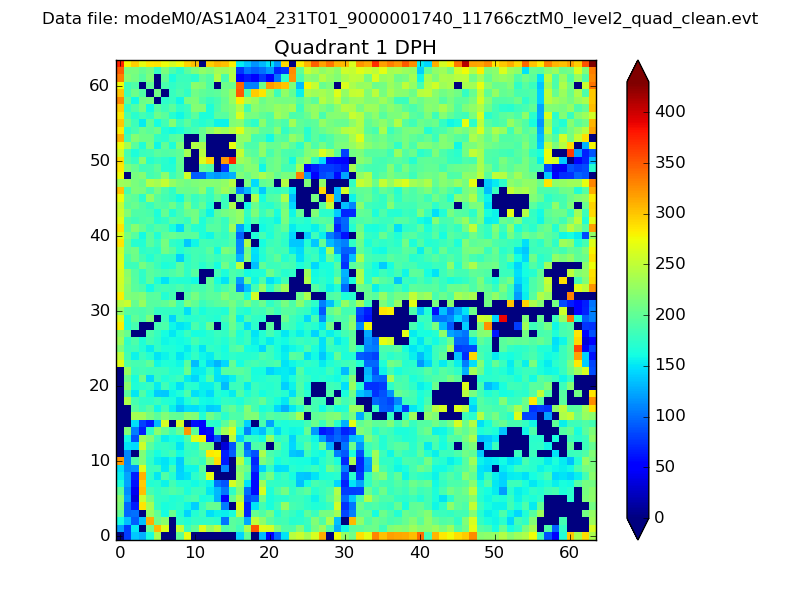 |
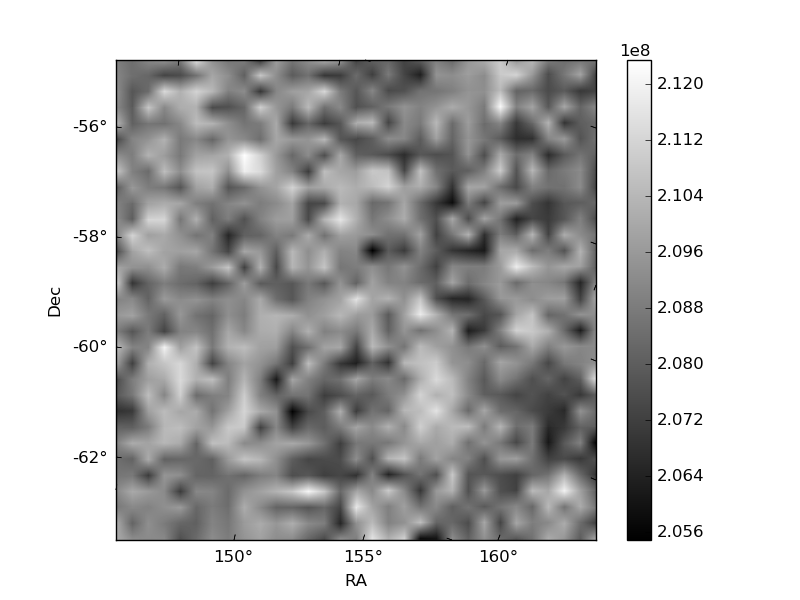
Quadrant B |
|---|---|---|---|
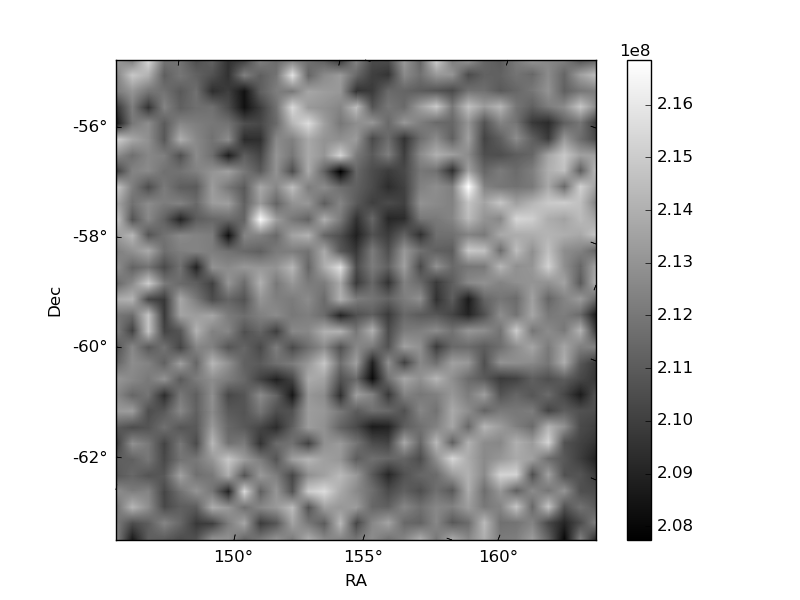
| Quadrant D | 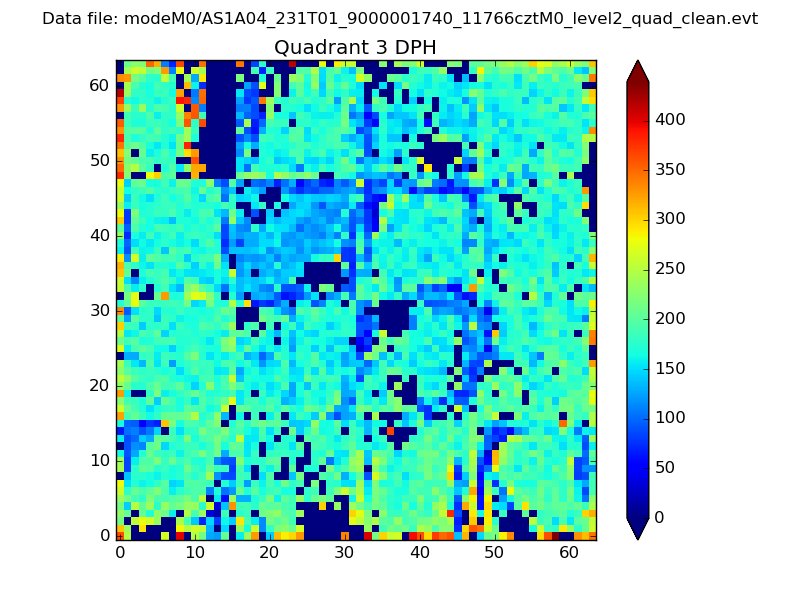 |
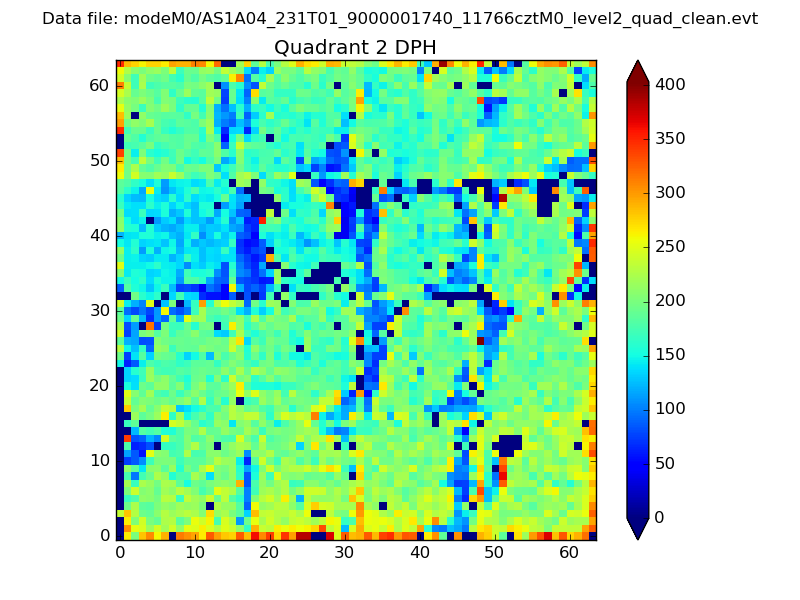 |
Quadrant C |
| Plot type | Count rate plots | Images |
|---|---|---|
| Comparison with Poisson distribution Blue bars denote a histogram of data divided into 1 sec bins. Red curve is a Poisson curve with rate = median count rate of data. |
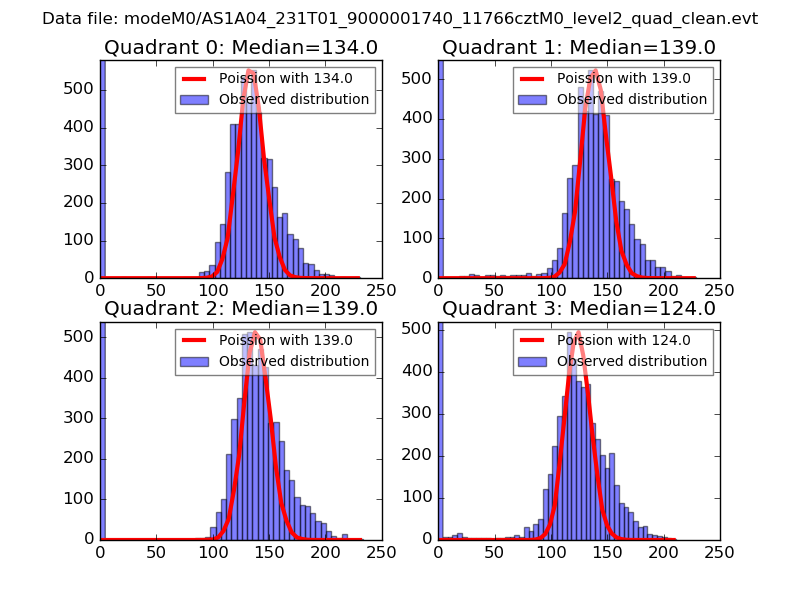 |
 |
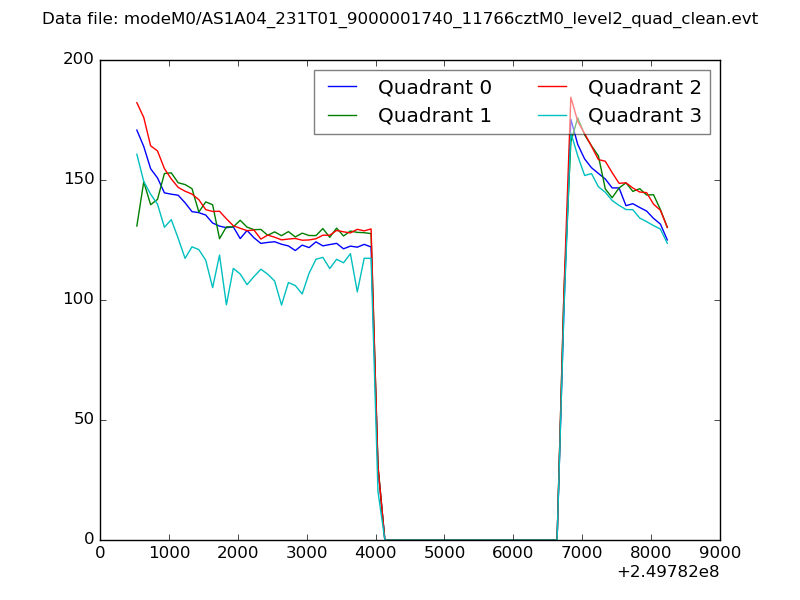
| Quadrant-wise count rates Data is divided into 100 sec bins |
 |
|
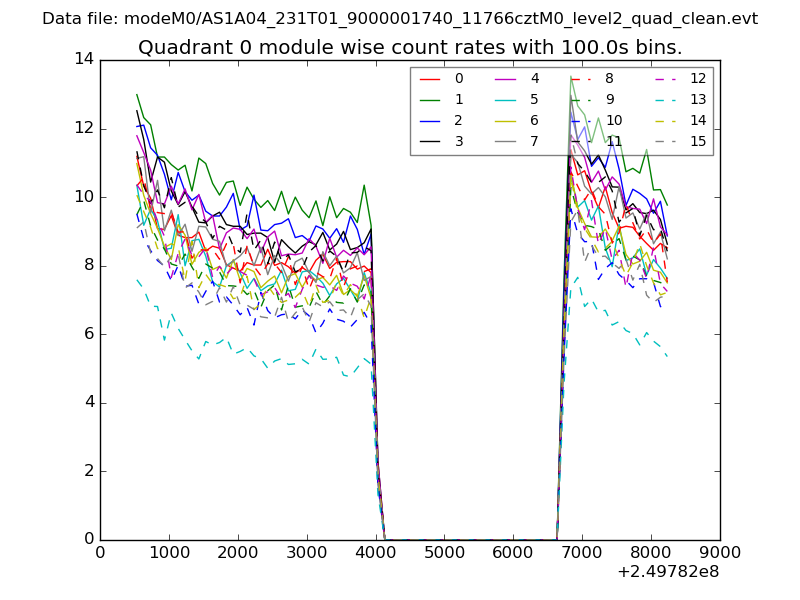
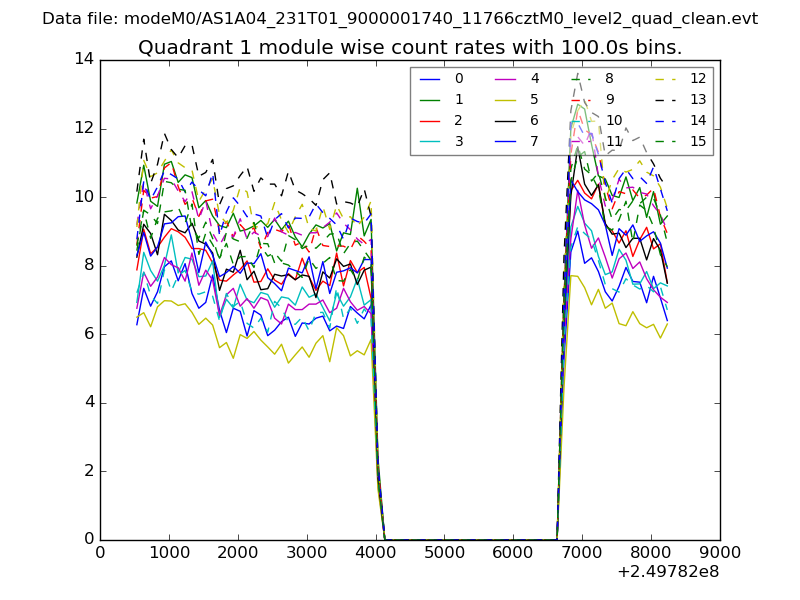
| Module-wise count rates for Quadrant A Data is divided into 100 sec bins |
 |
 |
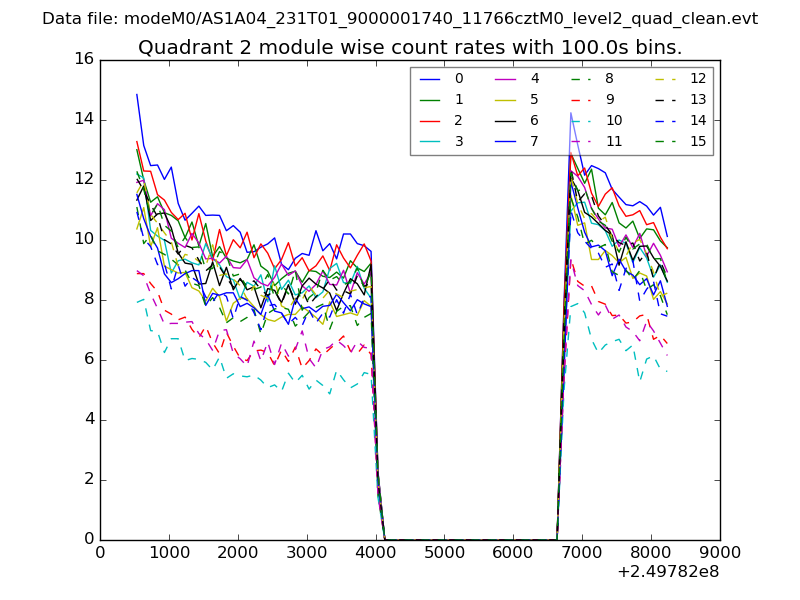
| Module-wise count rates for Quadrant B Data is divided into 100 sec bins |
 |
 |
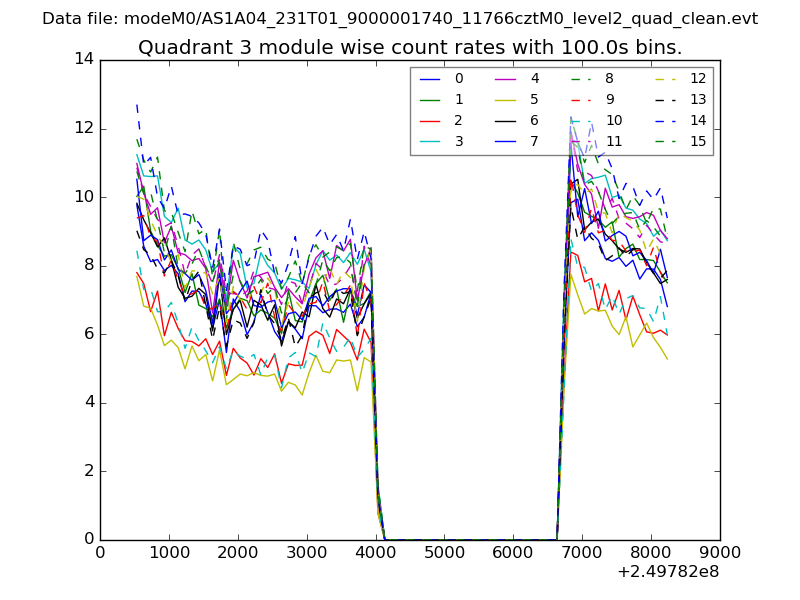
| Module-wise count rates for Quadrant C Data is divided into 100 sec bins |
 |
 |
| Module-wise count rates for Quadrant D Data is divided into 100 sec bins |
 |
 |
| Parameter | Plot |
|---|---|
| CZT HV Monitor | 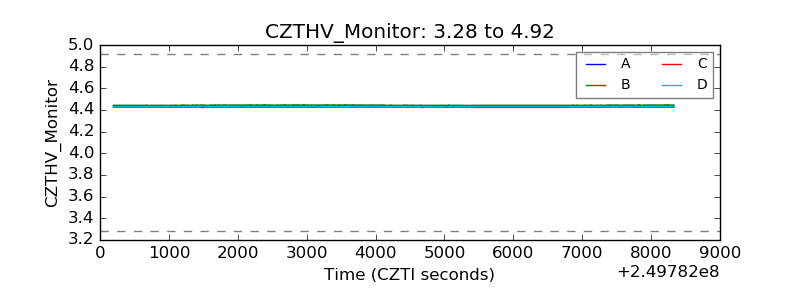 |
| D_VDD | 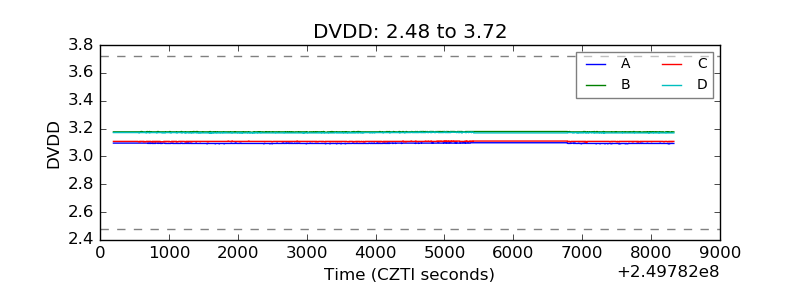 |
| Temperature 1 | 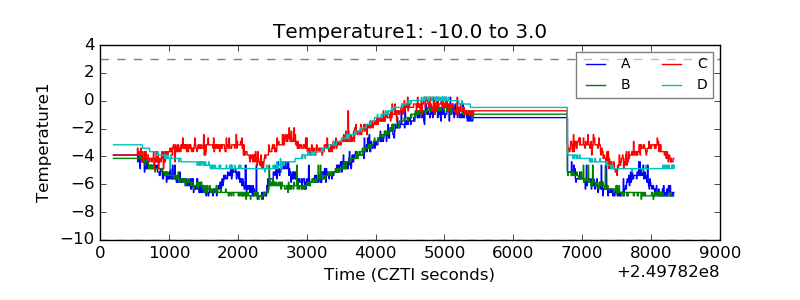 |
| Veto HV Monitor | 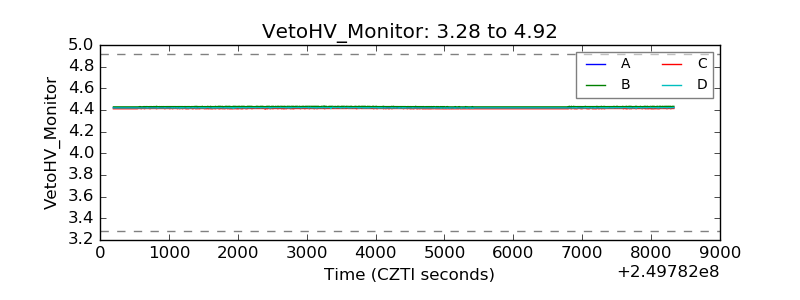 |
| Veto LLD | 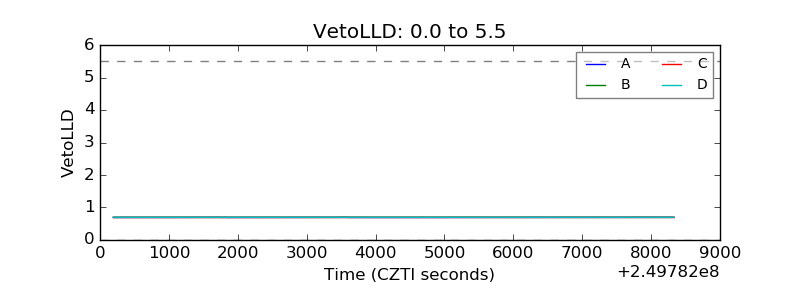 |
| Alpha Counter | 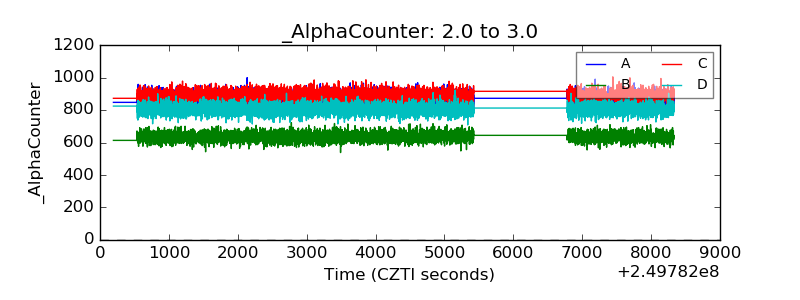 |
| _CPM_Rate | 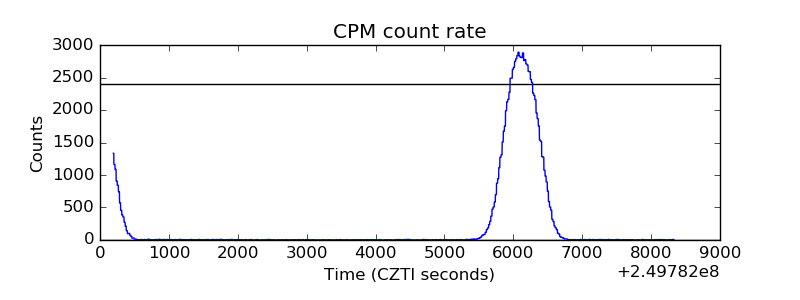 |
| CZT Counter | 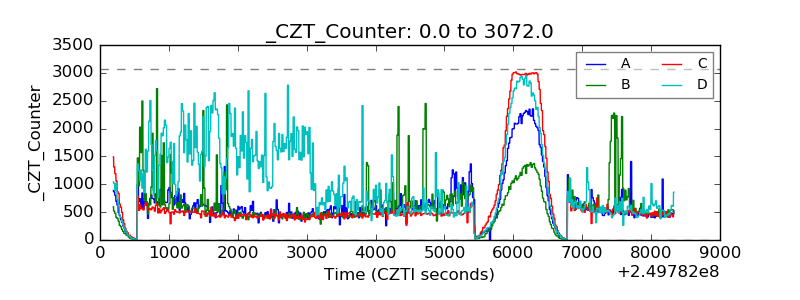 |
| +2.5 Volts monitor |  |
| +5 Volts monitor |  |
| _ROLL_ROT | 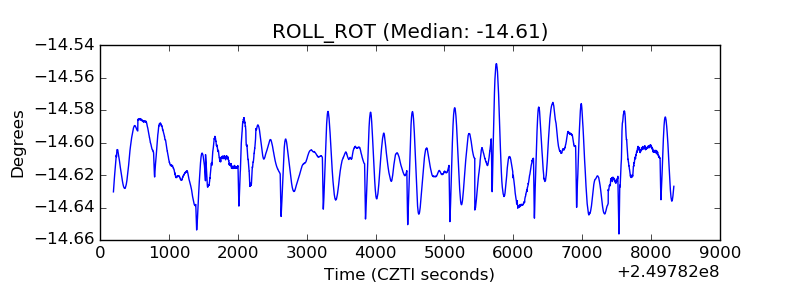 |
| _Roll_DEC | 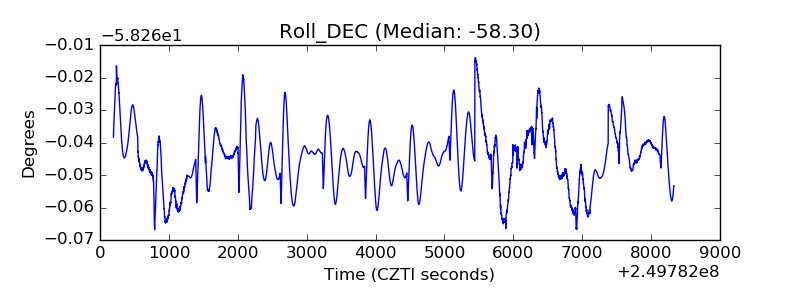 |
| _Roll_RA | 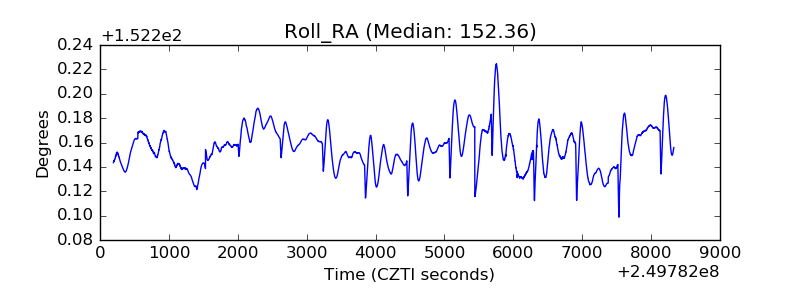 |
| Veto Counter | 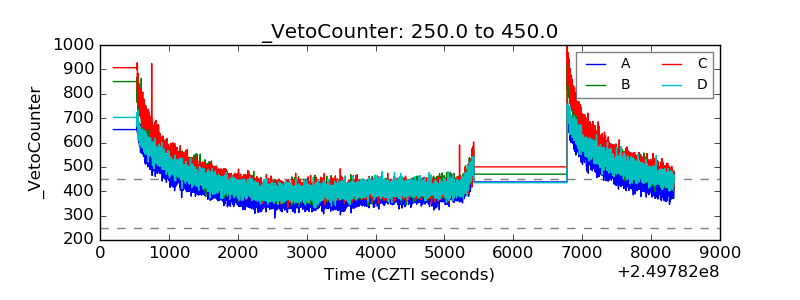 |