| Param | Original file | Final file |
|---|---|---|
| Filename | modeM0/AS1A04_231T01_9000001740_11768cztM0_level2.evt | modeM0/AS1A04_231T01_9000001740_11768cztM0_level2_quad_clean.evt |
| Size (bytes) | 526,176,000 | 102,098,880 |
| Size | 501.8 MB | 97.4 MB |
| Events in quadrant A | 3,755,757 | 656,506 |
| Events in quadrant B | 4,183,589 | 678,196 |
| Events in quadrant C | 3,032,445 | 686,217 |
| Events in quadrant D | 4,536,474 | 631,558 |
| Mode SS | |||
|---|---|---|---|
| Quadrant | BADHDUFLAG | Total packets | Discarded packets |
| A | 0 | 130 | 0 |
| B | 0 | 130 | 0 |
| C | 0 | 130 | 0 |
| D | 0 | 130 | 0 |
| Mode M9 | |||
|---|---|---|---|
| Quadrant | BADHDUFLAG | Total packets | Discarded packets |
| A | 0 | 16 | 0 |
| B | 0 | 16 | 0 |
| C | 0 | 16 | 0 |
| D | 0 | 17 | 0 |
| Mode M0 | |||
|---|---|---|---|
| Quadrant | BADHDUFLAG | Total packets | Discarded packets |
| A | 0 | 15134 | 3 |
| B | 0 | 16570 | 2 |
| C | 0 | 12994 | 2 |
| D | 0 | 17634 | 2 |
| Quadrant | Total seconds | Saturated seconds | Saturation percentage |
|---|---|---|---|
| A | 6293 | 89 | 1.414270% |
| B | 6293 | 223 | 3.543620% |
| C | 6293 | 11 | 0.174797% |
| D | 6293 | 320 | 5.085015% |
Noise dominated data is calculated using 1-second bins in cleaned event files. If a bin has >2000 counts, and if more than 50% of those come from <1% of pixels, then it is considered to be noise-dominated and hence unusable.
| Quadrant | # 1 sec bins | Bins with >0 counts | Bins with >2000 counts | High rate bins dominated by noise | Noise dominated (total time) | Noise dominated (detector-on time) | Marked lightcurve |
|---|---|---|---|---|---|---|---|
| A | 7604 | 6295 | 2 | 2 | 0.03% | 0.03% | 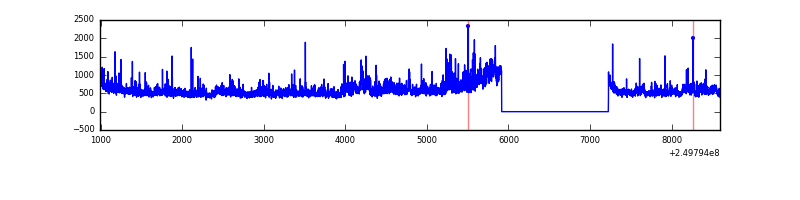 |
| B | 7604 | 6295 | 81 | 81 | 1.07% | 1.29% | 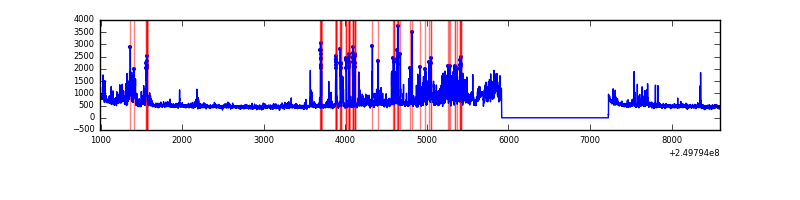 |
| C | 7604 | 6295 | 0 | 0 | 0.00% | 0.00% |  |
| D | 7604 | 6295 | 284 | 284 | 3.73% | 4.51% | 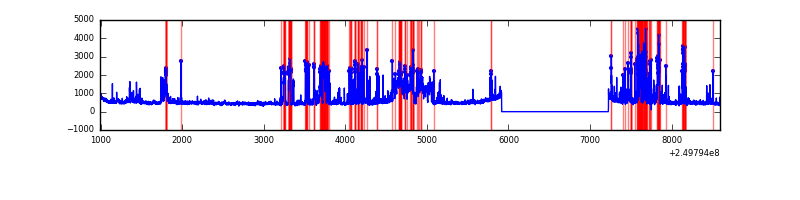 |
Top three noisy pixels from each quadrant. If the there are fewer than three noisy pixels in the level2.evt file, extra rows are filled as -1
| Pixel properties | Quadrant properties | ||||||
|---|---|---|---|---|---|---|---|
| Quadrant | DetID | PixID | Counts | Sigma | Mean | Median | Sigma |
| A | 8 | 15 | 512546 | 3301.39 | 763 | 746 | 155.0 |
| A | 1 | 162 | 115668 | 741.31 | 763 | 746 | 155.0 |
| A | 1 | 178 | 64449 | 410.92 | 763 | 746 | 155.0 |
| B | 4 | 239 | 414252 | 2888.88 | 770 | 752 | 143.1 |
| B | 15 | 204 | 378674 | 2640.32 | 770 | 752 | 143.1 |
| B | 10 | 16 | 246461 | 1716.62 | 770 | 752 | 143.1 |
| C | 13 | 61 | 5701 | 27.8 | 775 | 781 | 177.0 |
| C | 14 | 234 | 4539 | 21.24 | 775 | 781 | 177.0 |
| C | 12 | 4 | 3662 | 16.28 | 775 | 781 | 177.0 |
| D | 1 | 52 | 1423191 | 7991.74 | 751 | 731 | 178.0 |
| D | 13 | 104 | 93838 | 523.1 | 751 | 731 | 178.0 |
| D | 10 | 199 | 56409 | 312.81 | 751 | 731 | 178.0 |
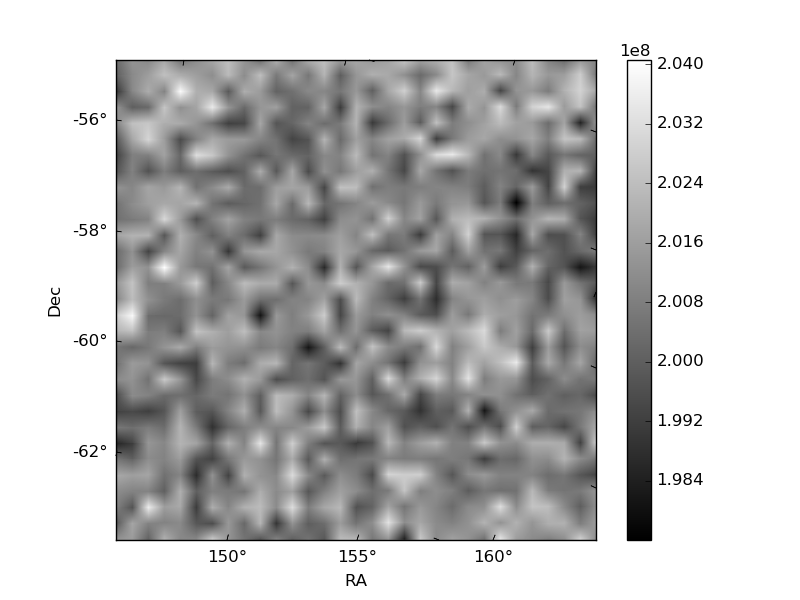
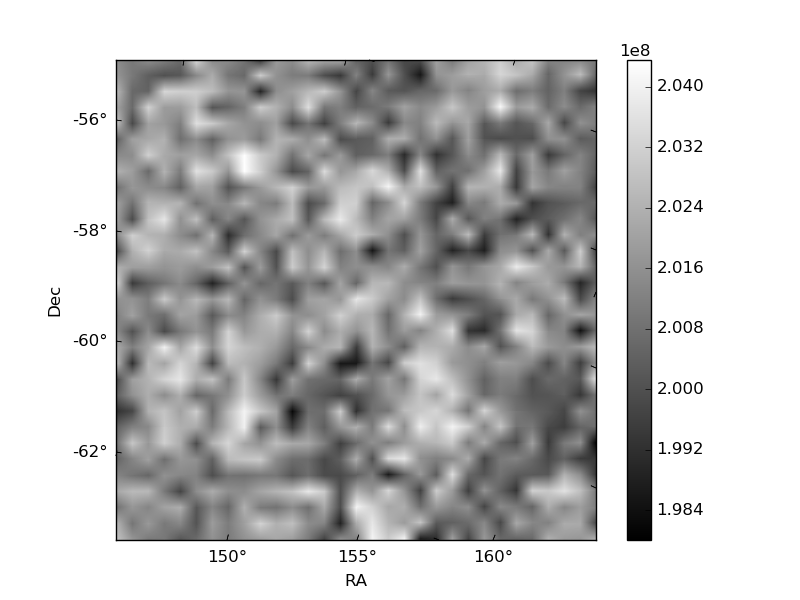
Histogram calculated using DETX and DETY for each event in the final _common_clean file
| Quadrant A | 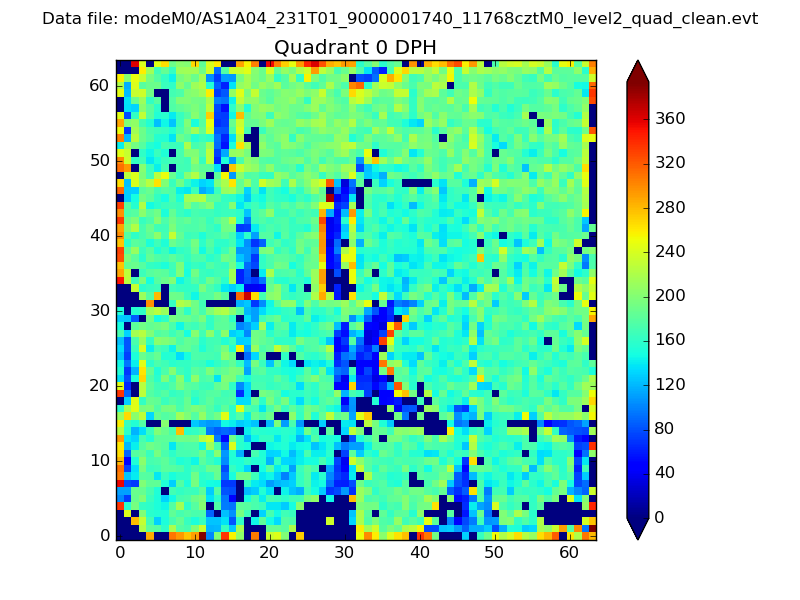 |
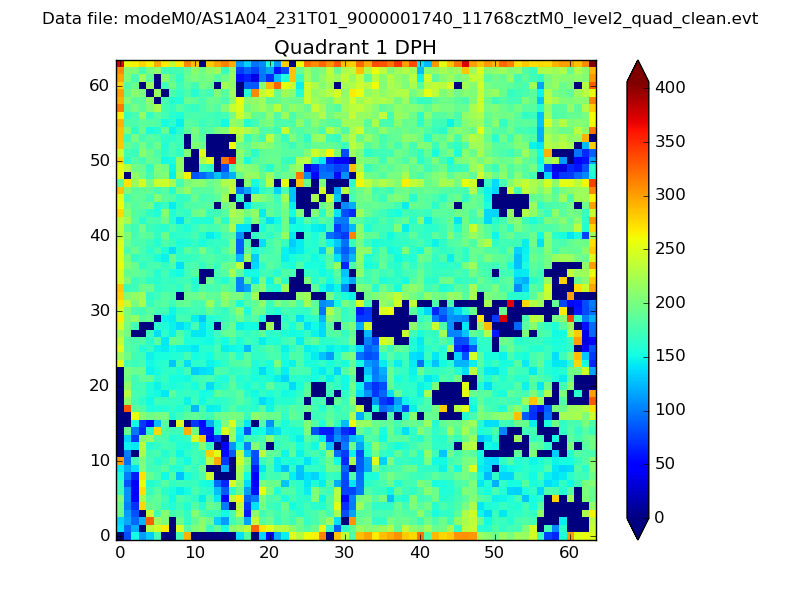 |
Quadrant B |
|---|---|---|---|
| Quadrant D |  |
 |
Quadrant C |
| Plot type | Count rate plots | Images |
|---|---|---|
| Comparison with Poisson distribution Blue bars denote a histogram of data divided into 1 sec bins. Red curve is a Poisson curve with rate = median count rate of data. |
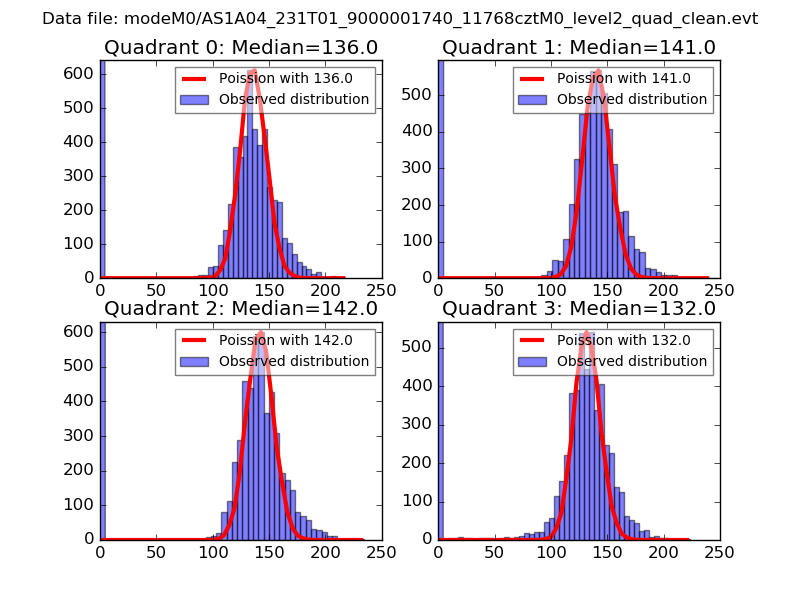 |
 |
| Quadrant-wise count rates Data is divided into 100 sec bins |
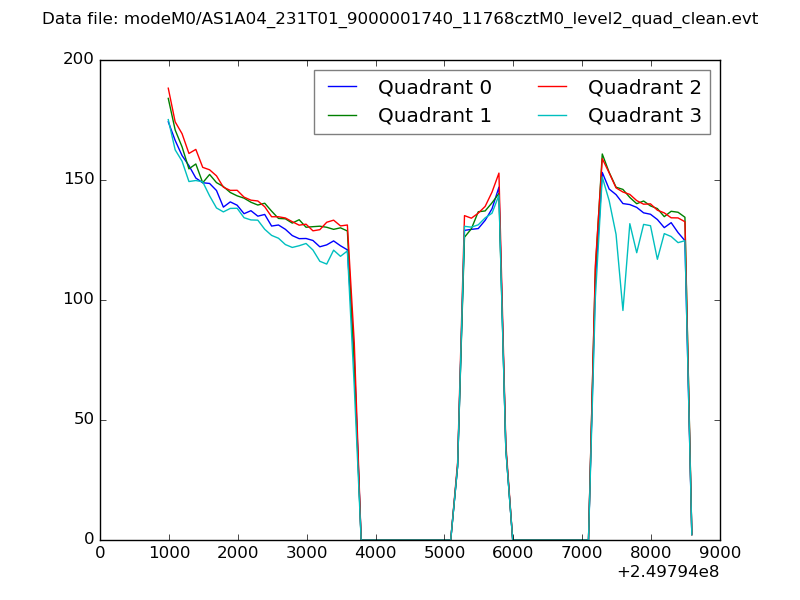 |
|
| Module-wise count rates for Quadrant A Data is divided into 100 sec bins |
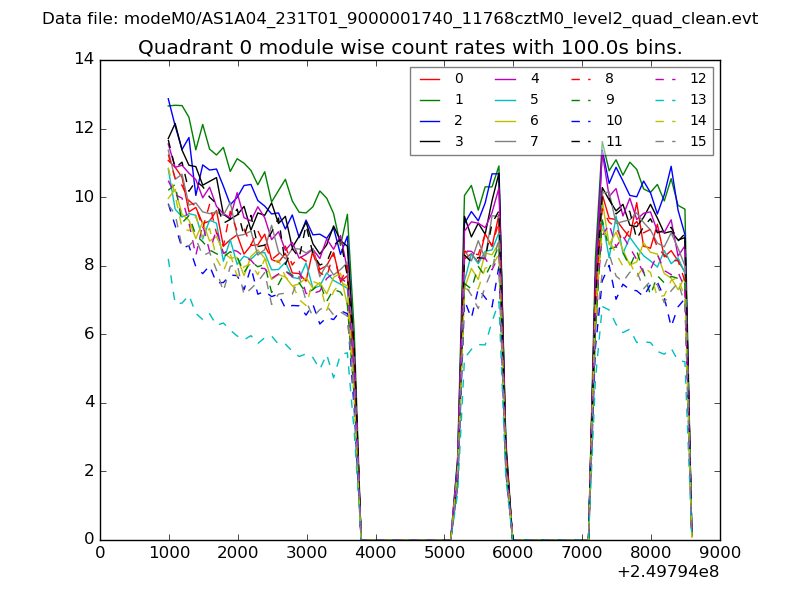 |
 |
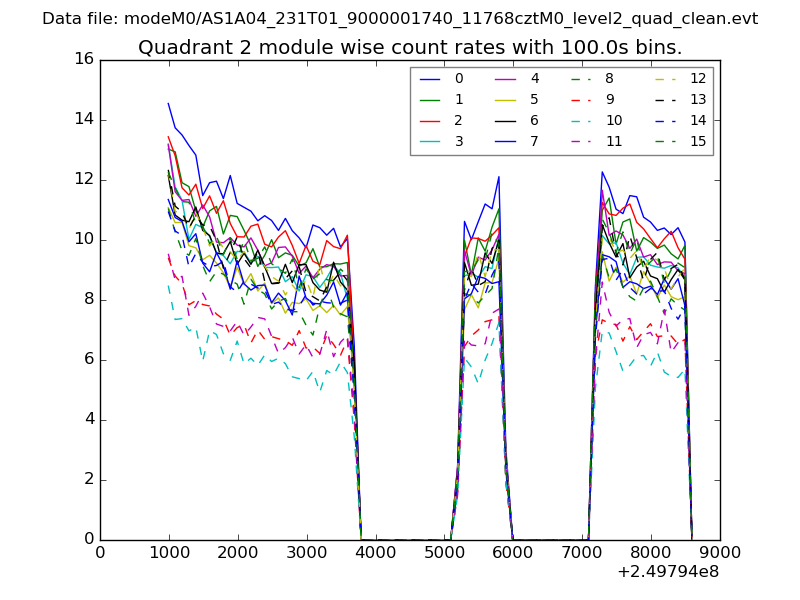
| Module-wise count rates for Quadrant B Data is divided into 100 sec bins |
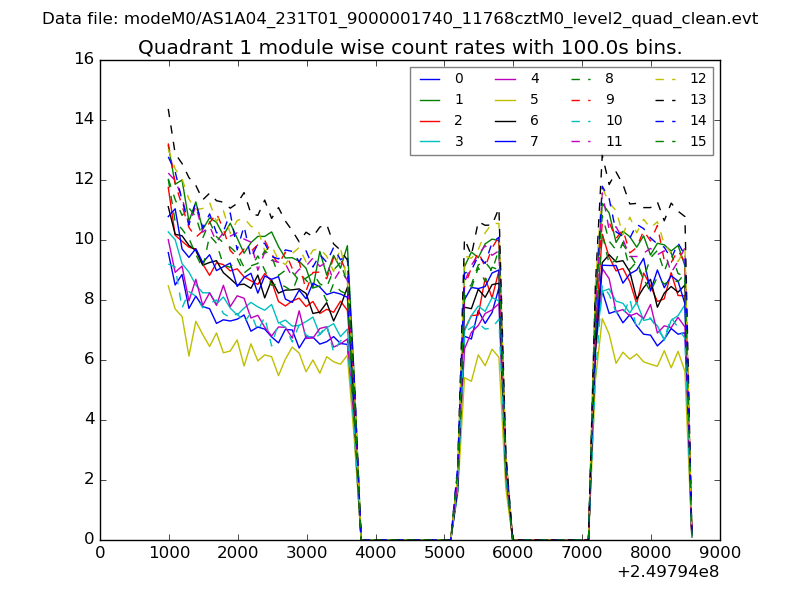 |
 |
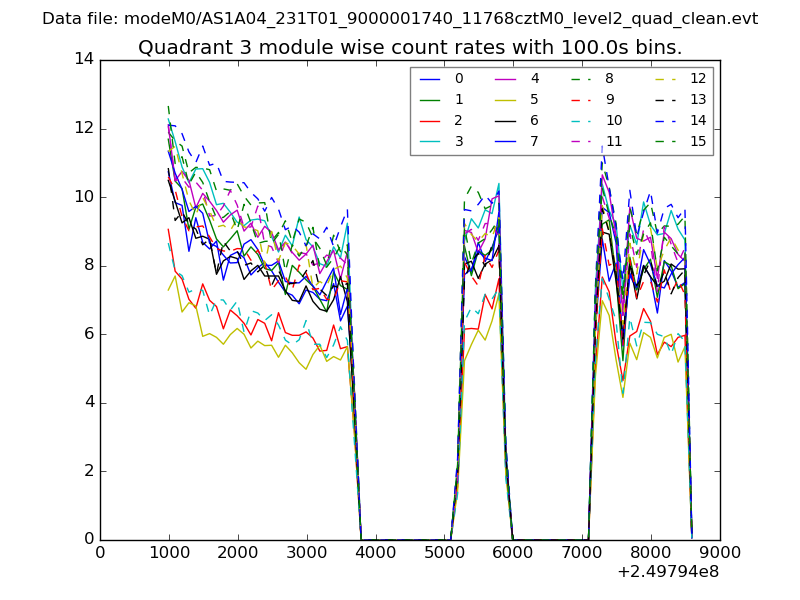
| Module-wise count rates for Quadrant C Data is divided into 100 sec bins |
 |
 |
| Module-wise count rates for Quadrant D Data is divided into 100 sec bins |
 |
 |
| Parameter | Plot |
|---|---|
| CZT HV Monitor | 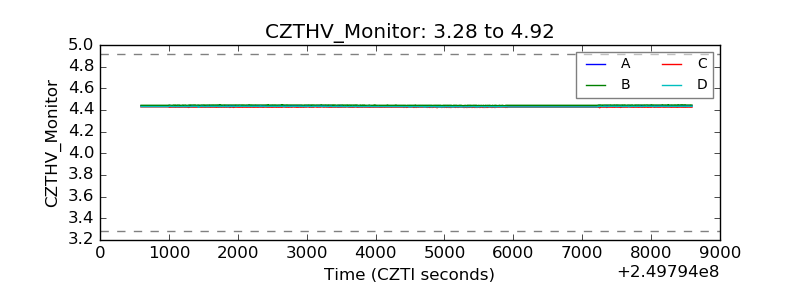 |
| D_VDD | 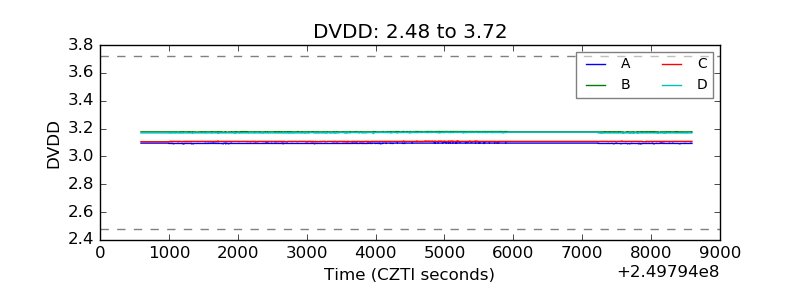 |
| Temperature 1 | 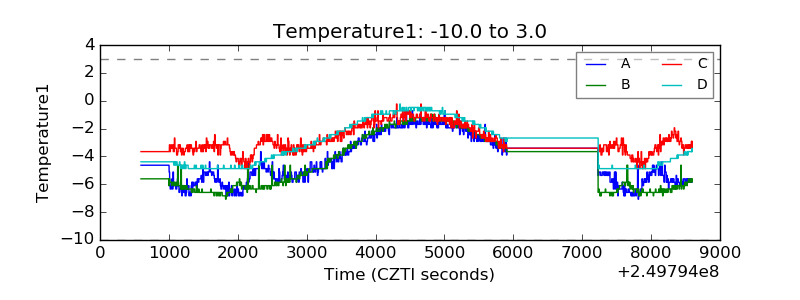 |
| Veto HV Monitor | 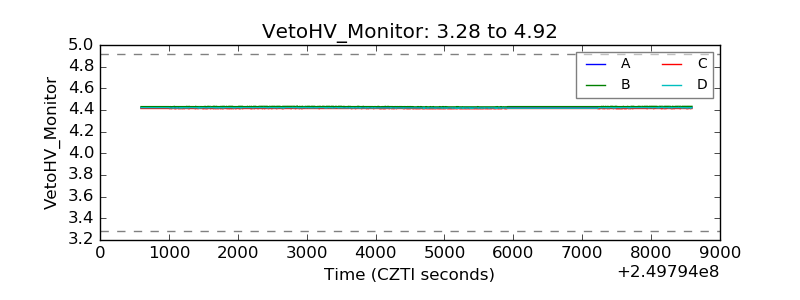 |
| Veto LLD | 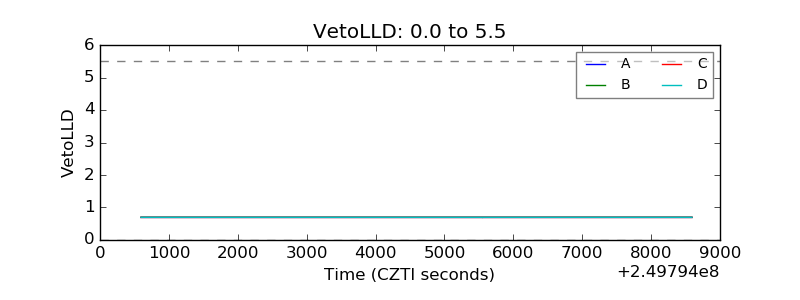 |
| Alpha Counter | 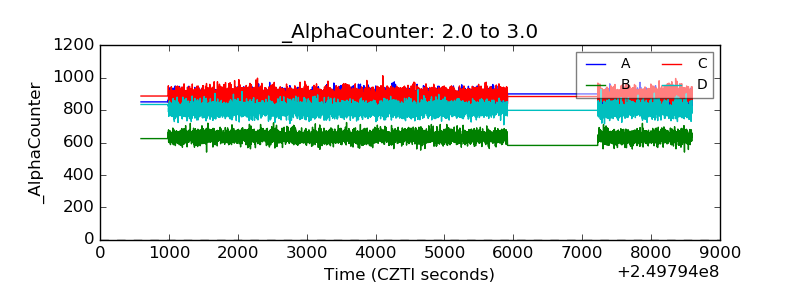 |
| _CPM_Rate | 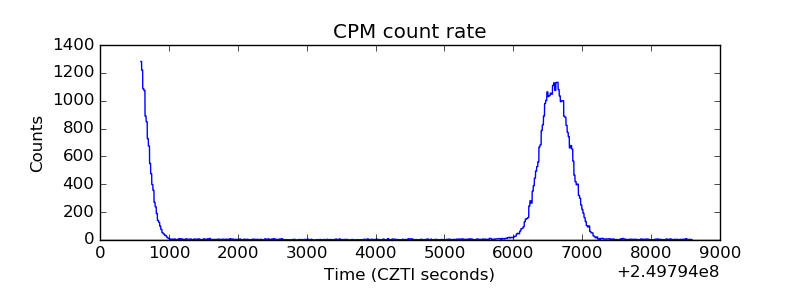 |
| CZT Counter |  |
| +2.5 Volts monitor |  |
| +5 Volts monitor |  |
| _ROLL_ROT | 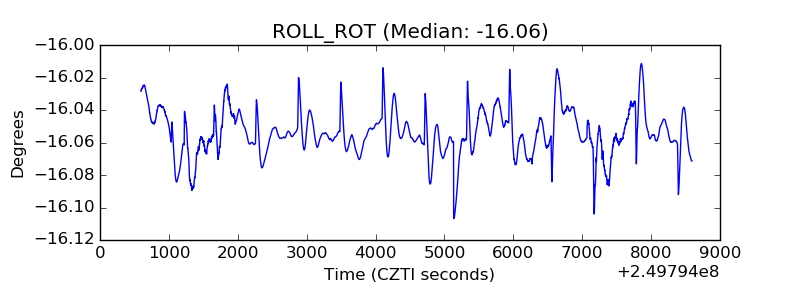 |
| _Roll_DEC | 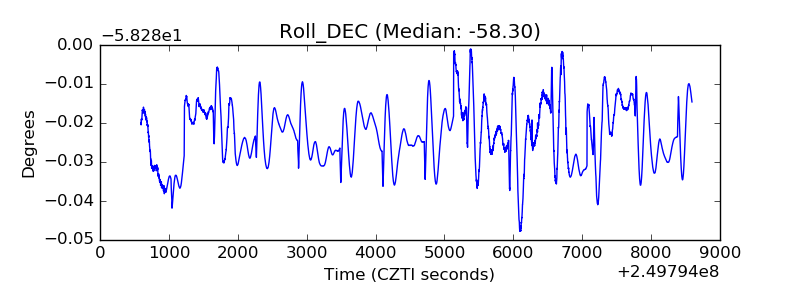 |
| _Roll_RA | 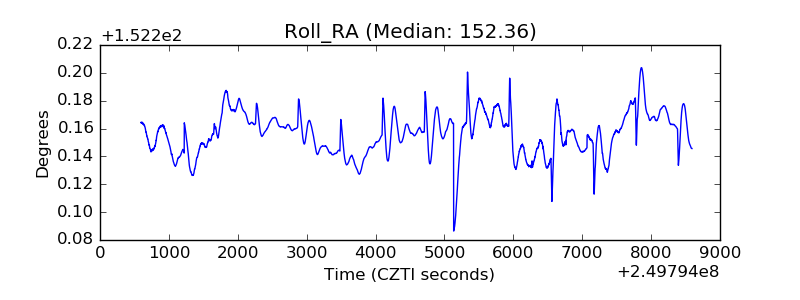 |
| Veto Counter | 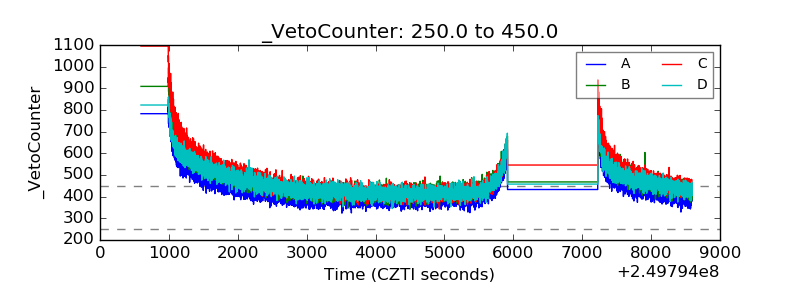 |