| Param | Original file | Final file |
|---|---|---|
| Filename | modeM0/AS1A04_231T01_9000001740_11769cztM0_level2.evt | modeM0/AS1A04_231T01_9000001740_11769cztM0_level2_quad_clean.evt |
| Size (bytes) | 553,596,480 | 100,468,800 |
| Size | 528.0 MB | 95.8 MB |
| Events in quadrant A | 3,742,590 | 649,866 |
| Events in quadrant B | 4,115,474 | 660,700 |
| Events in quadrant C | 3,085,518 | 672,346 |
| Events in quadrant D | 5,380,635 | 605,423 |
| Mode SS | |||
|---|---|---|---|
| Quadrant | BADHDUFLAG | Total packets | Discarded packets |
| A | 0 | 134 | 0 |
| B | 0 | 134 | 0 |
| C | 0 | 134 | 0 |
| D | 0 | 134 | 0 |
| Mode M9 | |||
|---|---|---|---|
| Quadrant | BADHDUFLAG | Total packets | Discarded packets |
| A | 0 | 10 | 0 |
| B | 0 | 10 | 0 |
| C | 0 | 10 | 0 |
| D | 0 | 10 | 0 |
| Mode M0 | |||
|---|---|---|---|
| Quadrant | BADHDUFLAG | Total packets | Discarded packets |
| A | 0 | 15287 | 3 |
| B | 0 | 16502 | 2 |
| C | 0 | 13454 | 2 |
| D | 0 | 20269 | 2 |
| Quadrant | Total seconds | Saturated seconds | Saturation percentage |
|---|---|---|---|
| A | 6505 | 93 | 1.429669% |
| B | 6505 | 319 | 4.903920% |
| C | 6505 | 85 | 1.306687% |
| D | 6505 | 679 | 10.438125% |
Noise dominated data is calculated using 1-second bins in cleaned event files. If a bin has >2000 counts, and if more than 50% of those come from <1% of pixels, then it is considered to be noise-dominated and hence unusable.
| Quadrant | # 1 sec bins | Bins with >0 counts | Bins with >2000 counts | High rate bins dominated by noise | Noise dominated (total time) | Noise dominated (detector-on time) | Marked lightcurve |
|---|---|---|---|---|---|---|---|
| A | 7556 | 6507 | 2 | 2 | 0.03% | 0.03% | 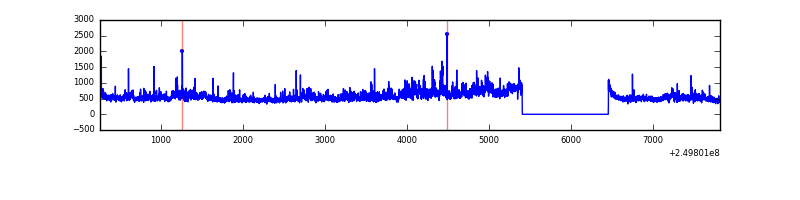 |
| B | 7556 | 6507 | 122 | 122 | 1.61% | 1.87% | 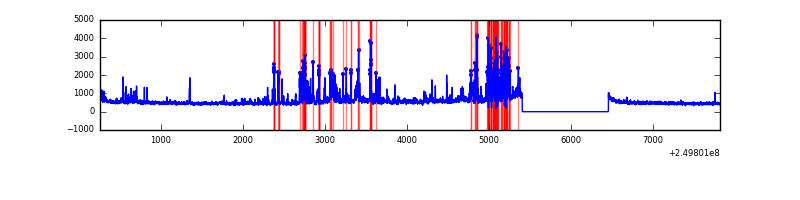 |
| C | 7556 | 6507 | 4 | 4 | 0.05% | 0.06% | 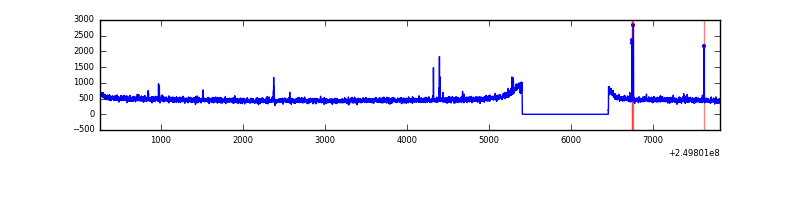 |
| D | 7556 | 6507 | 507 | 507 | 6.71% | 7.79% | 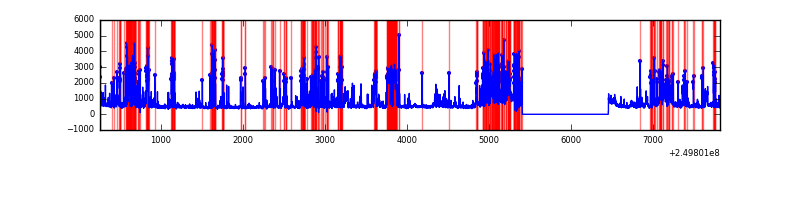 |
Top three noisy pixels from each quadrant. If the there are fewer than three noisy pixels in the level2.evt file, extra rows are filled as -1
| Pixel properties | Quadrant properties | ||||||
|---|---|---|---|---|---|---|---|
| Quadrant | DetID | PixID | Counts | Sigma | Mean | Median | Sigma |
| A | 8 | 15 | 537523 | 3418.56 | 778 | 760 | 157.0 |
| A | 1 | 162 | 78472 | 494.94 | 778 | 760 | 157.0 |
| A | 1 | 178 | 42561 | 266.22 | 778 | 760 | 157.0 |
| B | 4 | 239 | 686390 | 4747.28 | 772 | 752 | 144.4 |
| B | 15 | 204 | 186057 | 1283.03 | 772 | 752 | 144.4 |
| B | 10 | 16 | 72374 | 495.9 | 772 | 752 | 144.4 |
| C | 14 | 234 | 25107 | 135.3 | 783 | 788 | 179.7 |
| C | 12 | 4 | 6224 | 30.24 | 783 | 788 | 179.7 |
| C | 13 | 61 | 5691 | 27.28 | 783 | 788 | 179.7 |
| D | 1 | 52 | 2010442 | 11459.49 | 736 | 716 | 175.4 |
| D | 13 | 122 | 272661 | 1550.63 | 736 | 716 | 175.4 |
| D | 10 | 199 | 92020 | 520.62 | 736 | 716 | 175.4 |
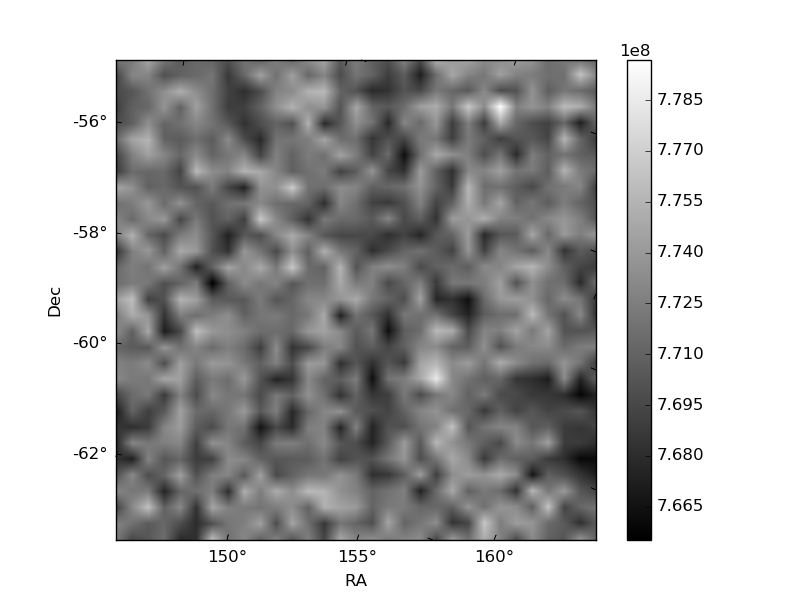
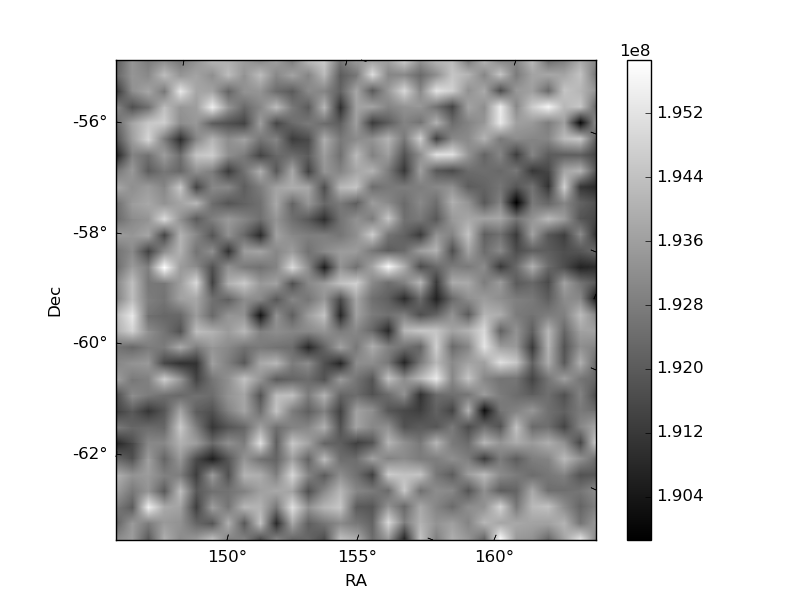
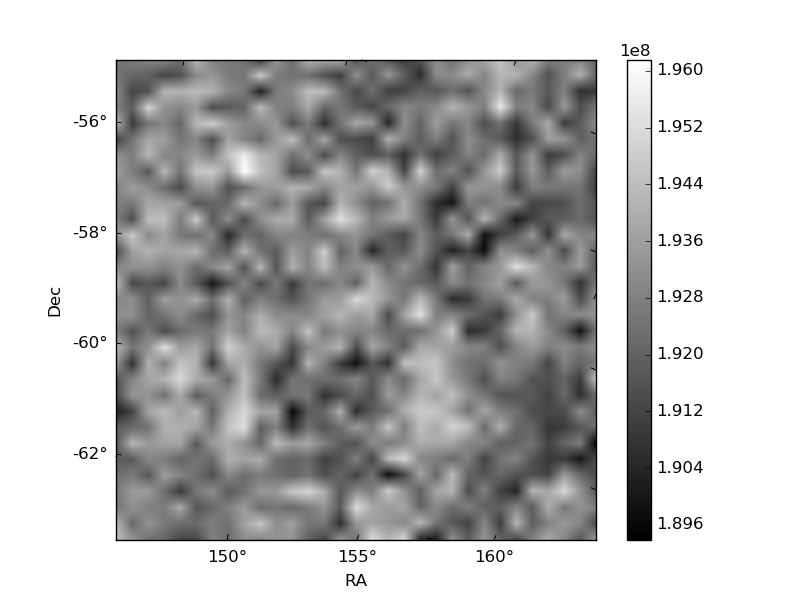
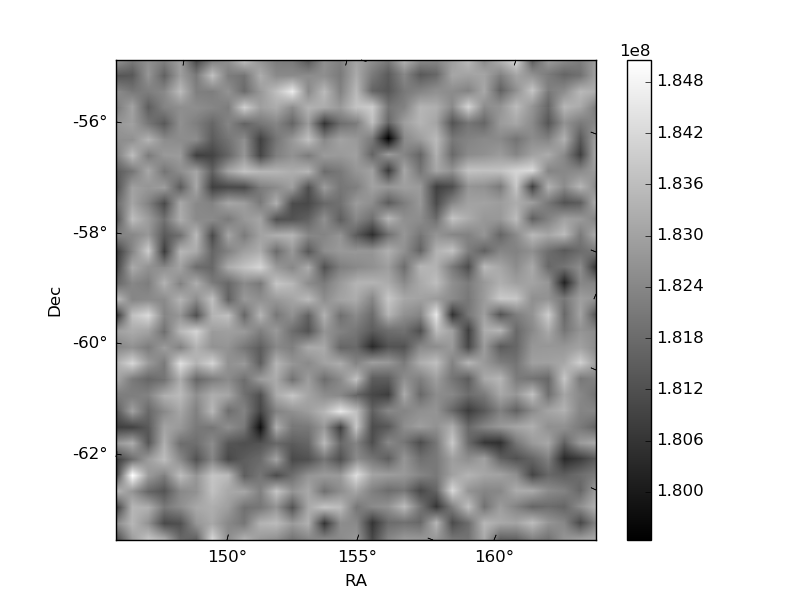
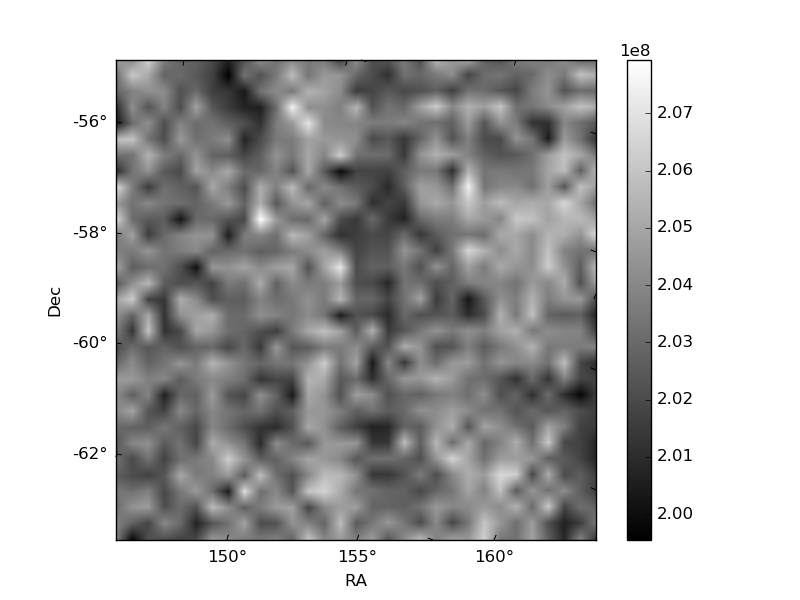
Histogram calculated using DETX and DETY for each event in the final _common_clean file
| Quadrant A | 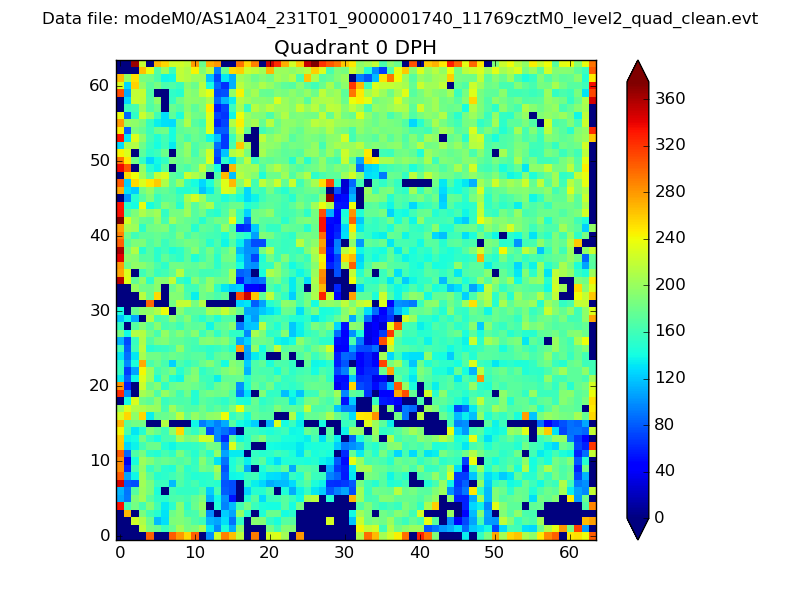 |
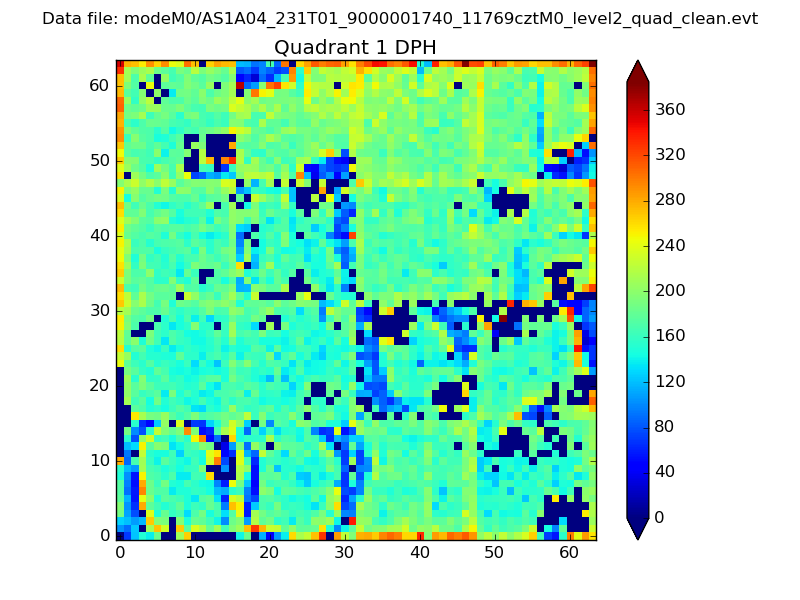 |
Quadrant B |
|---|---|---|---|
| Quadrant D | 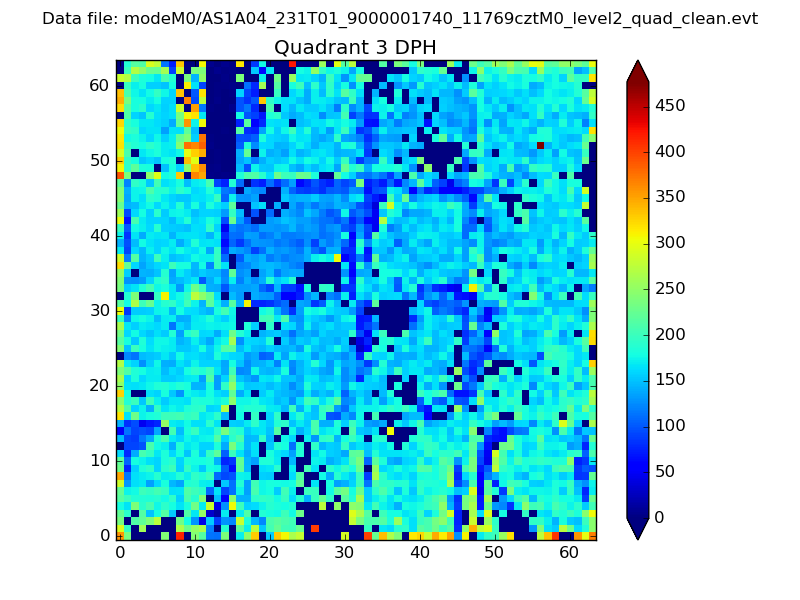 |
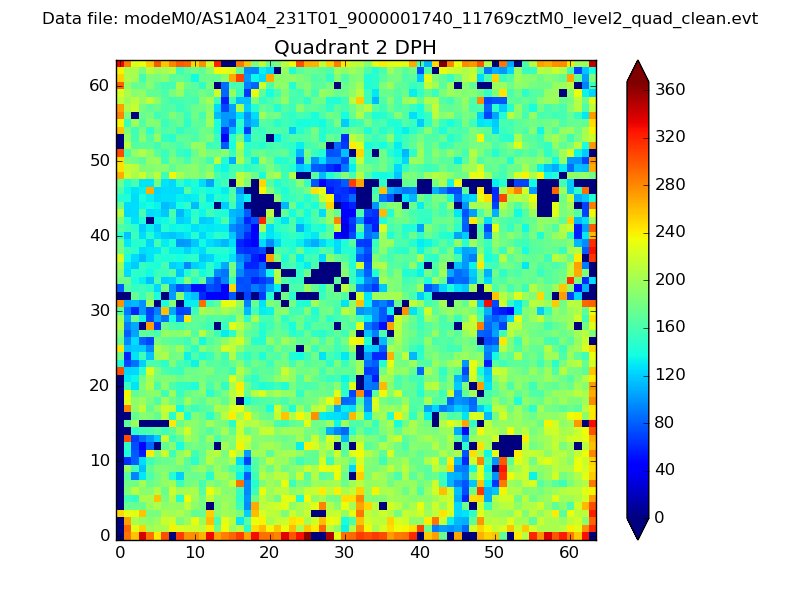 |
Quadrant C |
| Plot type | Count rate plots | Images |
|---|---|---|
| Comparison with Poisson distribution Blue bars denote a histogram of data divided into 1 sec bins. Red curve is a Poisson curve with rate = median count rate of data. |
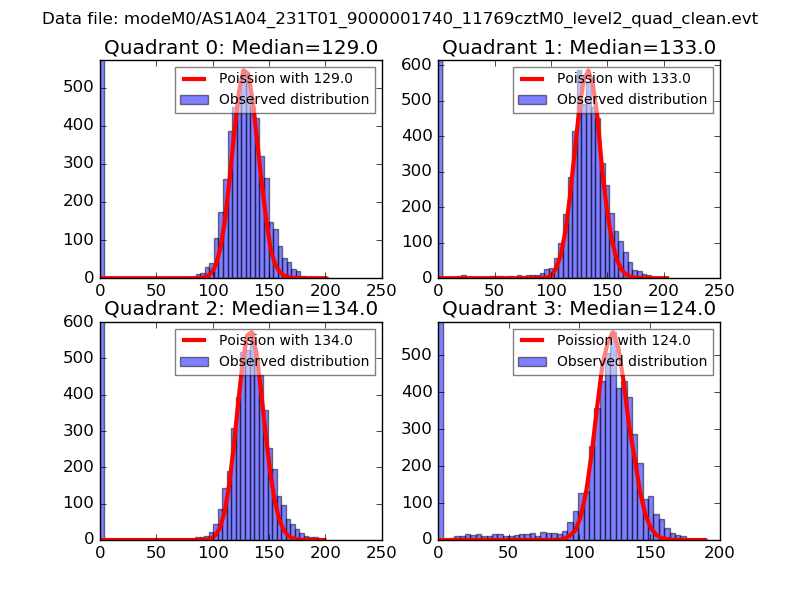 |
 |
| Quadrant-wise count rates Data is divided into 100 sec bins |
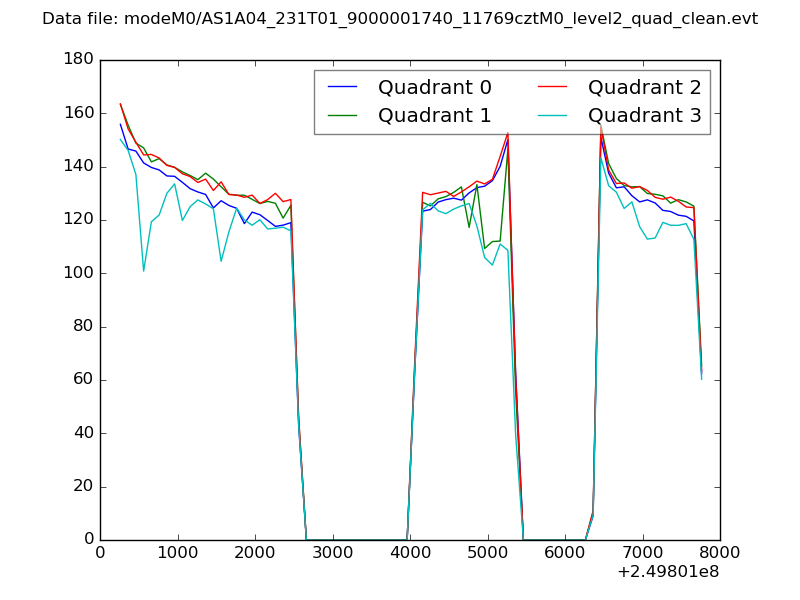 |
|
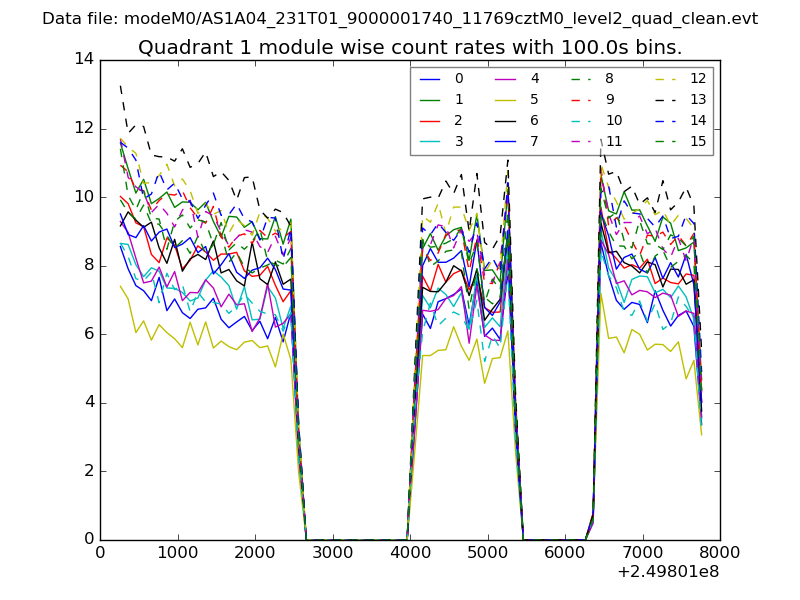
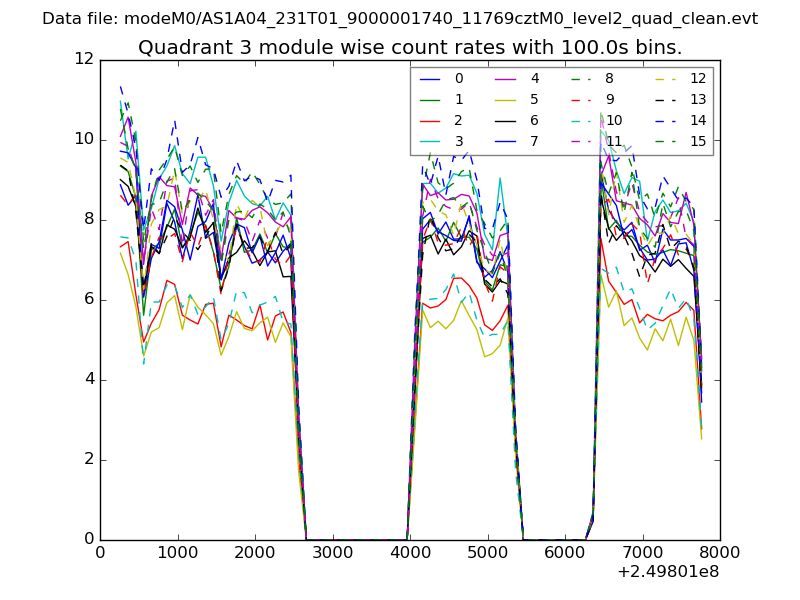
| Module-wise count rates for Quadrant A Data is divided into 100 sec bins |
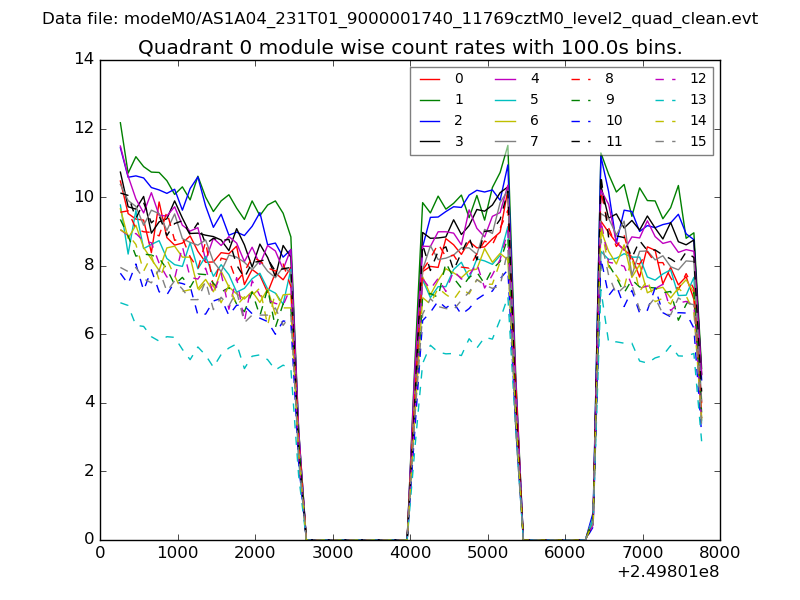 |
 |
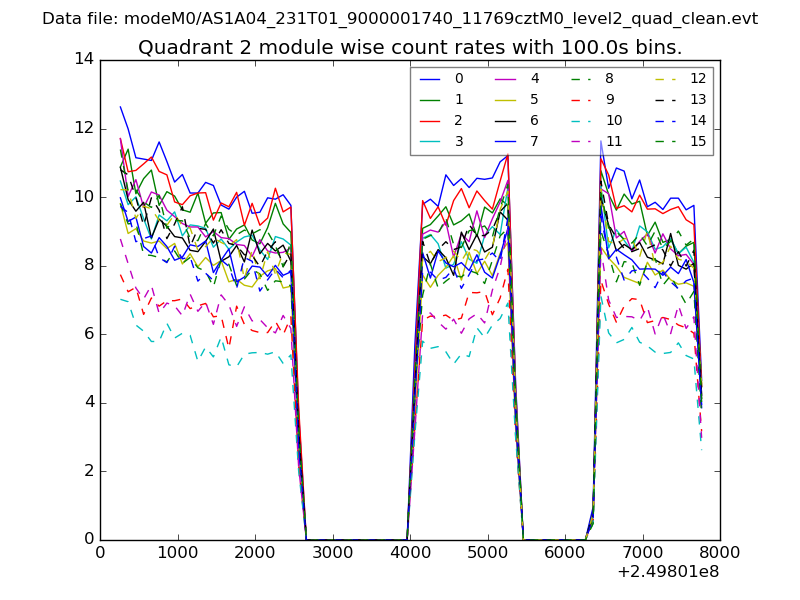
| Module-wise count rates for Quadrant B Data is divided into 100 sec bins |
 |
 |
| Module-wise count rates for Quadrant C Data is divided into 100 sec bins |
 |
 |
| Module-wise count rates for Quadrant D Data is divided into 100 sec bins |
 |
 |
| Parameter | Plot |
|---|---|
| CZT HV Monitor | 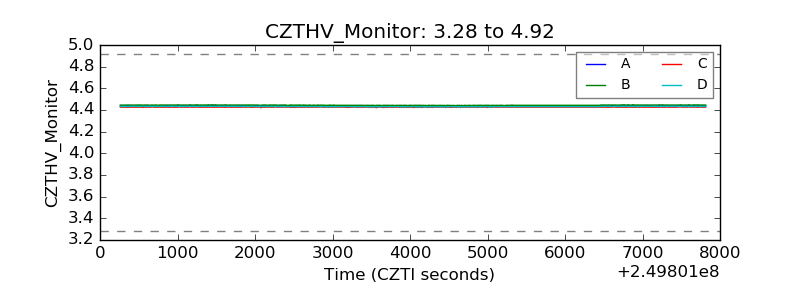 |
| D_VDD |  |
| Temperature 1 | 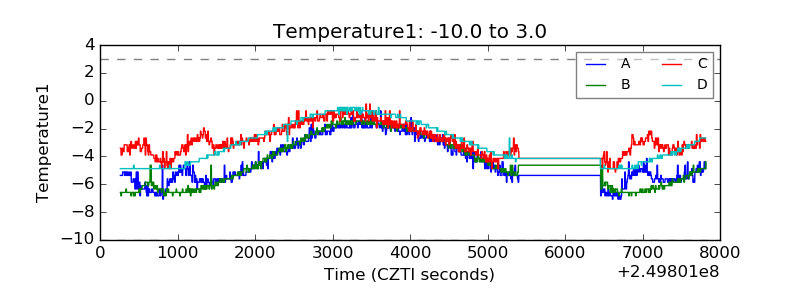 |
| Veto HV Monitor | 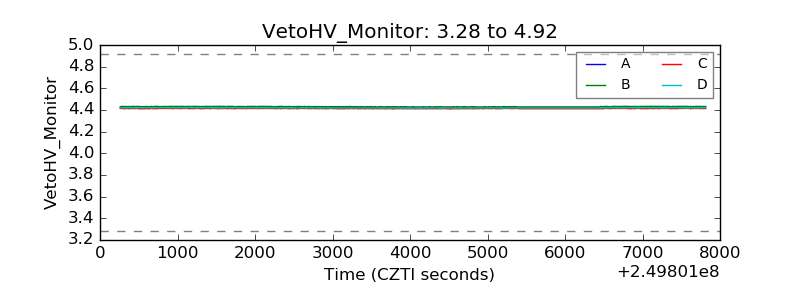 |
| Veto LLD | 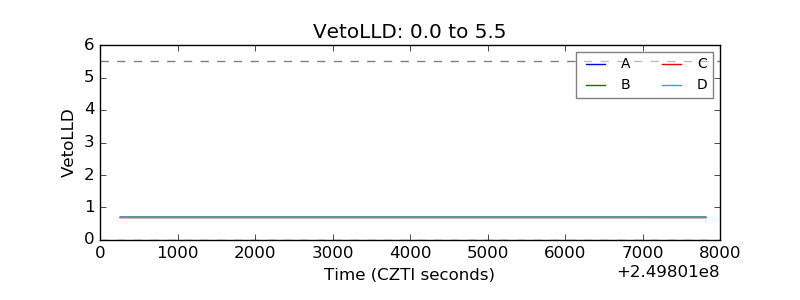 |
| Alpha Counter | 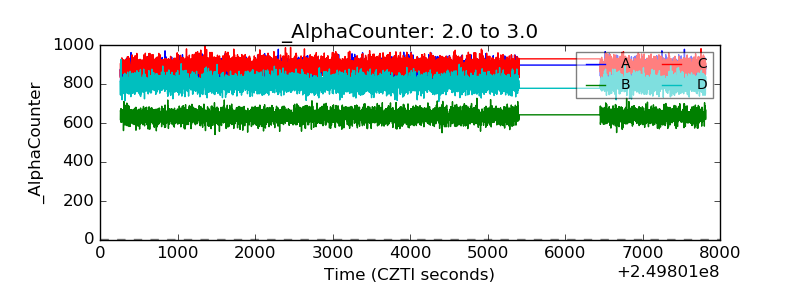 |
| _CPM_Rate | 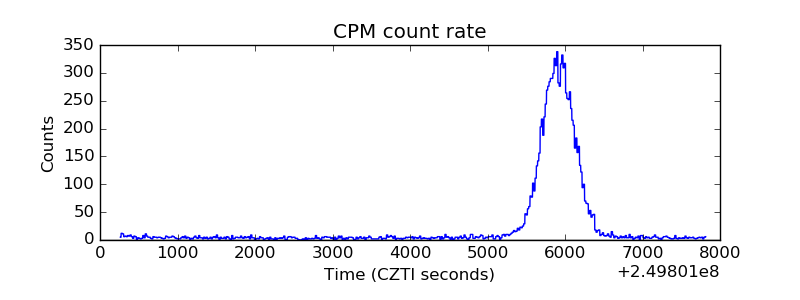 |
| CZT Counter |  |
| +2.5 Volts monitor |  |
| +5 Volts monitor |  |
| _ROLL_ROT | 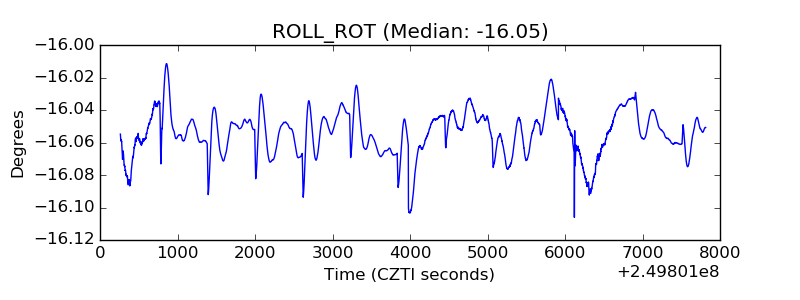 |
| _Roll_DEC | 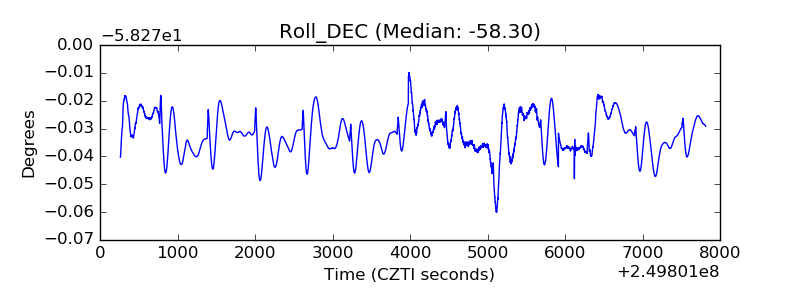 |
| _Roll_RA | 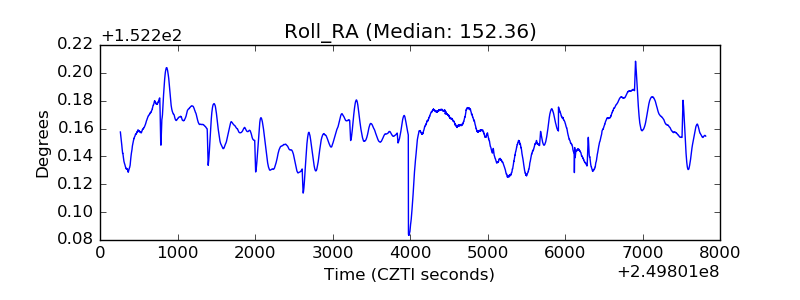 |
| Veto Counter | 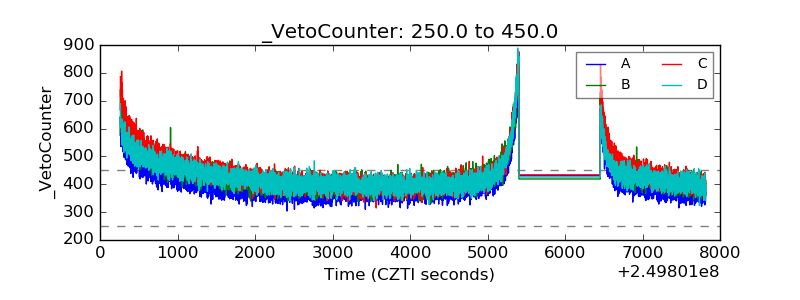 |