| Param | Original file | Final file |
|---|---|---|
| Filename | modeM0/AS1A04_231T01_9000001740_11770cztM0_level2.evt | modeM0/AS1A04_231T01_9000001740_11770cztM0_level2_quad_clean.evt |
| Size (bytes) | 692,913,600 | 100,981,440 |
| Size | 660.8 MB | 96.3 MB |
| Events in quadrant A | 3,913,176 | 669,091 |
| Events in quadrant B | 6,869,992 | 652,626 |
| Events in quadrant C | 3,077,507 | 675,368 |
| Events in quadrant D | 6,665,001 | 586,882 |
| Mode SS | |||
|---|---|---|---|
| Quadrant | BADHDUFLAG | Total packets | Discarded packets |
| A | 0 | 140 | 0 |
| B | 0 | 140 | 0 |
| C | 0 | 140 | 0 |
| D | 0 | 140 | 0 |
| Mode M9 | |||
|---|---|---|---|
| Quadrant | BADHDUFLAG | Total packets | Discarded packets |
| A | 0 | 7 | 0 |
| B | 0 | 7 | 0 |
| C | 0 | 7 | 0 |
| D | 0 | 7 | 0 |
| Mode M0 | |||
|---|---|---|---|
| Quadrant | BADHDUFLAG | Total packets | Discarded packets |
| A | 0 | 16059 | 2 |
| B | 0 | 25046 | 1 |
| C | 0 | 13857 | 1 |
| D | 0 | 24462 | 1 |
| Quadrant | Total seconds | Saturated seconds | Saturation percentage |
|---|---|---|---|
| A | 6790 | 74 | 1.089838% |
| B | 6790 | 669 | 9.852725% |
| C | 6790 | 33 | 0.486009% |
| D | 6790 | 1117 | 16.450663% |
Noise dominated data is calculated using 1-second bins in cleaned event files. If a bin has >2000 counts, and if more than 50% of those come from <1% of pixels, then it is considered to be noise-dominated and hence unusable.
| Quadrant | # 1 sec bins | Bins with >0 counts | Bins with >2000 counts | High rate bins dominated by noise | Noise dominated (total time) | Noise dominated (detector-on time) | Marked lightcurve |
|---|---|---|---|---|---|---|---|
| A | 7536 | 6792 | 2 | 2 | 0.03% | 0.03% | 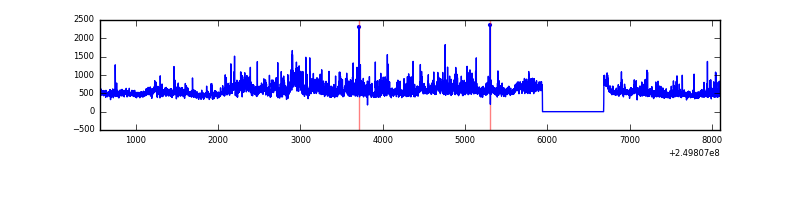 |
| B | 7536 | 6791 | 378 | 378 | 5.02% | 5.57% | 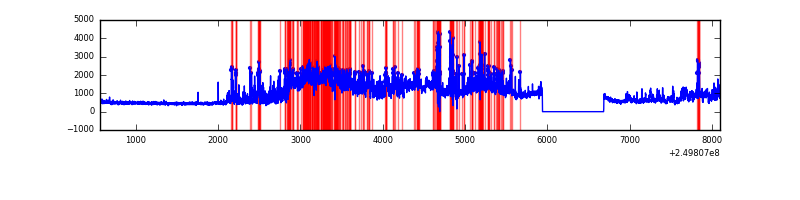 |
| C | 7536 | 6792 | 6 | 6 | 0.08% | 0.09% | 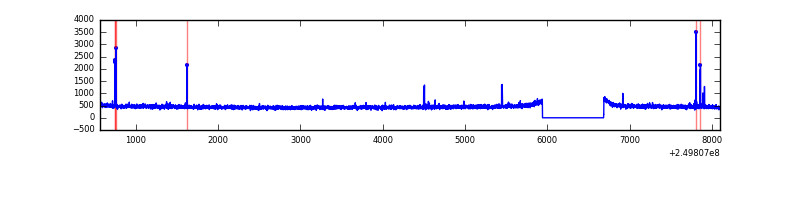 |
| D | 7536 | 6792 | 897 | 897 | 11.90% | 13.21% | 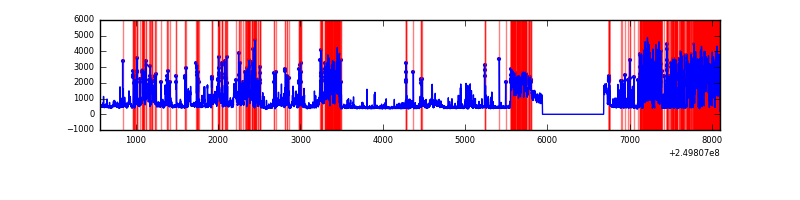 |
Top three noisy pixels from each quadrant. If the there are fewer than three noisy pixels in the level2.evt file, extra rows are filled as -1
| Pixel properties | Quadrant properties | ||||||
|---|---|---|---|---|---|---|---|
| Quadrant | DetID | PixID | Counts | Sigma | Mean | Median | Sigma |
| A | 8 | 15 | 490529 | 3085.93 | 785 | 767 | 158.7 |
| A | 1 | 162 | 139174 | 872.09 | 785 | 767 | 158.7 |
| A | 1 | 178 | 80599 | 503.01 | 785 | 767 | 158.7 |
| B | 10 | 16 | 2026930 | 14008.49 | 768 | 747 | 144.6 |
| B | 15 | 204 | 1009058 | 6971.19 | 768 | 747 | 144.6 |
| B | 4 | 239 | 604387 | 4173.41 | 768 | 747 | 144.6 |
| C | 14 | 234 | 39728 | 215.15 | 776 | 780 | 181.0 |
| C | 12 | 4 | 5941 | 28.51 | 776 | 780 | 181.0 |
| C | 13 | 61 | 5669 | 27.01 | 776 | 780 | 181.0 |
| D | 1 | 52 | 3433740 | 19946.83 | 713 | 693 | 172.1 |
| D | 10 | 199 | 313082 | 1815.05 | 713 | 693 | 172.1 |
| D | 13 | 104 | 46027 | 263.4 | 713 | 693 | 172.1 |
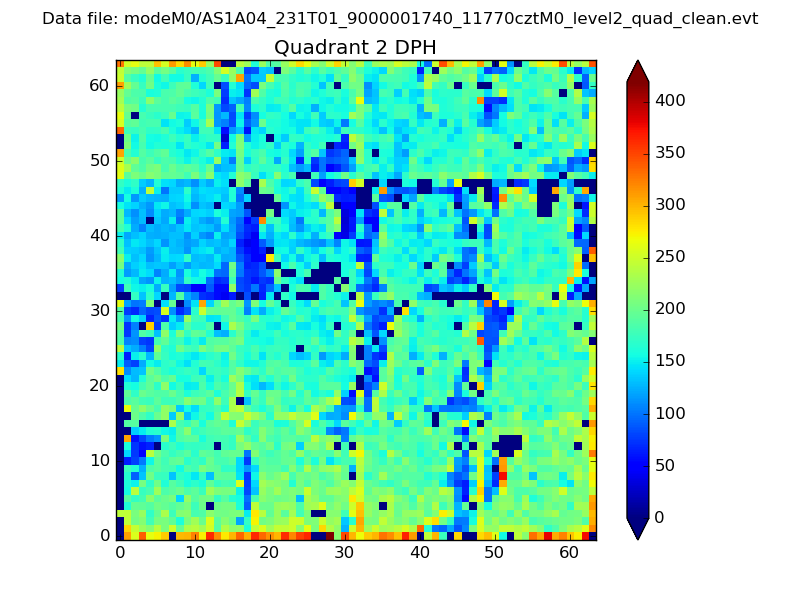
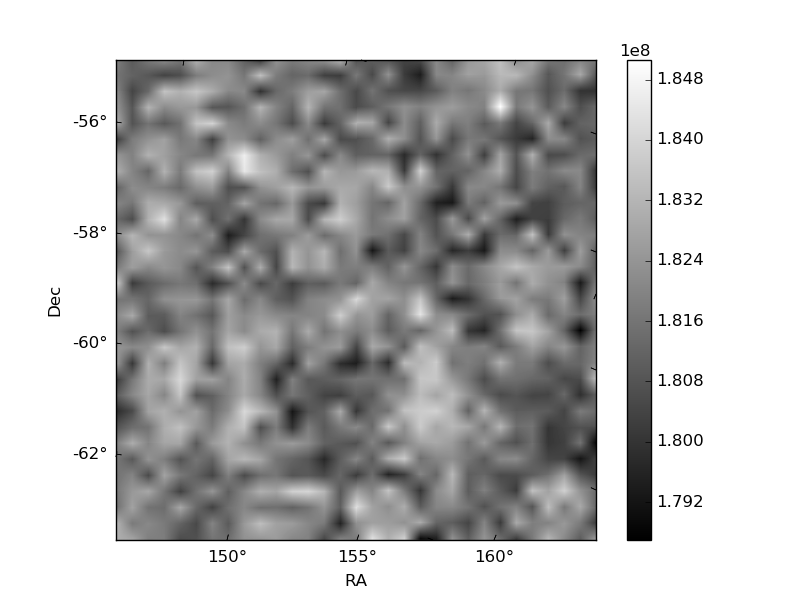
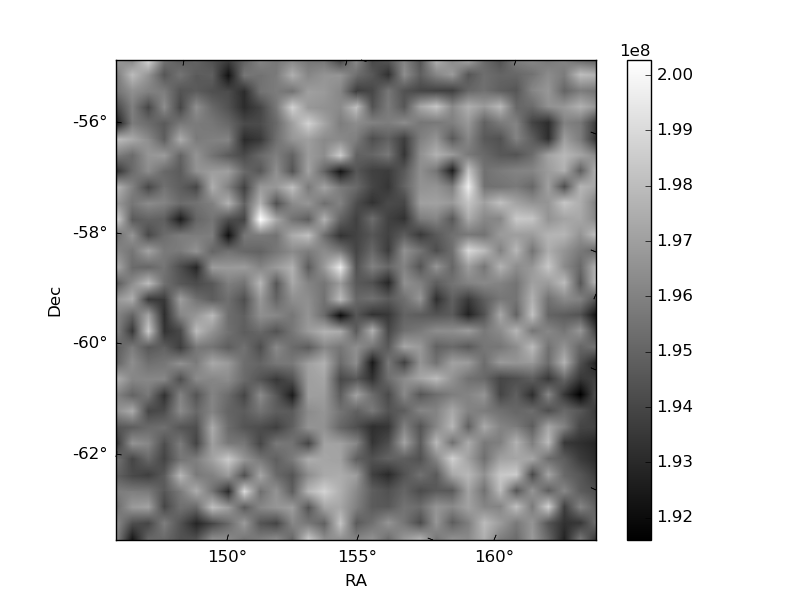
Histogram calculated using DETX and DETY for each event in the final _common_clean file
| Quadrant A | 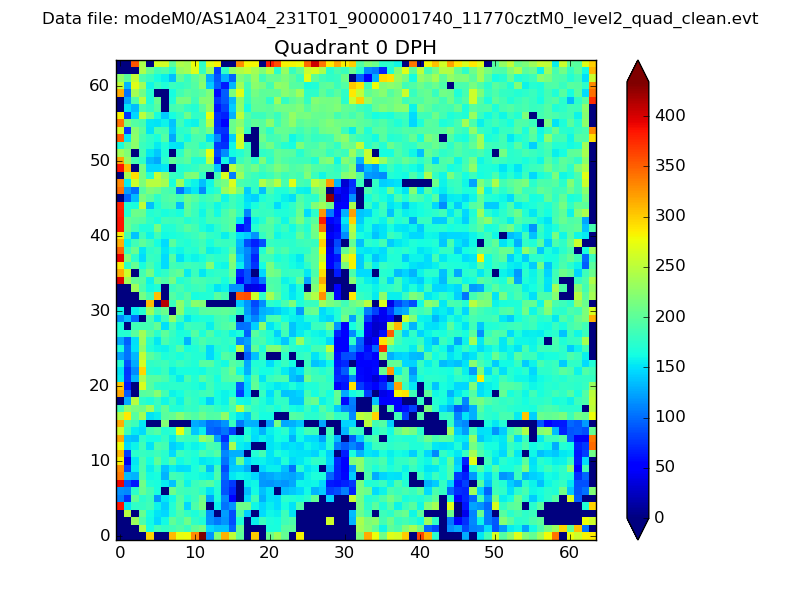 |
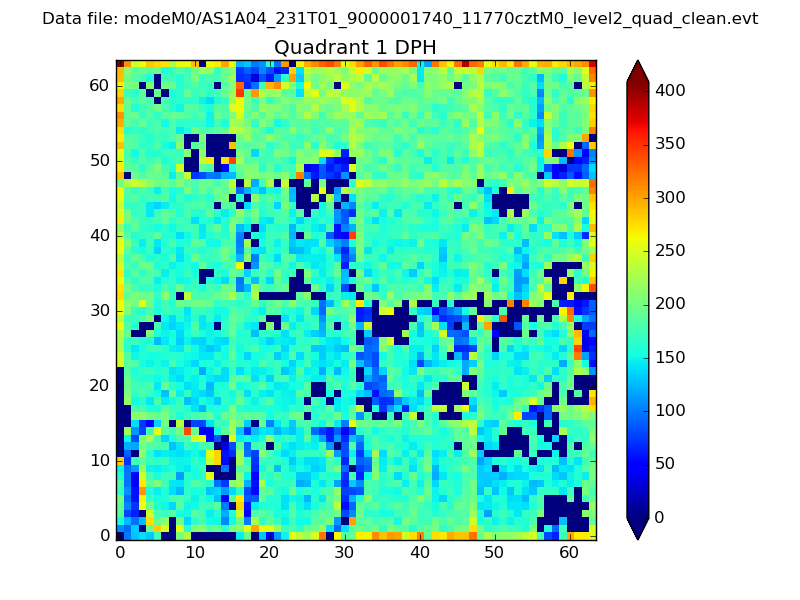 |
Quadrant B |
|---|---|---|---|
| Quadrant D | 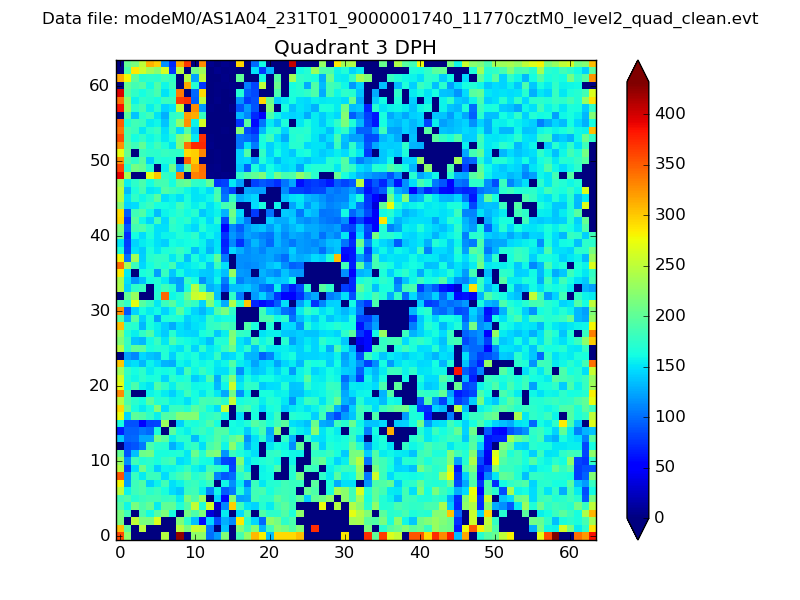 |
 |
Quadrant C |
| Plot type | Count rate plots | Images |
|---|---|---|
| Comparison with Poisson distribution Blue bars denote a histogram of data divided into 1 sec bins. Red curve is a Poisson curve with rate = median count rate of data. |
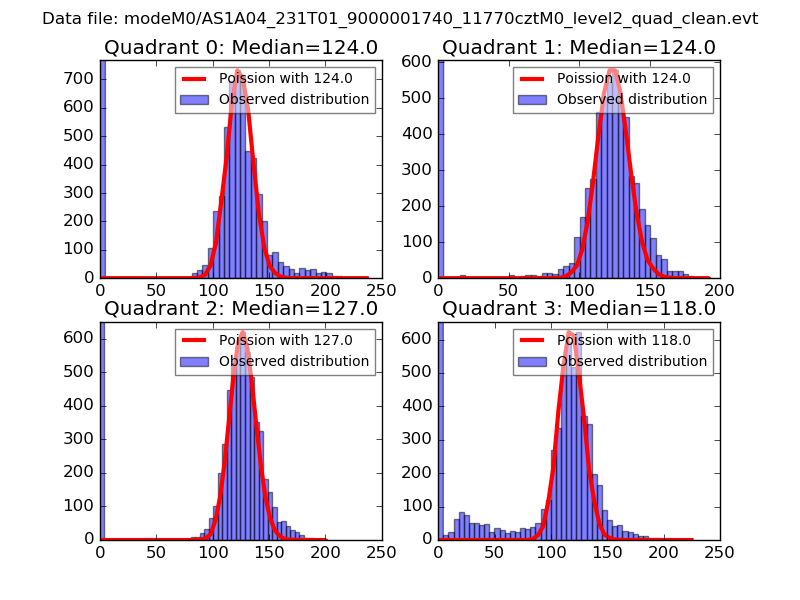 |
 |
| Quadrant-wise count rates Data is divided into 100 sec bins |
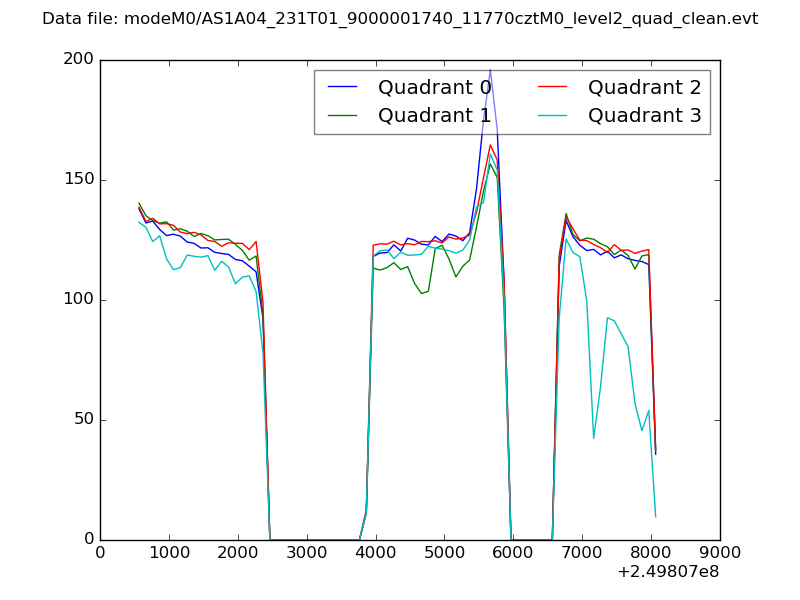 |
|
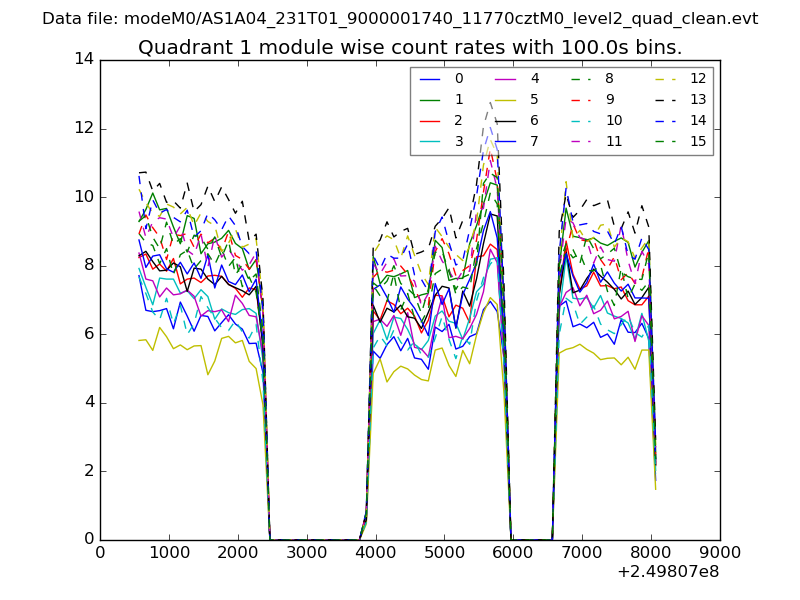
| Module-wise count rates for Quadrant A Data is divided into 100 sec bins |
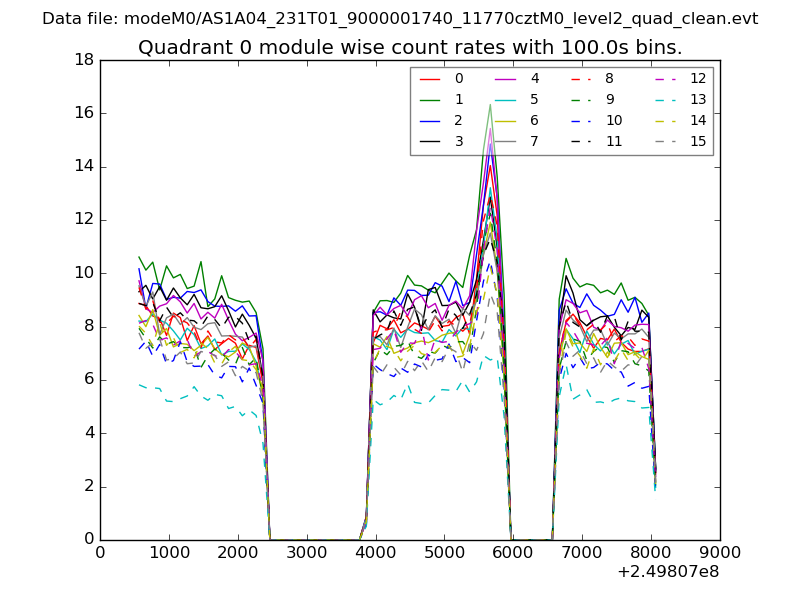 |
 |
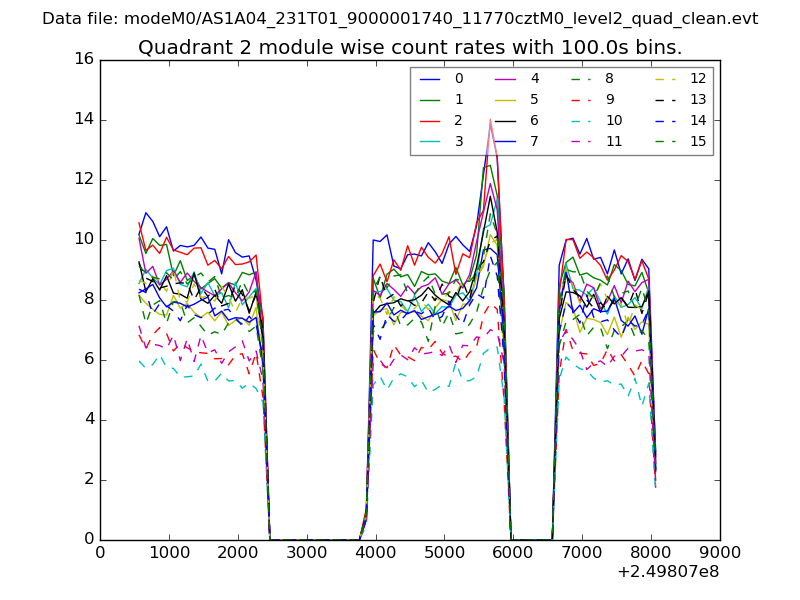
| Module-wise count rates for Quadrant B Data is divided into 100 sec bins |
 |
 |
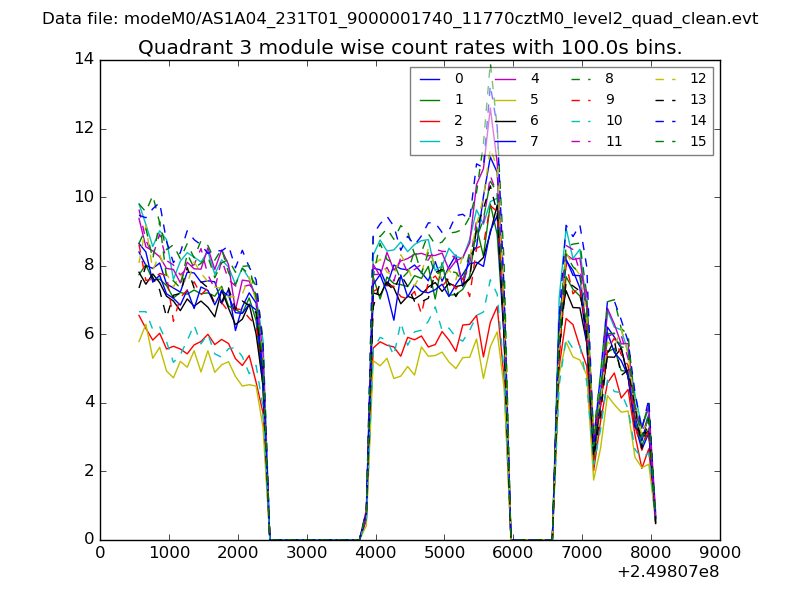
| Module-wise count rates for Quadrant C Data is divided into 100 sec bins |
 |
 |
| Module-wise count rates for Quadrant D Data is divided into 100 sec bins |
 |
 |
| Parameter | Plot |
|---|---|
| CZT HV Monitor | 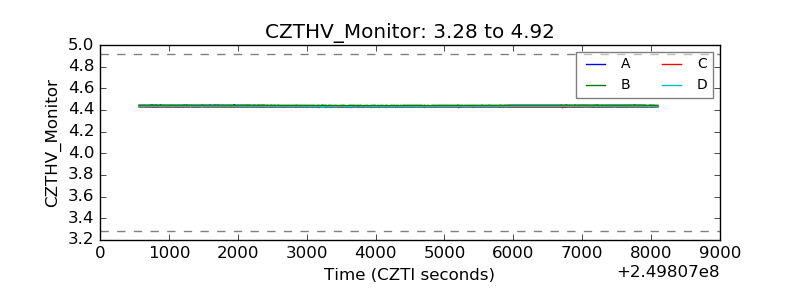 |
| D_VDD | 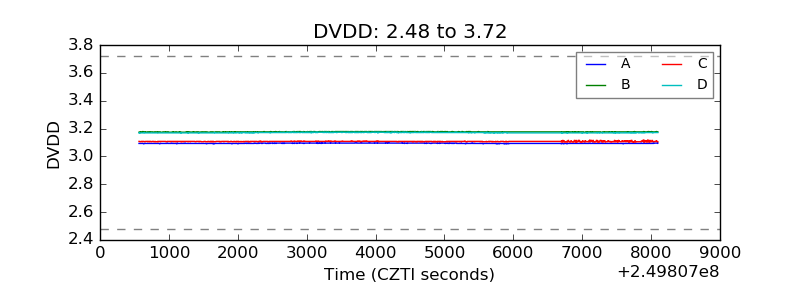 |
| Temperature 1 | 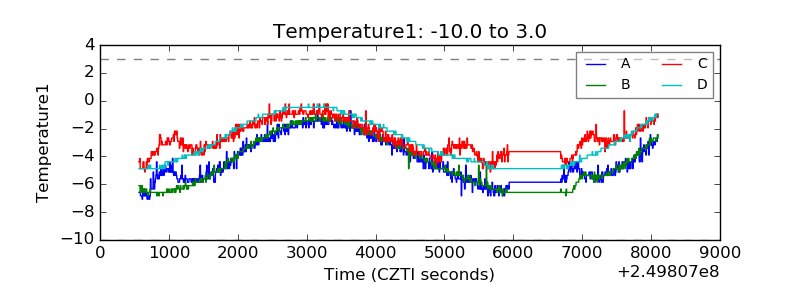 |
| Veto HV Monitor |  |
| Veto LLD | 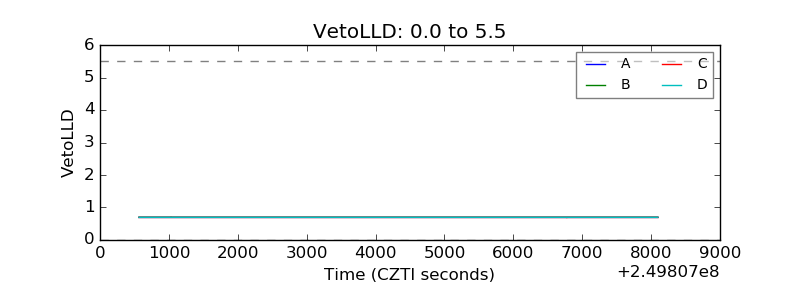 |
| Alpha Counter | 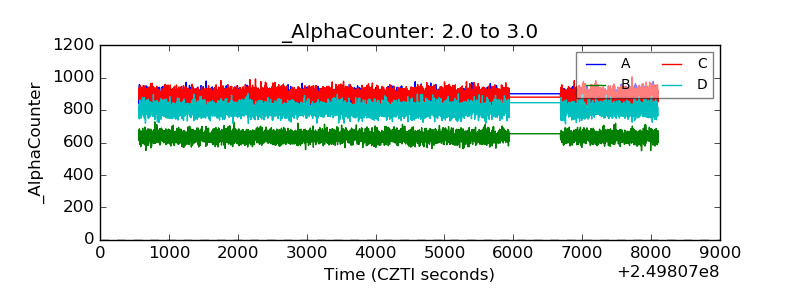 |
| _CPM_Rate | 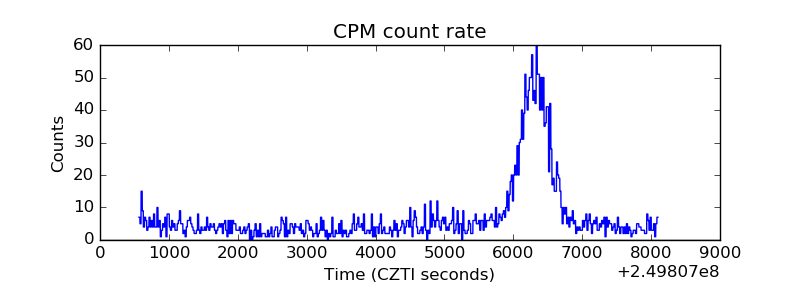 |
| CZT Counter | 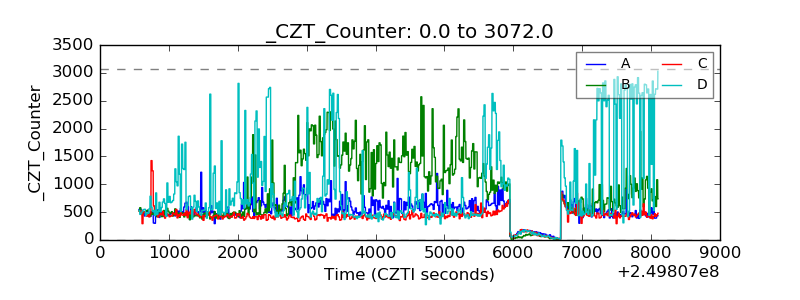 |
| +2.5 Volts monitor |  |
| +5 Volts monitor | 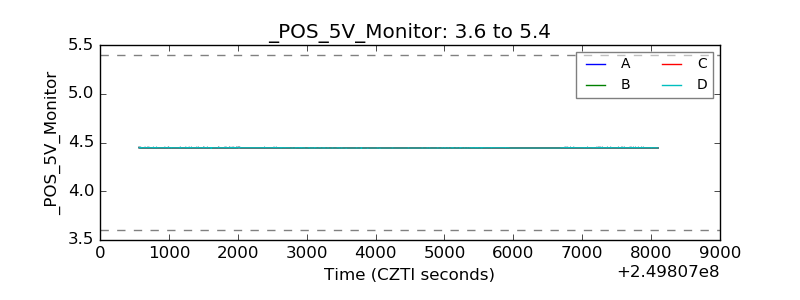 |
| _ROLL_ROT | 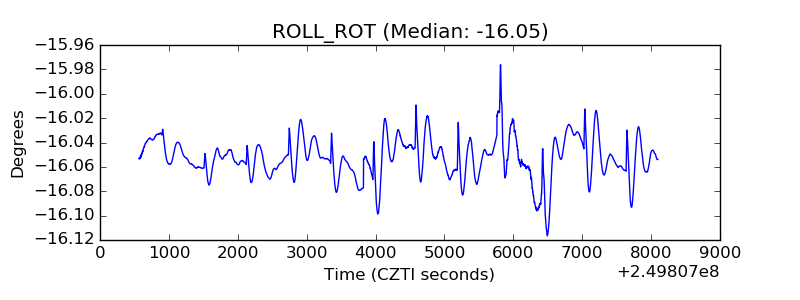 |
| _Roll_DEC | 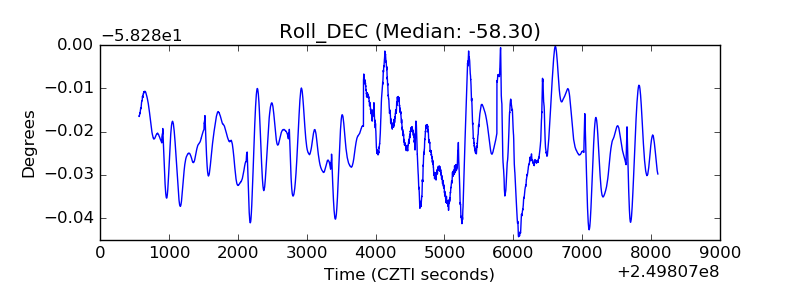 |
| _Roll_RA |  |
| Veto Counter | 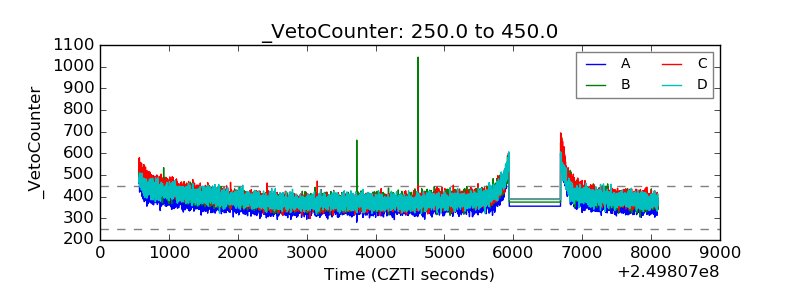 |