| Param | Original file | Final file |
|---|---|---|
| Filename | modeM0/AS1A04_231T01_9000001740_11771cztM0_level2.evt | modeM0/AS1A04_231T01_9000001740_11771cztM0_level2_quad_clean.evt |
| Size (bytes) | 993,404,160 | 89,663,040 |
| Size | 947.4 MB | 85.5 MB |
| Events in quadrant A | 3,987,740 | 625,036 |
| Events in quadrant B | 11,963,452 | 519,982 |
| Events in quadrant C | 3,265,703 | 643,004 |
| Events in quadrant D | 10,396,819 | 437,701 |
| Mode SS | |||
|---|---|---|---|
| Quadrant | BADHDUFLAG | Total packets | Discarded packets |
| A | 0 | 140 | 0 |
| B | 0 | 140 | 0 |
| C | 0 | 140 | 0 |
| D | 0 | 140 | 0 |
| Mode M0 | |||
|---|---|---|---|
| Quadrant | BADHDUFLAG | Total packets | Discarded packets |
| A | 0 | 16332 | 2 |
| B | 0 | 40350 | 1 |
| C | 0 | 14616 | 1 |
| D | 0 | 35637 | 1 |
| Quadrant | Total seconds | Saturated seconds | Saturation percentage |
|---|---|---|---|
| A | 6986 | 401 | 5.740052% |
| B | 6986 | 3778 | 54.079588% |
| C | 6986 | 310 | 4.437446% |
| D | 6986 | 3244 | 46.435729% |
Noise dominated data is calculated using 1-second bins in cleaned event files. If a bin has >2000 counts, and if more than 50% of those come from <1% of pixels, then it is considered to be noise-dominated and hence unusable.
| Quadrant | # 1 sec bins | Bins with >0 counts | Bins with >2000 counts | High rate bins dominated by noise | Noise dominated (total time) | Noise dominated (detector-on time) | Marked lightcurve |
|---|---|---|---|---|---|---|---|
| A | 7022 | 6989 | 7 | 7 | 0.10% | 0.10% | 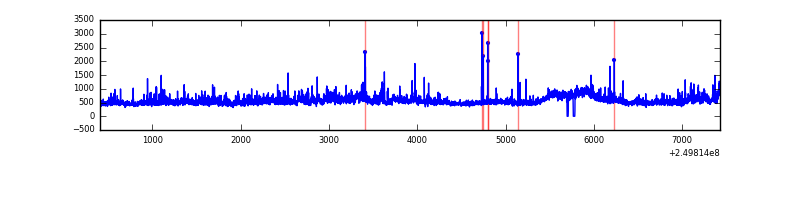 |
| B | 7022 | 6989 | 2796 | 2796 | 39.82% | 40.01% | 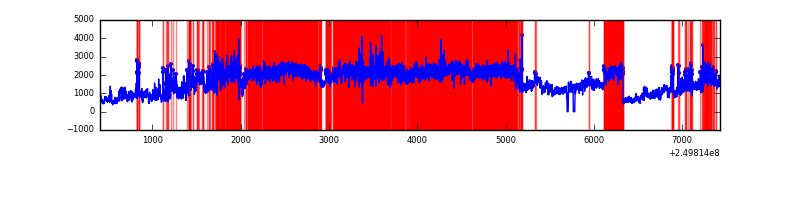 |
| C | 7022 | 6989 | 2 | 2 | 0.03% | 0.03% | 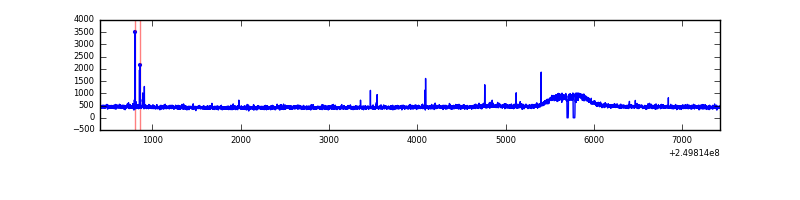 |
| D | 7022 | 6989 | 2633 | 2633 | 37.50% | 37.67% | 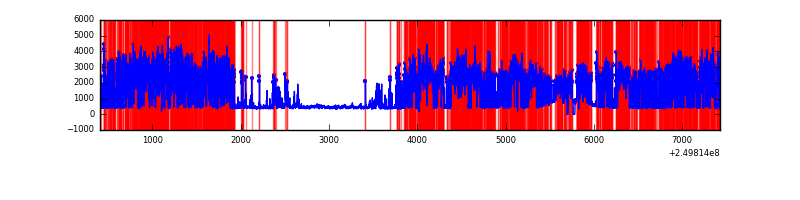 |
Top three noisy pixels from each quadrant. If the there are fewer than three noisy pixels in the level2.evt file, extra rows are filled as -1
| Pixel properties | Quadrant properties | ||||||
|---|---|---|---|---|---|---|---|
| Quadrant | DetID | PixID | Counts | Sigma | Mean | Median | Sigma |
| A | 8 | 15 | 435980 | 2534.62 | 826 | 802 | 171.7 |
| A | 1 | 162 | 129649 | 750.45 | 826 | 802 | 171.7 |
| A | 1 | 178 | 68984 | 397.11 | 826 | 802 | 171.7 |
| B | 10 | 16 | 7635079 | 55114.2 | 717 | 697 | 138.5 |
| B | 4 | 239 | 669892 | 4831.06 | 717 | 697 | 138.5 |
| B | 15 | 204 | 428901 | 3091.29 | 717 | 697 | 138.5 |
| C | 14 | 234 | 20542 | 103.06 | 823 | 823 | 191.3 |
| C | 14 | 128 | 16795 | 83.47 | 823 | 823 | 191.3 |
| C | 8 | 128 | 9269 | 44.14 | 823 | 823 | 191.3 |
| D | 1 | 52 | 7633601 | 50209.83 | 622 | 601 | 152.0 |
| D | 10 | 199 | 143436 | 939.57 | 622 | 601 | 152.0 |
| D | 13 | 104 | 120486 | 788.6 | 622 | 601 | 152.0 |
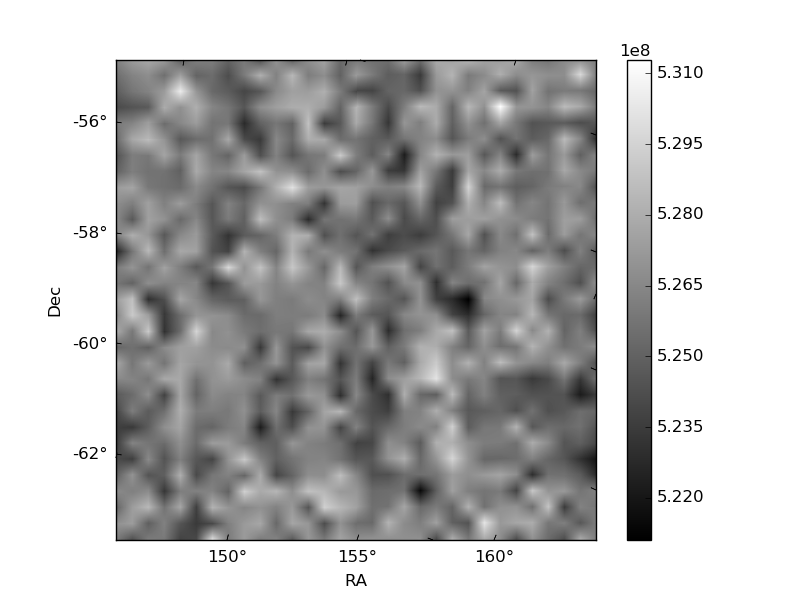
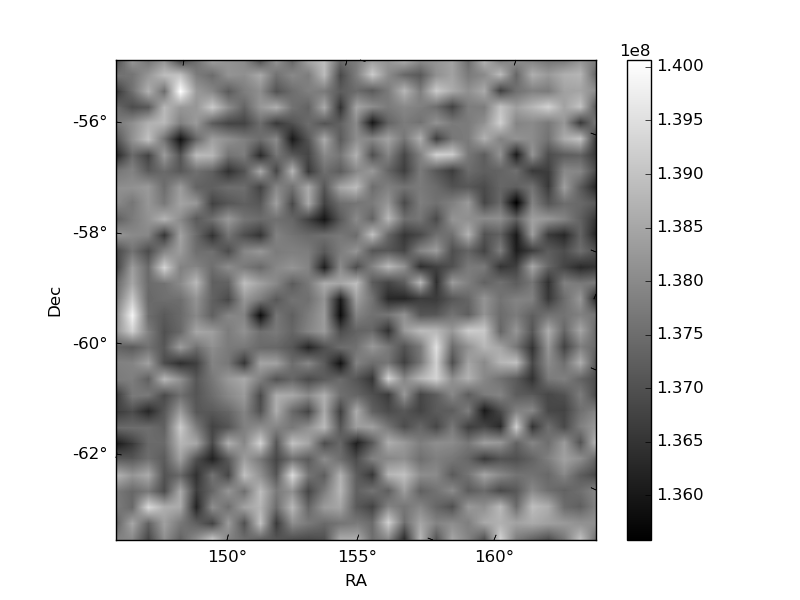
Histogram calculated using DETX and DETY for each event in the final _common_clean file
| Quadrant A | 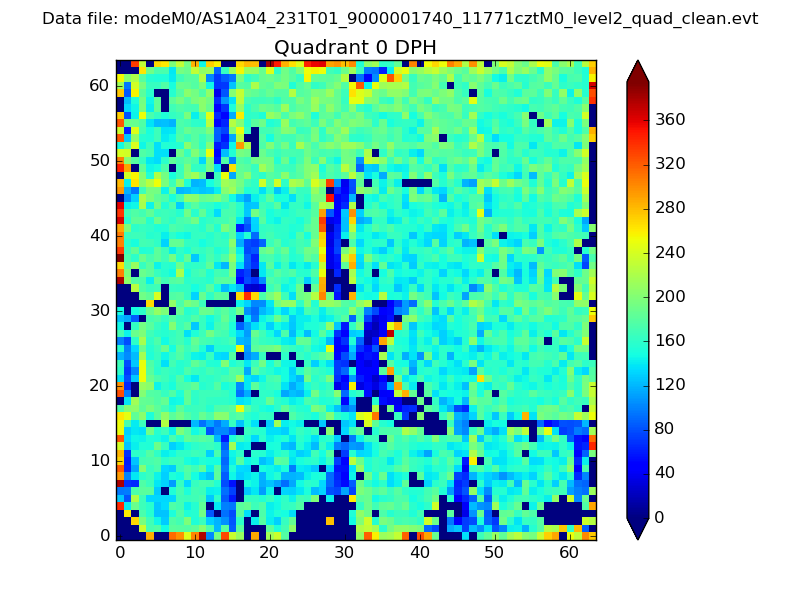 |
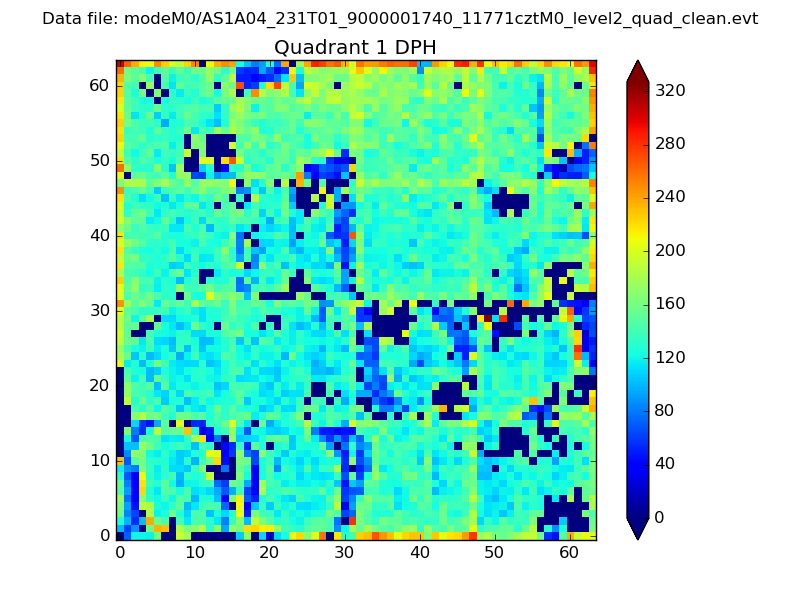 |
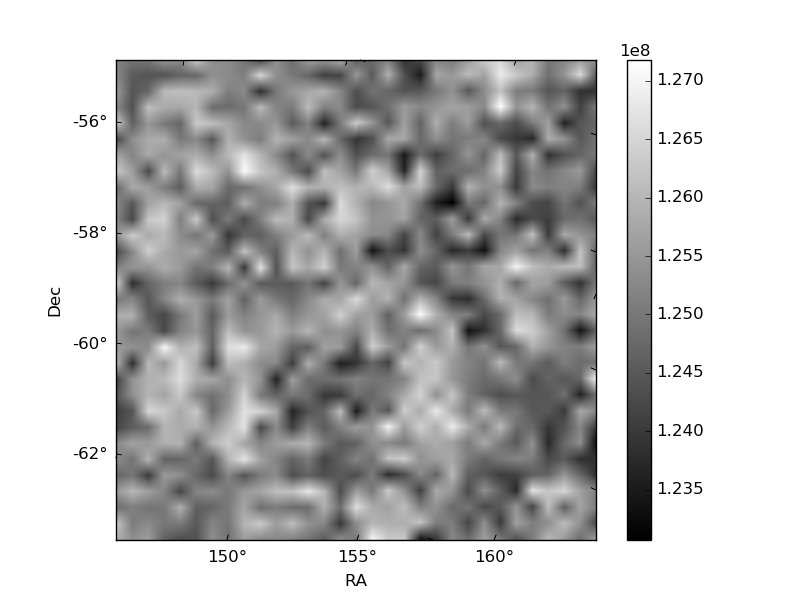
Quadrant B |
|---|---|---|---|
| Quadrant D | 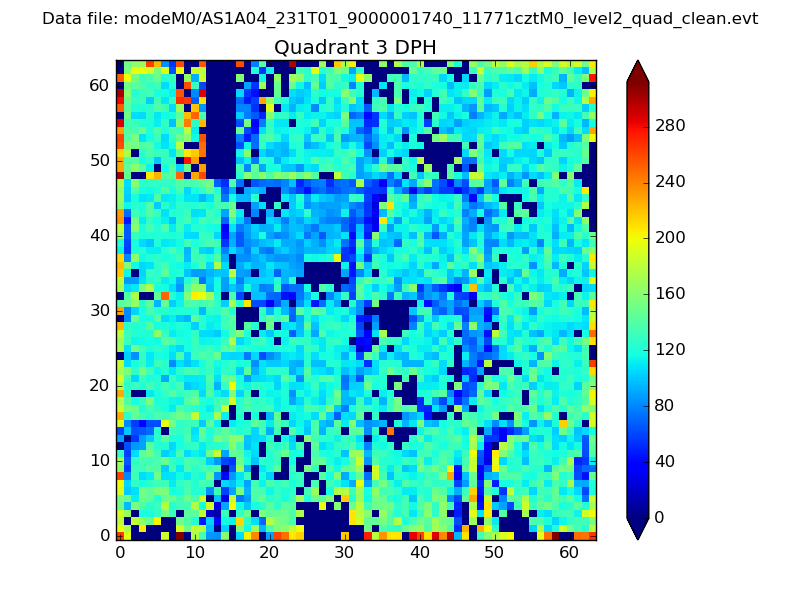 |
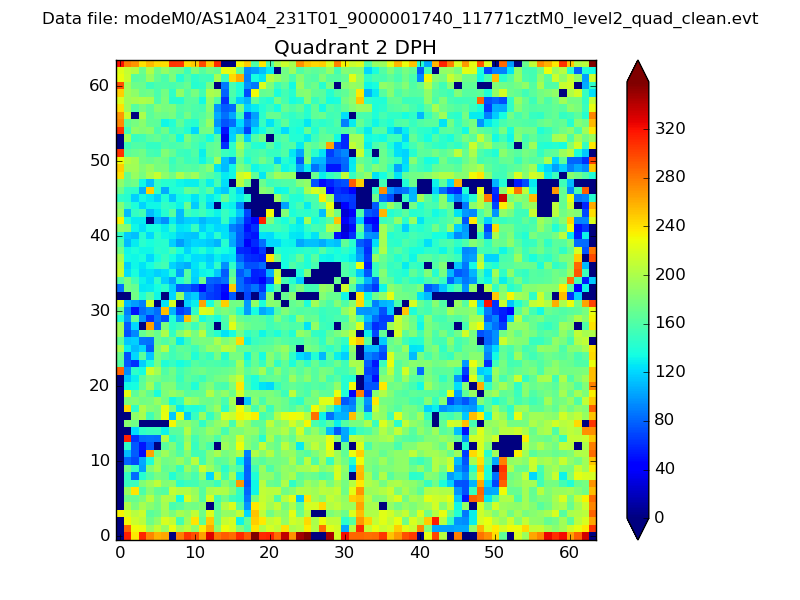 |
Quadrant C |
| Plot type | Count rate plots | Images |
|---|---|---|
| Comparison with Poisson distribution Blue bars denote a histogram of data divided into 1 sec bins. Red curve is a Poisson curve with rate = median count rate of data. |
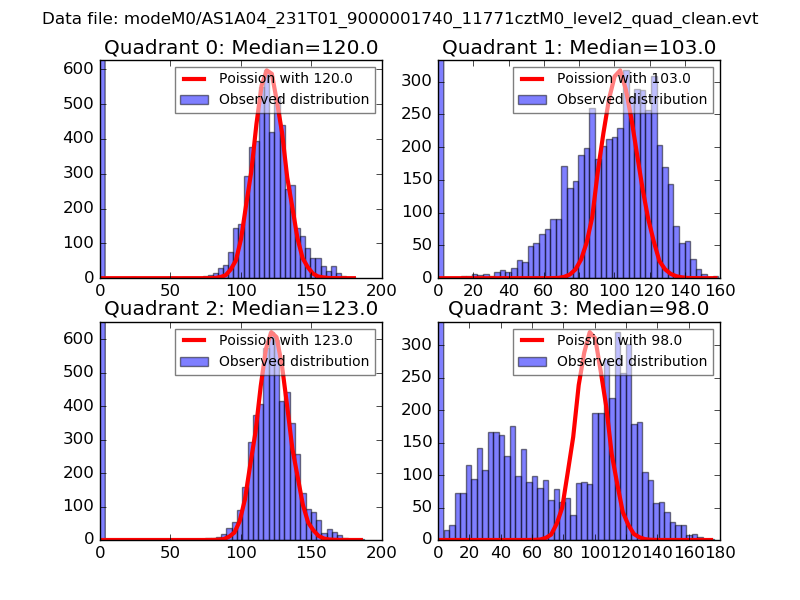 |
 |
| Quadrant-wise count rates Data is divided into 100 sec bins |
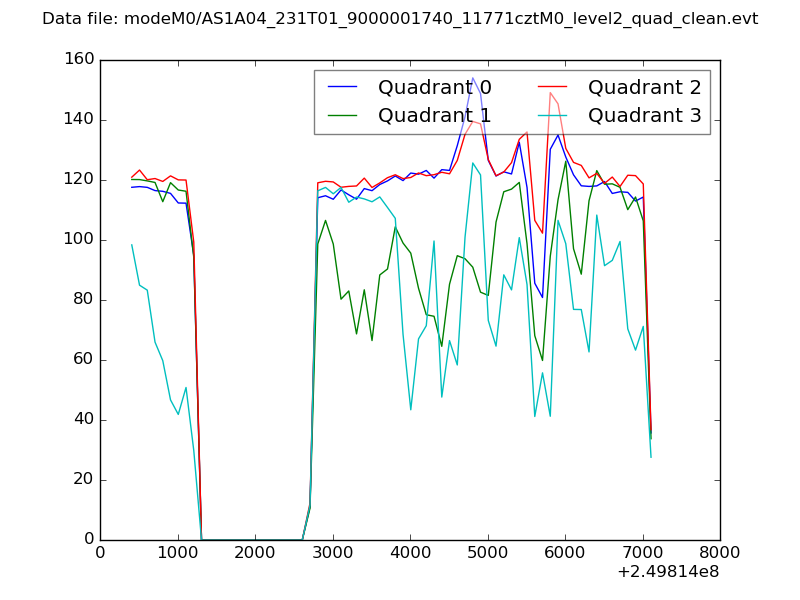 |
|
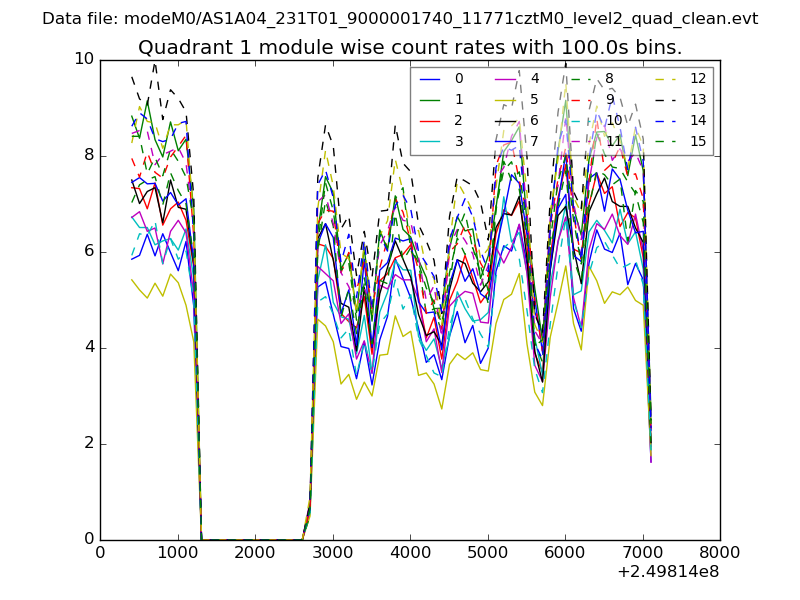
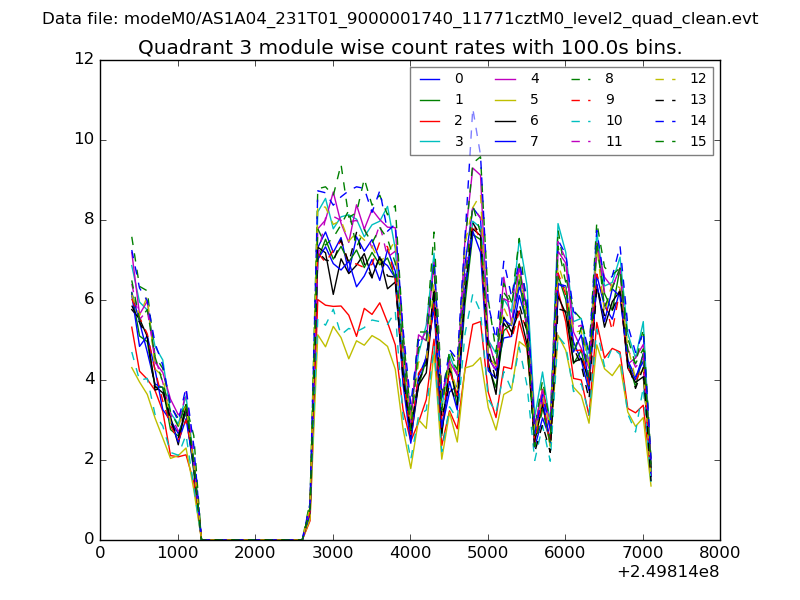
| Module-wise count rates for Quadrant A Data is divided into 100 sec bins |
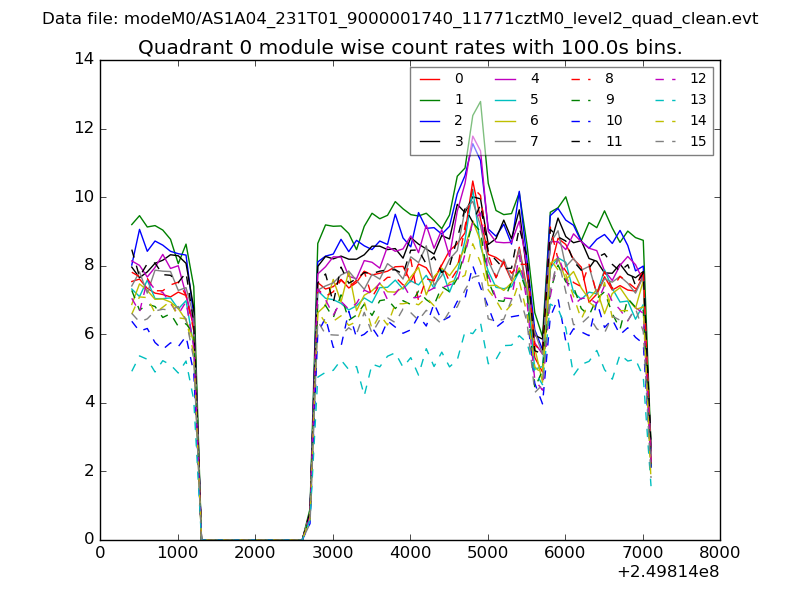 |
 |
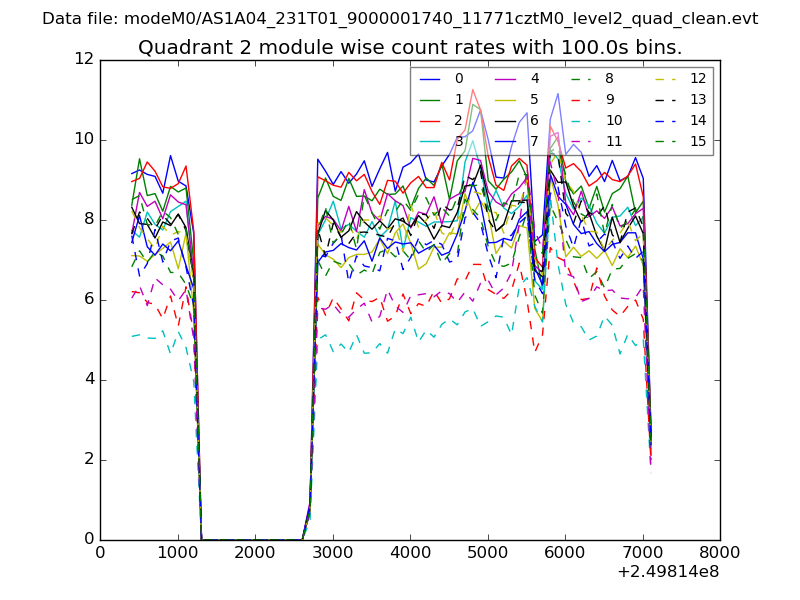
| Module-wise count rates for Quadrant B Data is divided into 100 sec bins |
 |
 |
| Module-wise count rates for Quadrant C Data is divided into 100 sec bins |
 |
 |
| Module-wise count rates for Quadrant D Data is divided into 100 sec bins |
 |
 |
| Parameter | Plot |
|---|---|
| CZT HV Monitor | 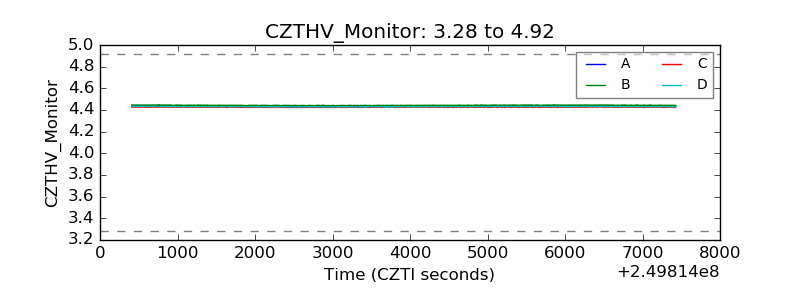 |
| D_VDD |  |
| Temperature 1 | 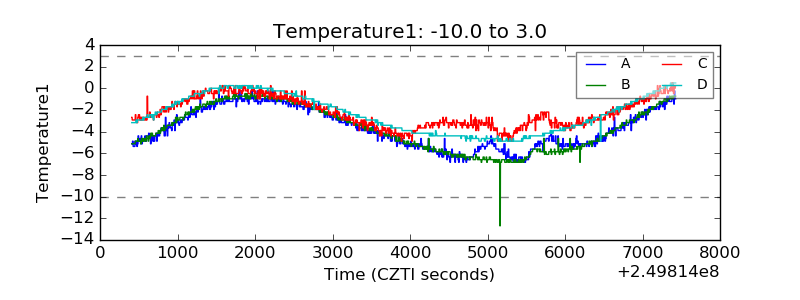 |
| Veto HV Monitor | 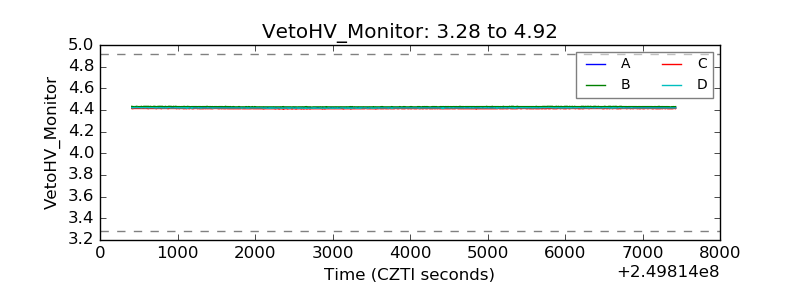 |
| Veto LLD | 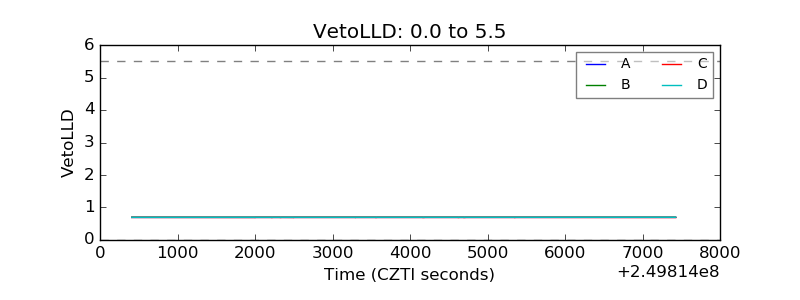 |
| Alpha Counter | 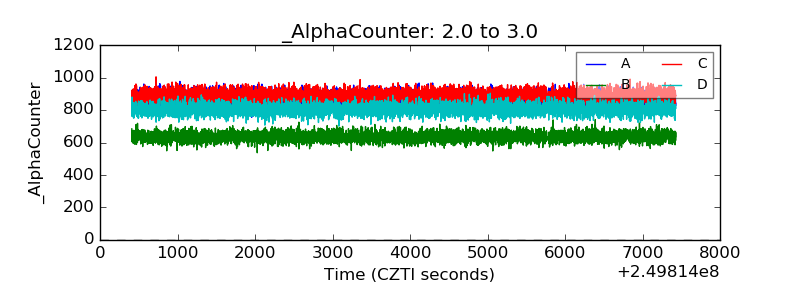 |
| _CPM_Rate | 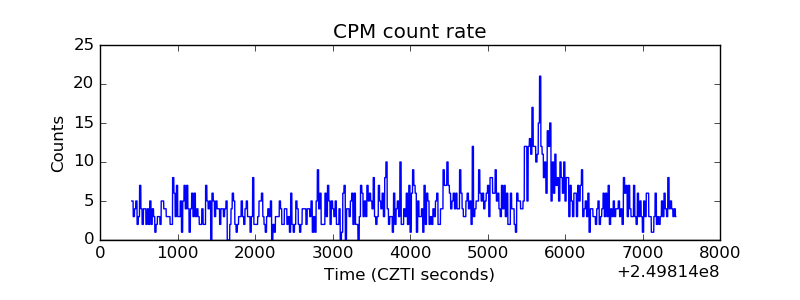 |
| CZT Counter | 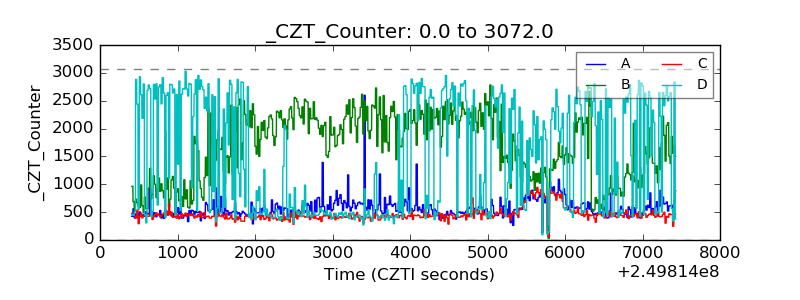 |
| +2.5 Volts monitor | 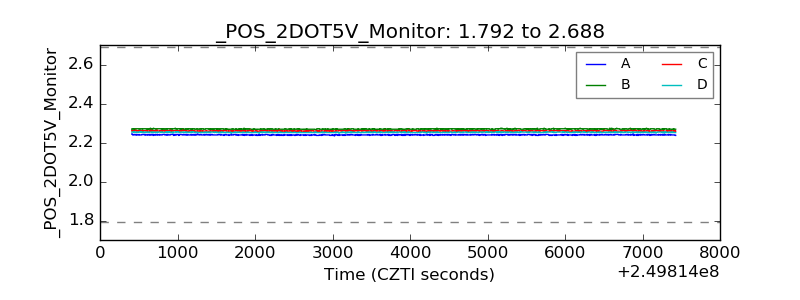 |
| +5 Volts monitor |  |
| _ROLL_ROT | 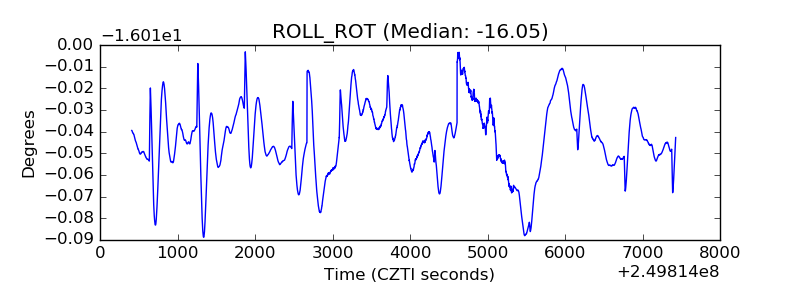 |
| _Roll_DEC | 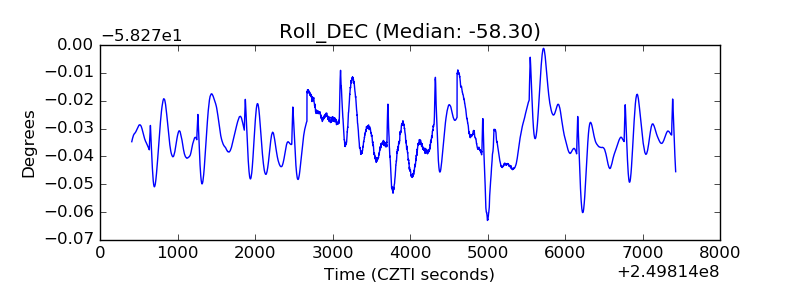 |
| _Roll_RA | 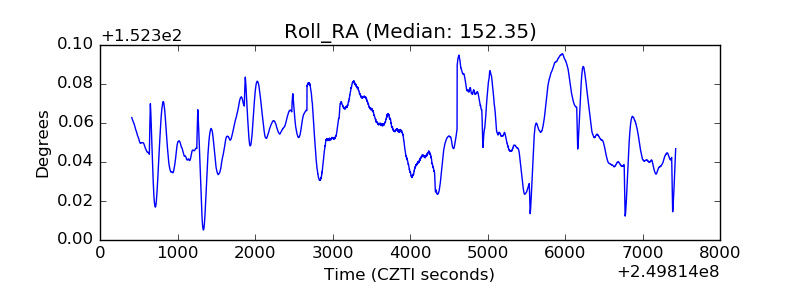 |
| Veto Counter | 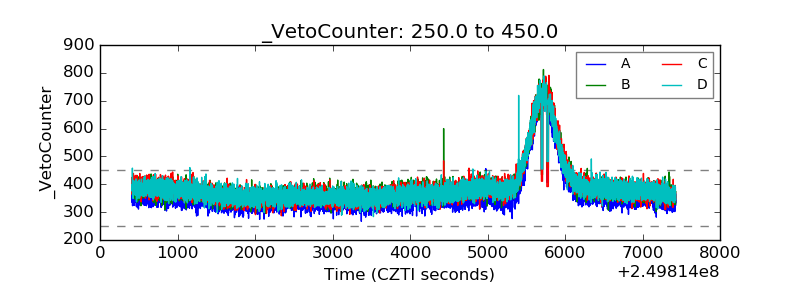 |