| Param | Original file | Final file |
|---|---|---|
| Filename | modeM0/AS1A04_231T01_9000001740_11772cztM0_level2.evt | modeM0/AS1A04_231T01_9000001740_11772cztM0_level2_quad_clean.evt |
| Size (bytes) | 1,015,185,600 | 90,665,280 |
| Size | 968.2 MB | 86.5 MB |
| Events in quadrant A | 5,368,312 | 597,691 |
| Events in quadrant B | 11,812,310 | 538,681 |
| Events in quadrant C | 3,412,980 | 620,295 |
| Events in quadrant D | 9,650,552 | 469,167 |
| Mode SS | |||
|---|---|---|---|
| Quadrant | BADHDUFLAG | Total packets | Discarded packets |
| A | 0 | 148 | 0 |
| B | 0 | 148 | 0 |
| C | 0 | 148 | 0 |
| D | 0 | 148 | 0 |
| Mode M0 | |||
|---|---|---|---|
| Quadrant | BADHDUFLAG | Total packets | Discarded packets |
| A | 0 | 20888 | 1 |
| B | 0 | 40278 | 0 |
| C | 0 | 15499 | 0 |
| D | 0 | 33790 | 0 |
| Quadrant | Total seconds | Saturated seconds | Saturation percentage |
|---|---|---|---|
| A | 7446 | 639 | 8.581789% |
| B | 7446 | 2192 | 29.438625% |
| C | 7446 | 125 | 1.678754% |
| D | 7446 | 2610 | 35.052377% |
Noise dominated data is calculated using 1-second bins in cleaned event files. If a bin has >2000 counts, and if more than 50% of those come from <1% of pixels, then it is considered to be noise-dominated and hence unusable.
| Quadrant | # 1 sec bins | Bins with >0 counts | Bins with >2000 counts | High rate bins dominated by noise | Noise dominated (total time) | Noise dominated (detector-on time) | Marked lightcurve |
|---|---|---|---|---|---|---|---|
| A | 7447 | 7447 | 293 | 293 | 3.93% | 3.93% | 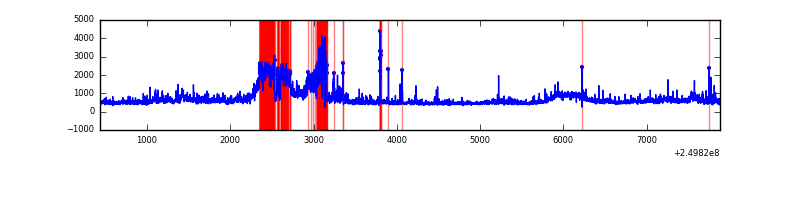 |
| B | 7447 | 7447 | 1271 | 1271 | 17.07% | 17.07% | 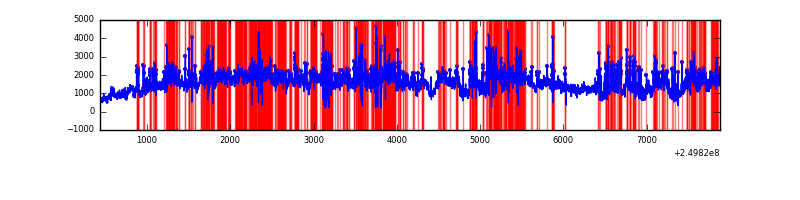 |
| C | 7447 | 7447 | 3 | 3 | 0.04% | 0.04% | 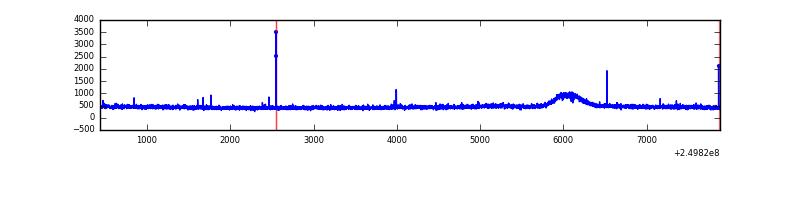 |
| D | 7447 | 7447 | 1964 | 1964 | 26.37% | 26.37% | 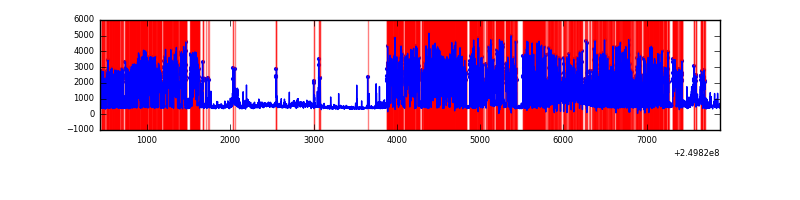 |
Top three noisy pixels from each quadrant. If the there are fewer than three noisy pixels in the level2.evt file, extra rows are filled as -1
| Pixel properties | Quadrant properties | ||||||
|---|---|---|---|---|---|---|---|
| Quadrant | DetID | PixID | Counts | Sigma | Mean | Median | Sigma |
| A | 8 | 15 | 1399436 | 7814.02 | 865 | 842 | 179.0 |
| A | 5 | 16 | 304382 | 1695.9 | 865 | 842 | 179.0 |
| A | 1 | 162 | 109240 | 605.63 | 865 | 842 | 179.0 |
| B | 10 | 16 | 6194907 | 40018.2 | 805 | 784 | 154.8 |
| B | 4 | 239 | 904827 | 5840.73 | 805 | 784 | 154.8 |
| B | 3 | 64 | 768379 | 4959.18 | 805 | 784 | 154.8 |
| C | 0 | 207 | 11425 | 52.44 | 865 | 866 | 201.3 |
| C | 8 | 128 | 9128 | 41.03 | 865 | 866 | 201.3 |
| C | 8 | 112 | 6530 | 28.13 | 865 | 866 | 201.3 |
| D | 1 | 52 | 6103435 | 34707.21 | 722 | 700 | 175.8 |
| D | 10 | 199 | 201244 | 1140.53 | 722 | 700 | 175.8 |
| D | 8 | 195 | 155703 | 881.53 | 722 | 700 | 175.8 |
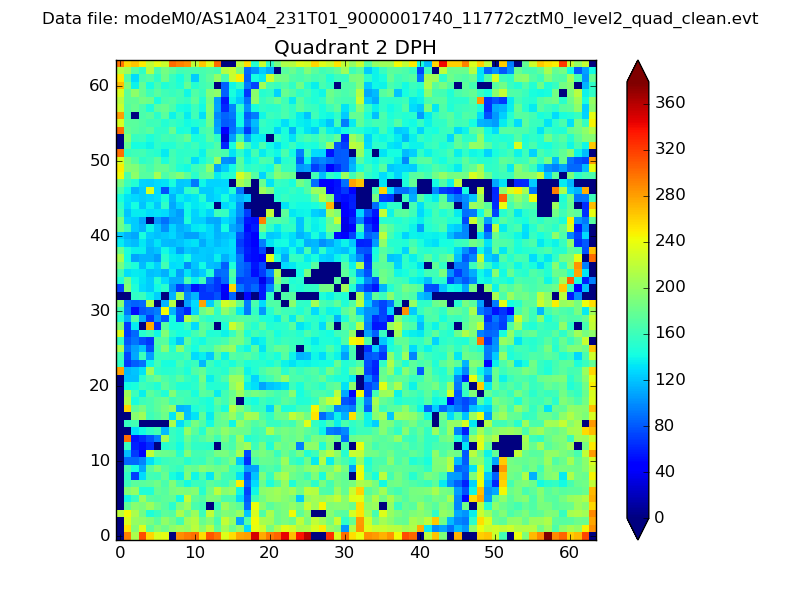
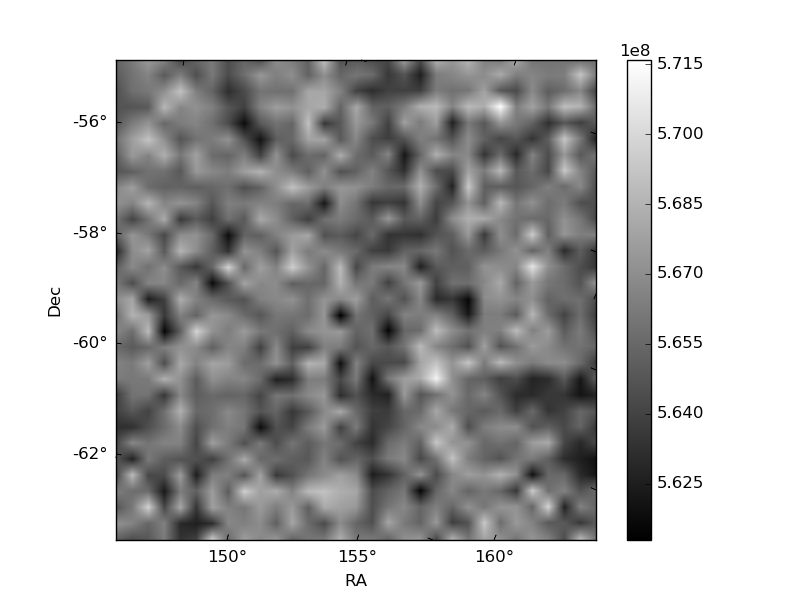
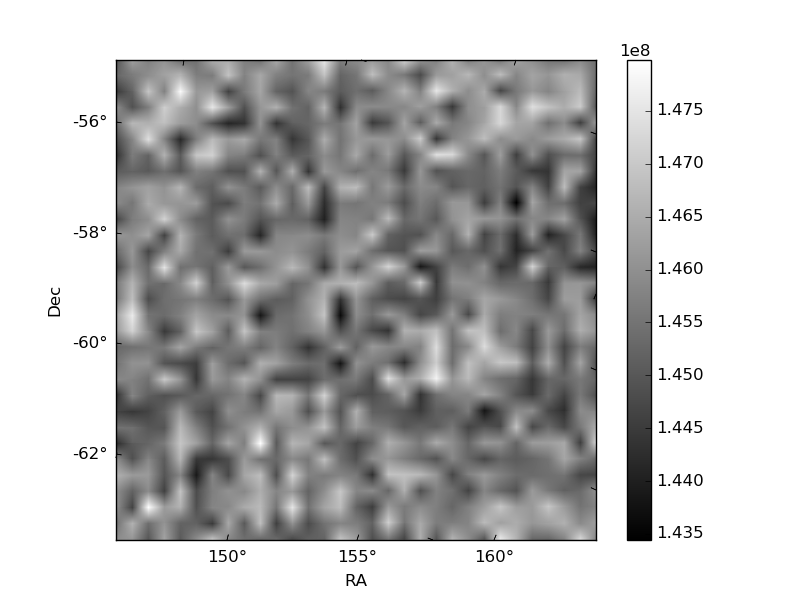
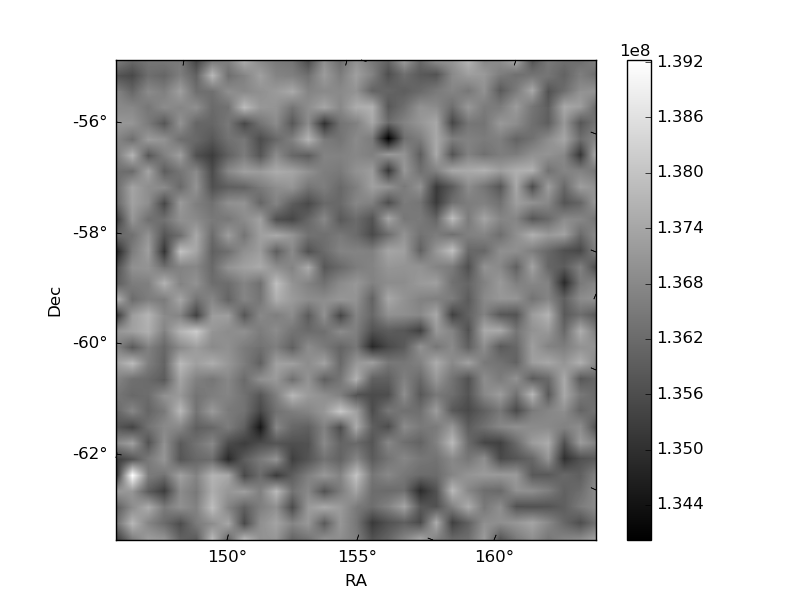
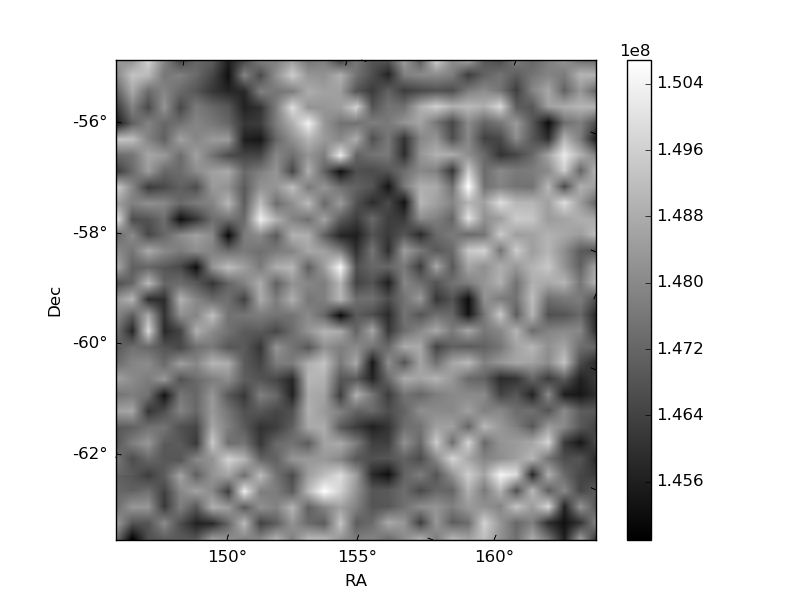
Histogram calculated using DETX and DETY for each event in the final _common_clean file
| Quadrant A | 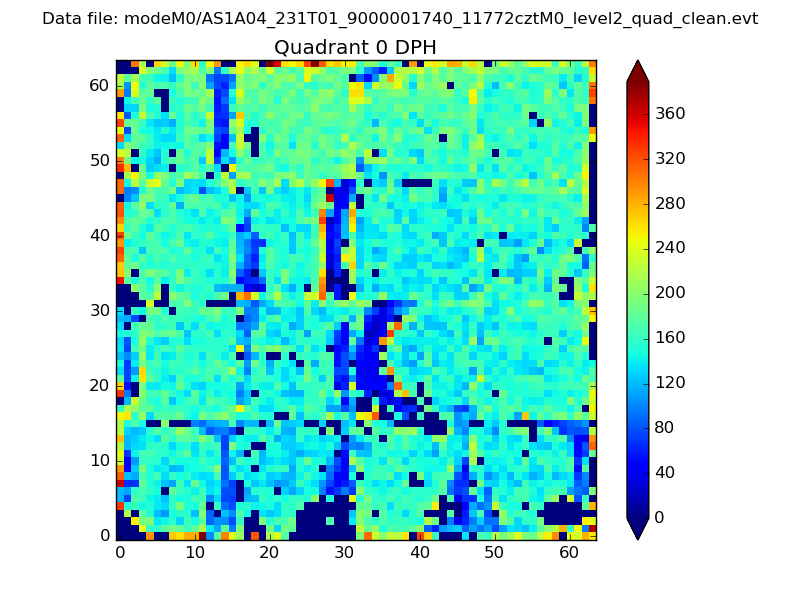 |
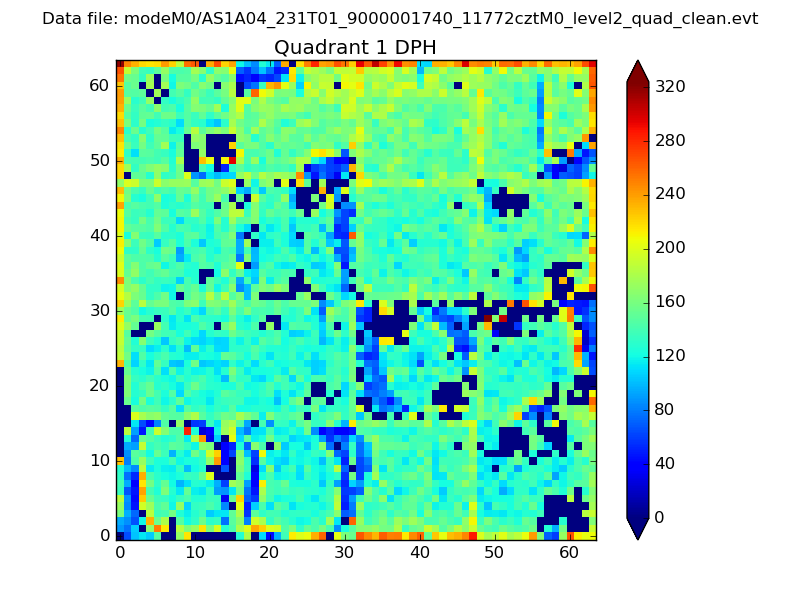 |
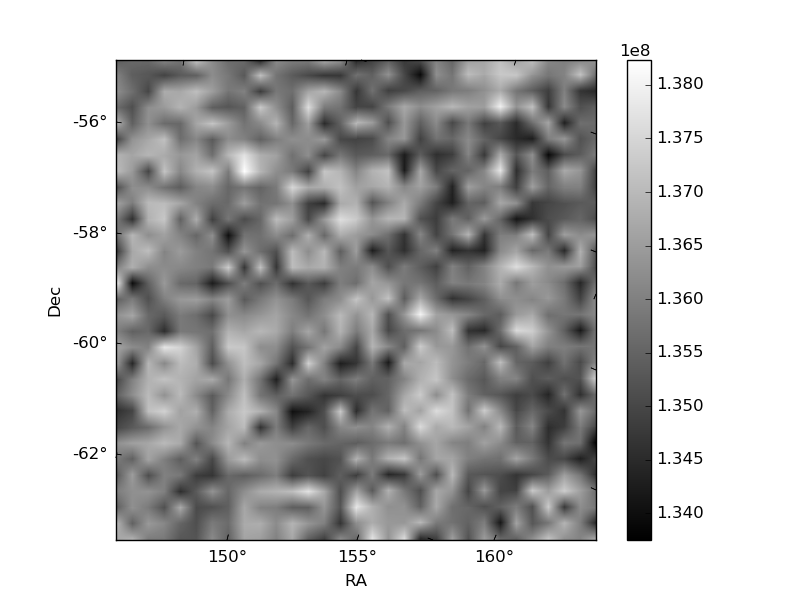
Quadrant B |
|---|---|---|---|
| Quadrant D | 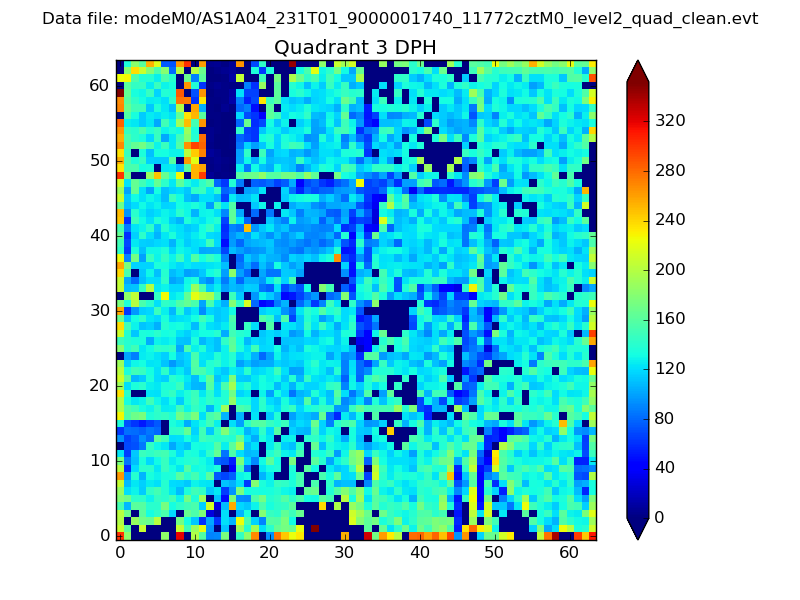 |
 |
Quadrant C |
| Plot type | Count rate plots | Images |
|---|---|---|
| Comparison with Poisson distribution Blue bars denote a histogram of data divided into 1 sec bins. Red curve is a Poisson curve with rate = median count rate of data. |
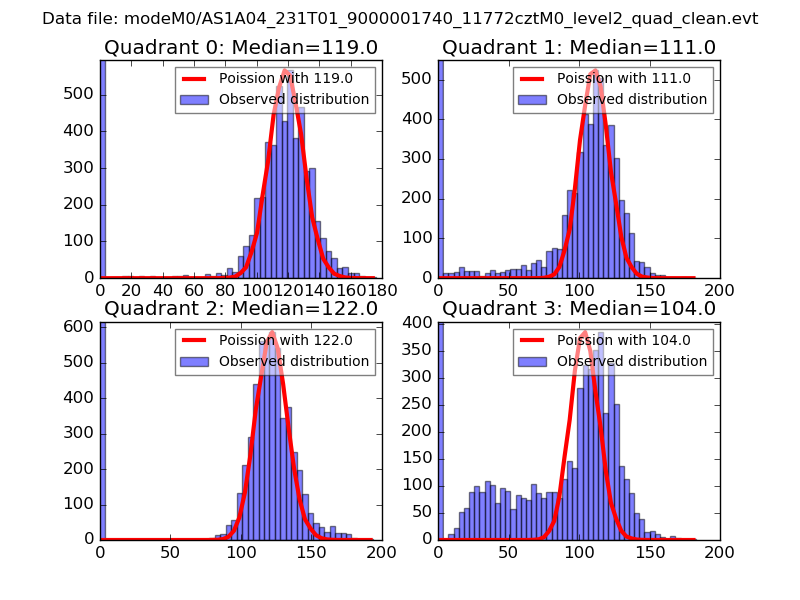 |
 |
| Quadrant-wise count rates Data is divided into 100 sec bins |
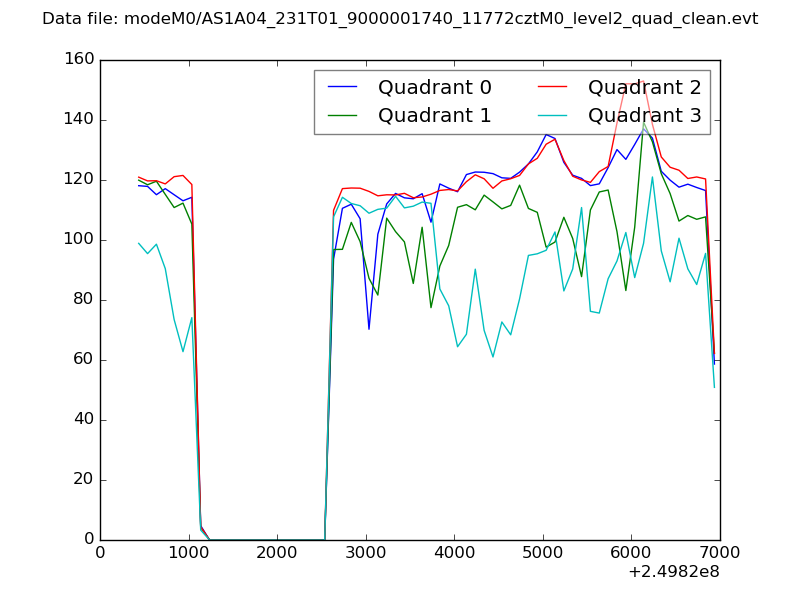 |
|
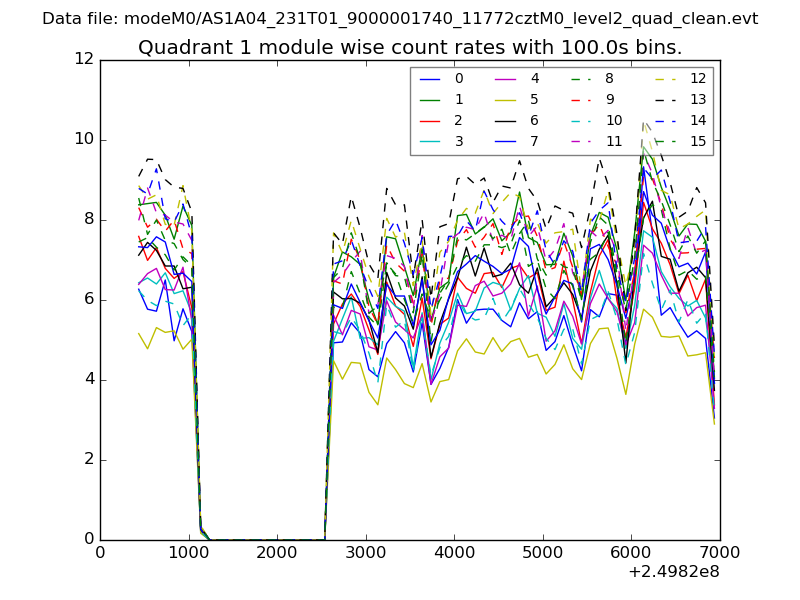
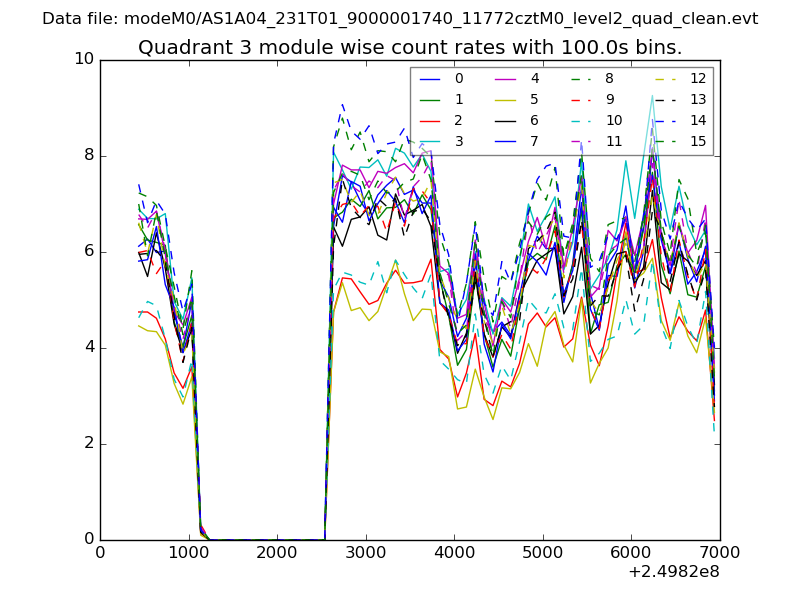
| Module-wise count rates for Quadrant A Data is divided into 100 sec bins |
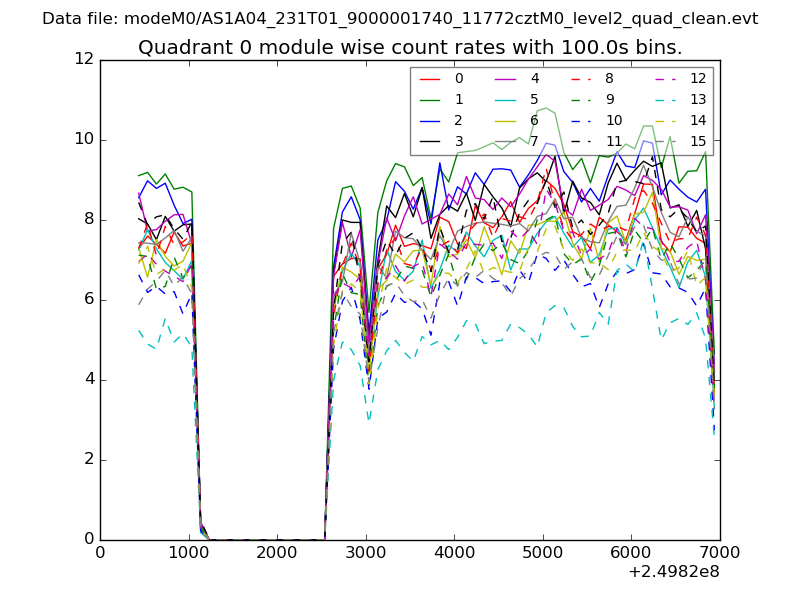 |
 |
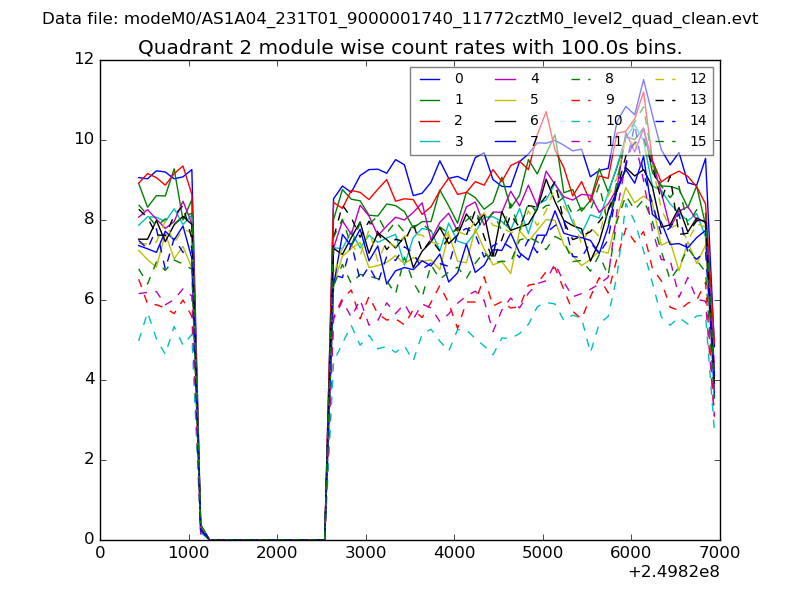
| Module-wise count rates for Quadrant B Data is divided into 100 sec bins |
 |
 |
| Module-wise count rates for Quadrant C Data is divided into 100 sec bins |
 |
 |
| Module-wise count rates for Quadrant D Data is divided into 100 sec bins |
 |
 |
| Parameter | Plot |
|---|---|
| CZT HV Monitor | 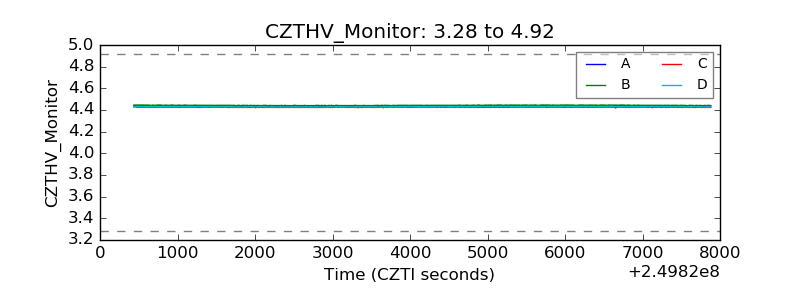 |
| D_VDD | 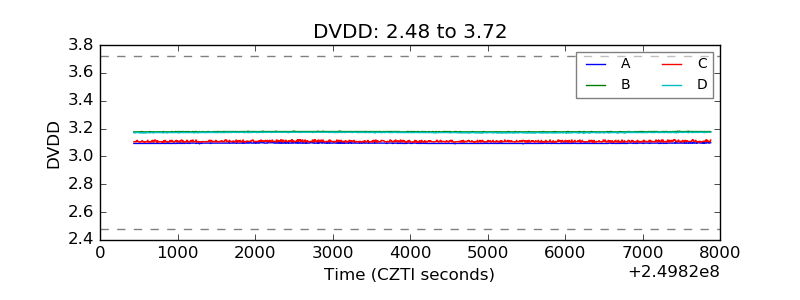 |
| Temperature 1 | 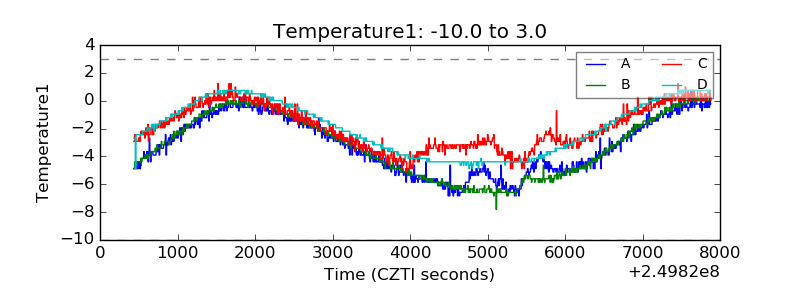 |
| Veto HV Monitor | 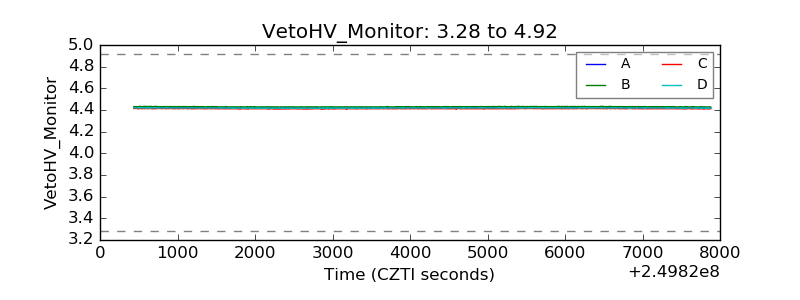 |
| Veto LLD | 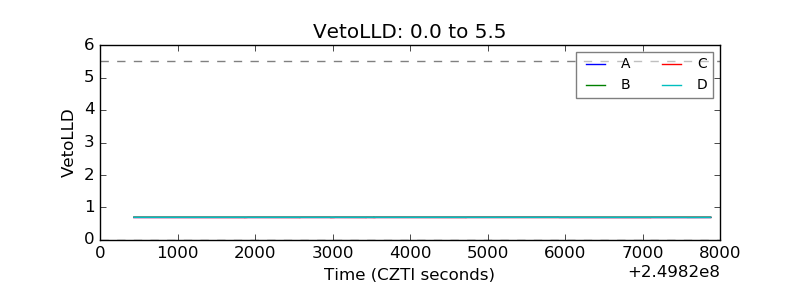 |
| Alpha Counter | 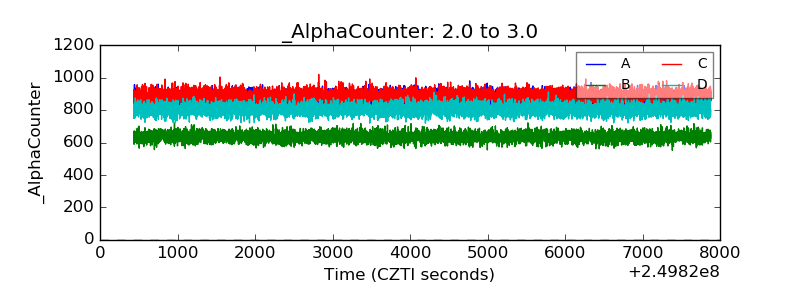 |
| _CPM_Rate | 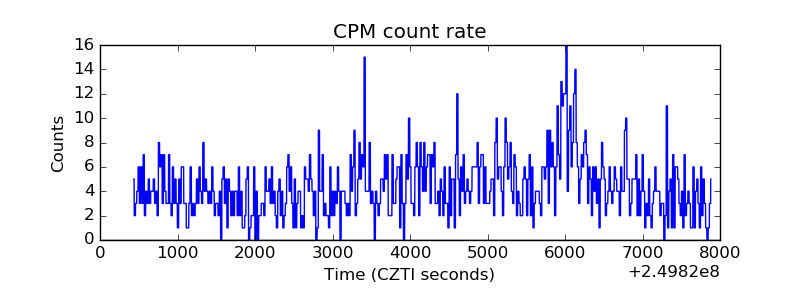 |
| CZT Counter | 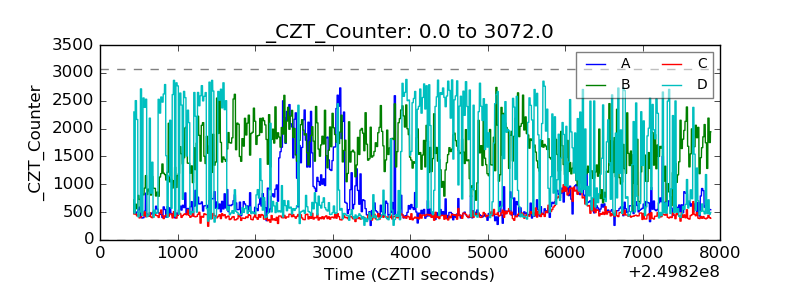 |
| +2.5 Volts monitor | 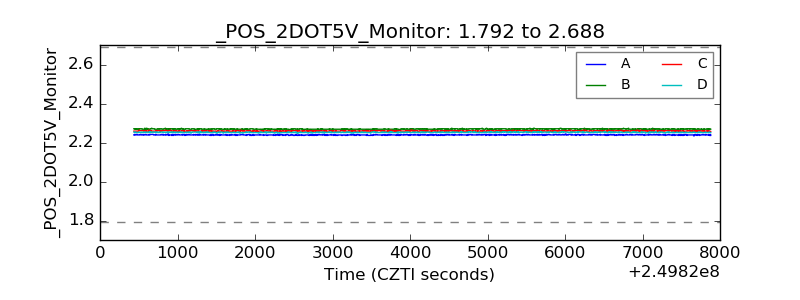 |
| +5 Volts monitor |  |
| _ROLL_ROT | 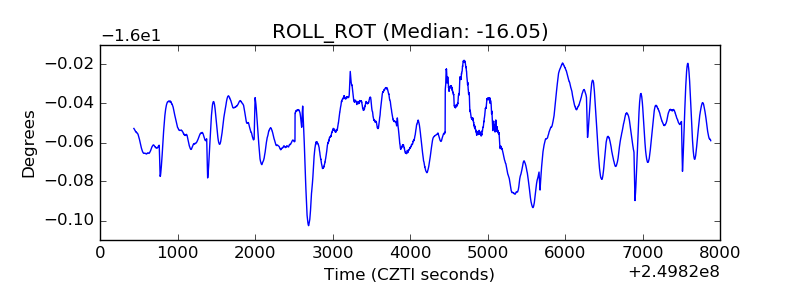 |
| _Roll_DEC | 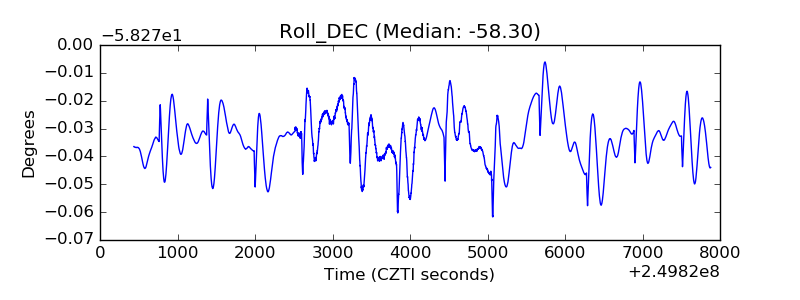 |
| _Roll_RA | 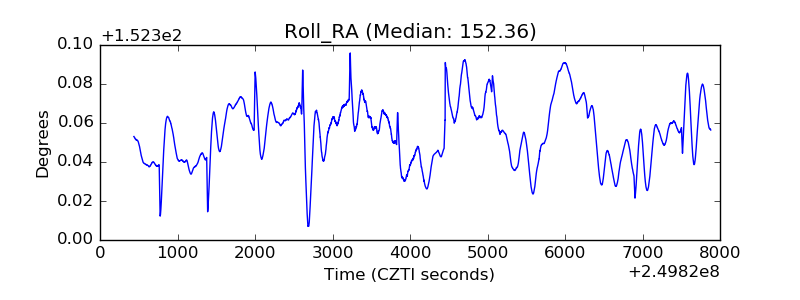 |
| Veto Counter | 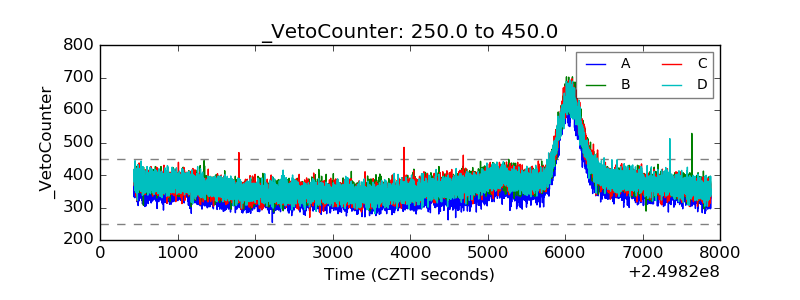 |