| Param | Original file | Final file |
|---|---|---|
| Filename | modeM0/AS1A04_231T01_9000001740_11773cztM0_level2.evt | modeM0/AS1A04_231T01_9000001740_11773cztM0_level2_quad_clean.evt |
| Size (bytes) | 445,455,360 | 40,294,080 |
| Size | 424.8 MB | 38.4 MB |
| Events in quadrant A | 2,327,184 | 248,871 |
| Events in quadrant B | 6,073,803 | 226,947 |
| Events in quadrant C | 1,546,357 | 253,206 |
| Events in quadrant D | 3,292,964 | 229,040 |
| Mode SS | |||
|---|---|---|---|
| Quadrant | BADHDUFLAG | Total packets | Discarded packets |
| A | 0 | 74 | 0 |
| B | 0 | 74 | 0 |
| C | 0 | 74 | 0 |
| D | 0 | 74 | 0 |
| Mode M0 | |||
|---|---|---|---|
| Quadrant | BADHDUFLAG | Total packets | Discarded packets |
| A | 0 | 9461 | 0 |
| B | 0 | 20582 | 0 |
| C | 0 | 7418 | 0 |
| D | 0 | 12317 | 0 |
| Quadrant | Total seconds | Saturated seconds | Saturation percentage |
|---|---|---|---|
| A | 3692 | 35 | 0.947996% |
| B | 3692 | 947 | 25.650054% |
| C | 3692 | 0 | 0.000000% |
| D | 3692 | 497 | 13.461538% |
Noise dominated data is calculated using 1-second bins in cleaned event files. If a bin has >2000 counts, and if more than 50% of those come from <1% of pixels, then it is considered to be noise-dominated and hence unusable.
| Quadrant | # 1 sec bins | Bins with >0 counts | Bins with >2000 counts | High rate bins dominated by noise | Noise dominated (total time) | Noise dominated (detector-on time) | Marked lightcurve |
|---|---|---|---|---|---|---|---|
| A | 3693 | 3693 | 13 | 13 | 0.35% | 0.35% |  |
| B | 3693 | 3693 | 709 | 709 | 19.20% | 19.20% | 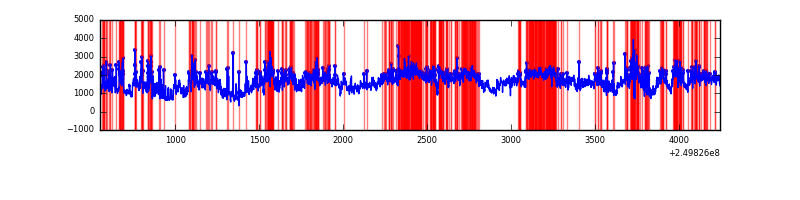 |
| C | 3693 | 3693 | 1 | 1 | 0.03% | 0.03% | 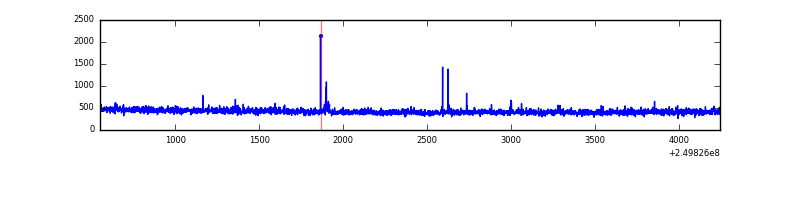 |
| D | 3693 | 3693 | 417 | 417 | 11.29% | 11.29% | 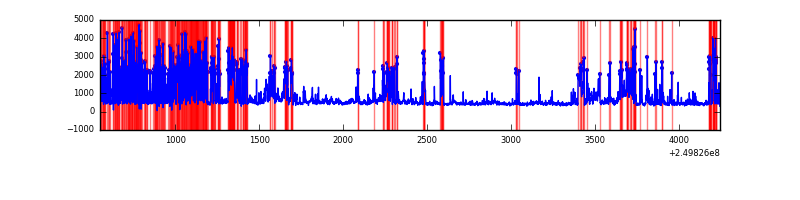 |
Top three noisy pixels from each quadrant. If the there are fewer than three noisy pixels in the level2.evt file, extra rows are filled as -1
| Pixel properties | Quadrant properties | ||||||
|---|---|---|---|---|---|---|---|
| Quadrant | DetID | PixID | Counts | Sigma | Mean | Median | Sigma |
| A | 8 | 15 | 437367 | 5189.24 | 401 | 392 | 84.2 |
| A | 1 | 162 | 87907 | 1039.27 | 401 | 392 | 84.2 |
| A | 5 | 16 | 79481 | 939.21 | 401 | 392 | 84.2 |
| B | 10 | 16 | 3579926 | 48354.56 | 381 | 372 | 74.0 |
| B | 4 | 239 | 401656 | 5420.76 | 381 | 372 | 74.0 |
| B | 15 | 204 | 198505 | 2676.49 | 381 | 372 | 74.0 |
| C | 14 | 236 | 8428 | 87.15 | 390 | 391 | 92.2 |
| C | 0 | 207 | 4683 | 46.54 | 390 | 391 | 92.2 |
| C | 8 | 128 | 3910 | 38.16 | 390 | 391 | 92.2 |
| D | 1 | 52 | 1189049 | 12976.42 | 370 | 357 | 91.6 |
| D | 13 | 122 | 189146 | 2060.93 | 370 | 357 | 91.6 |
| D | 13 | 104 | 121685 | 1324.48 | 370 | 357 | 91.6 |
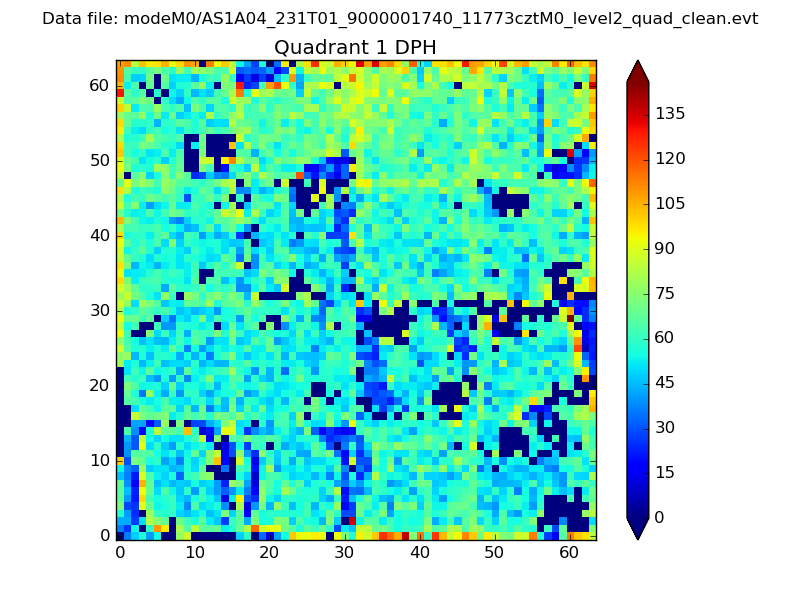
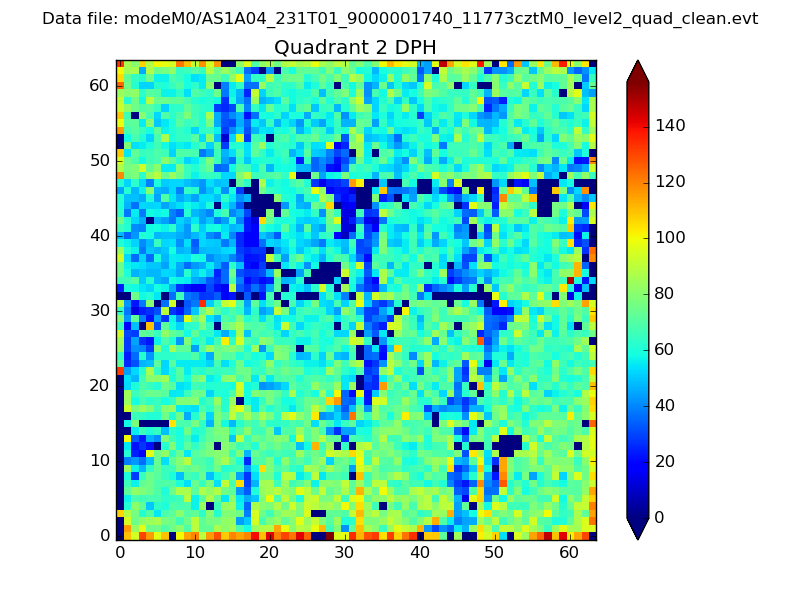
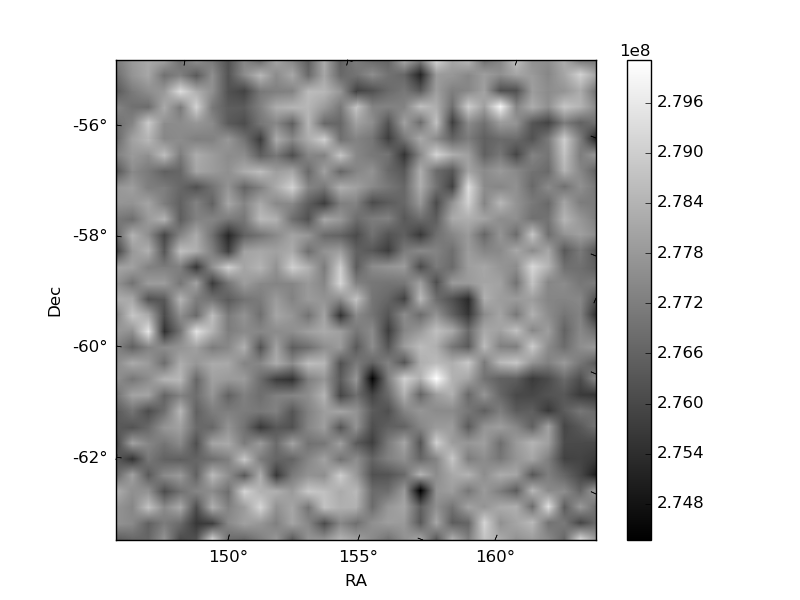
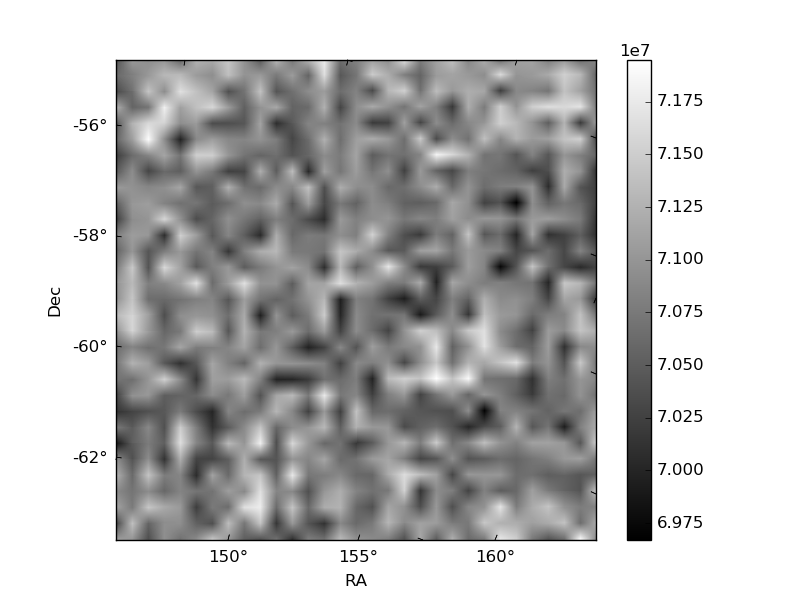
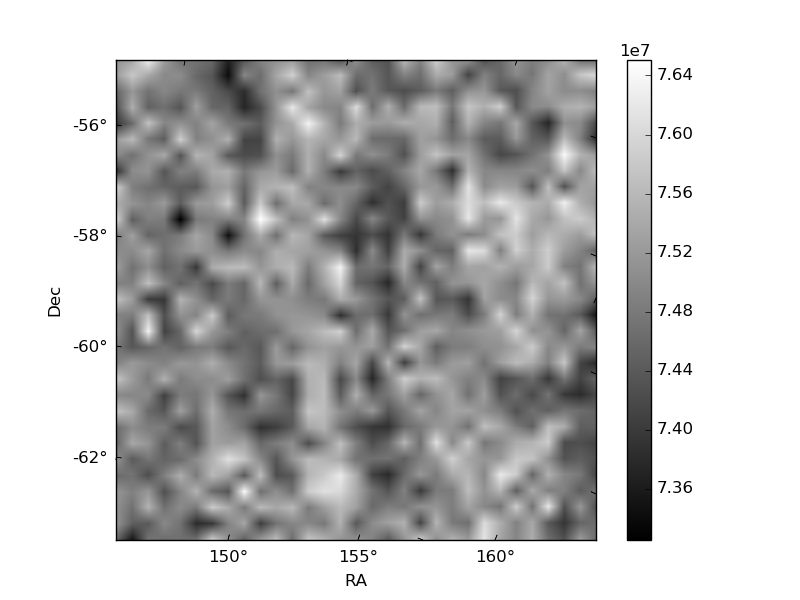
Histogram calculated using DETX and DETY for each event in the final _common_clean file
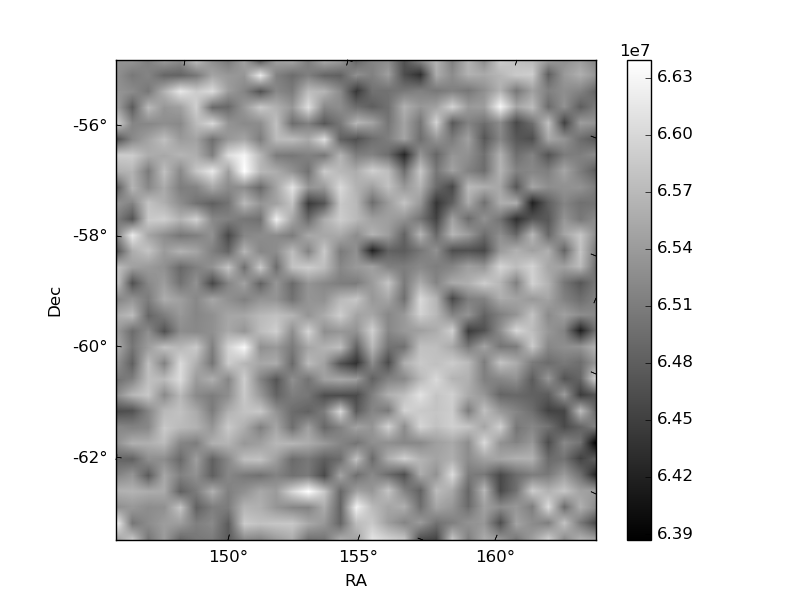
| Quadrant A | 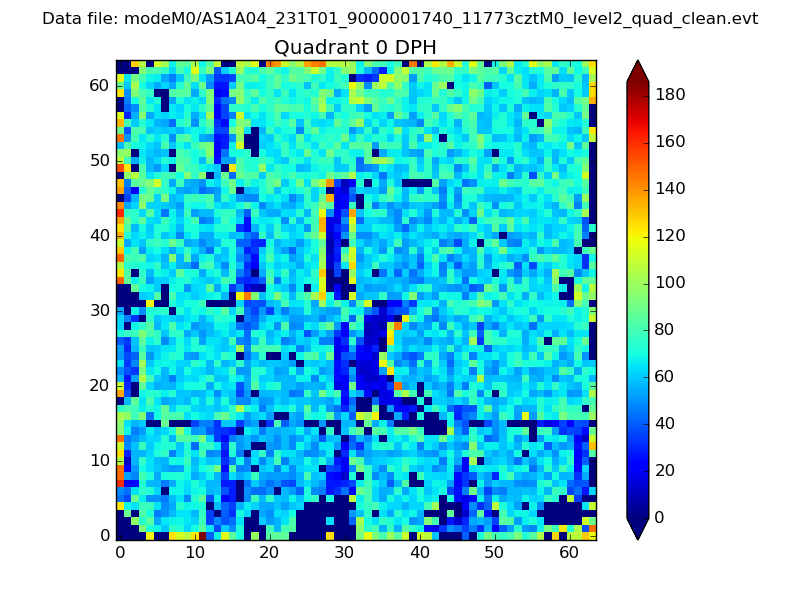 |
 |
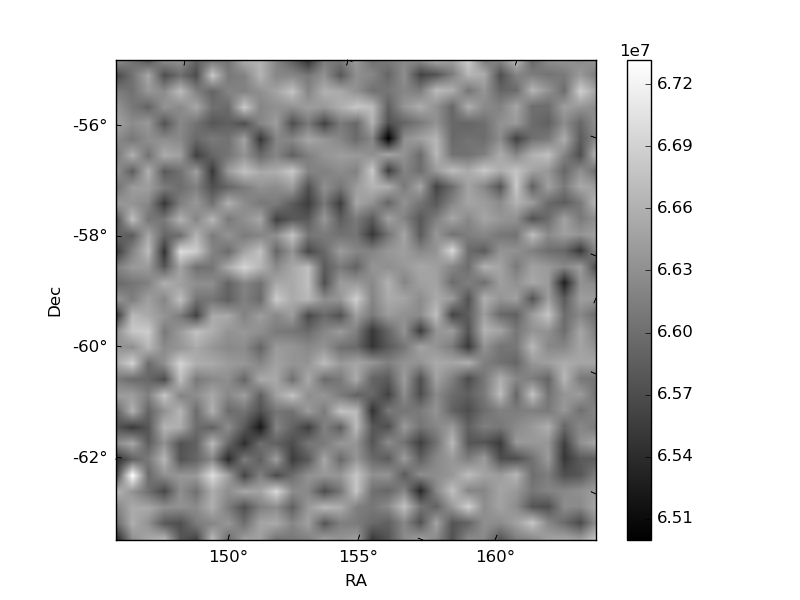
Quadrant B |
|---|---|---|---|
| Quadrant D | 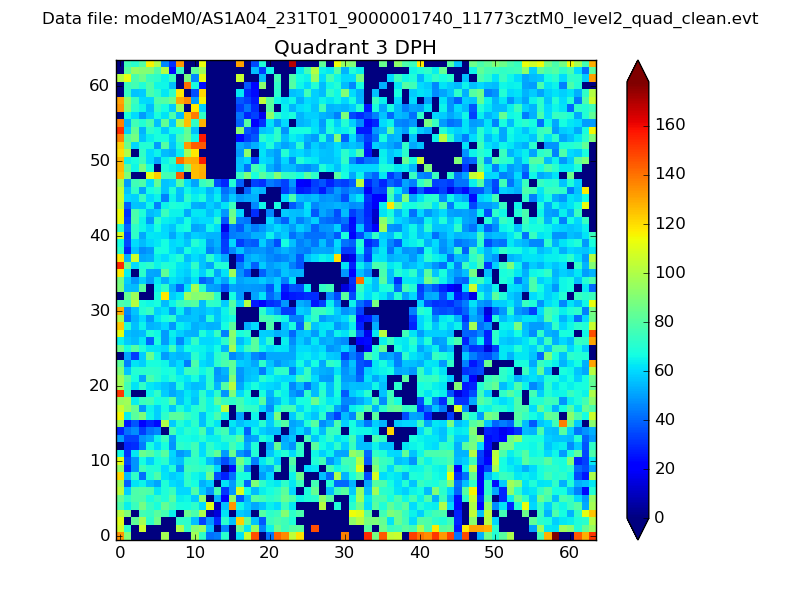 |
 |
Quadrant C |
| Plot type | Count rate plots | Images |
|---|---|---|
| Comparison with Poisson distribution Blue bars denote a histogram of data divided into 1 sec bins. Red curve is a Poisson curve with rate = median count rate of data. |
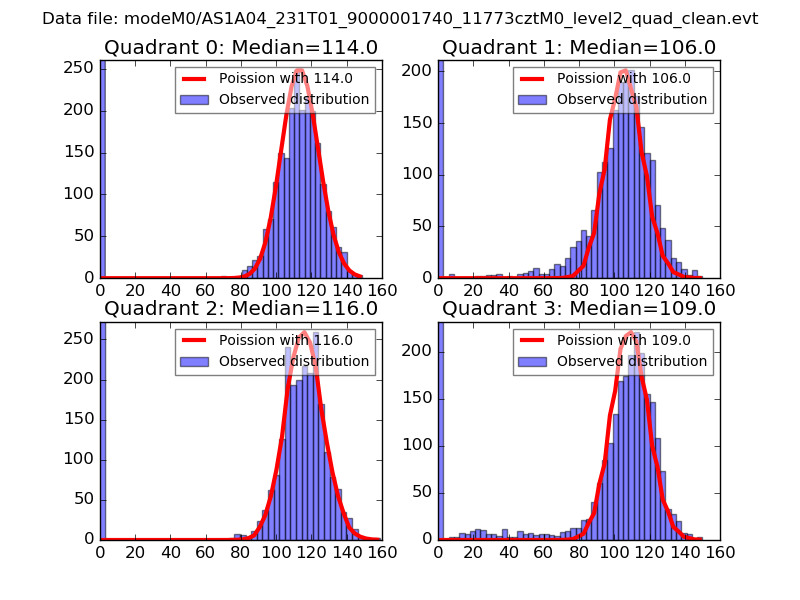 |
 |
| Quadrant-wise count rates Data is divided into 100 sec bins |
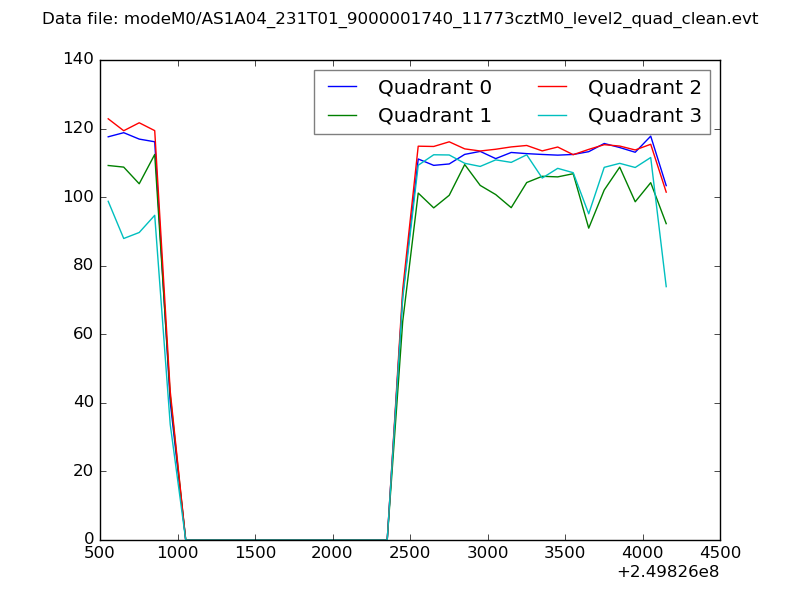 |
|
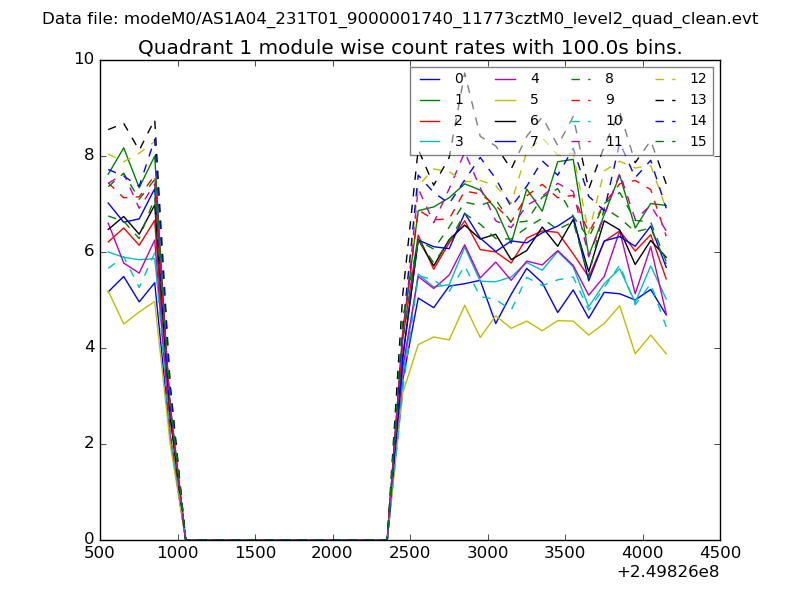
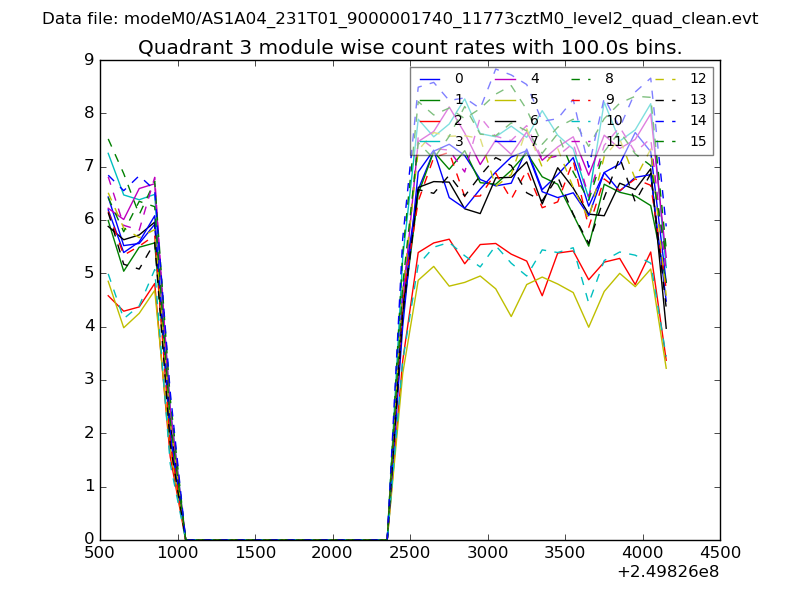
| Module-wise count rates for Quadrant A Data is divided into 100 sec bins |
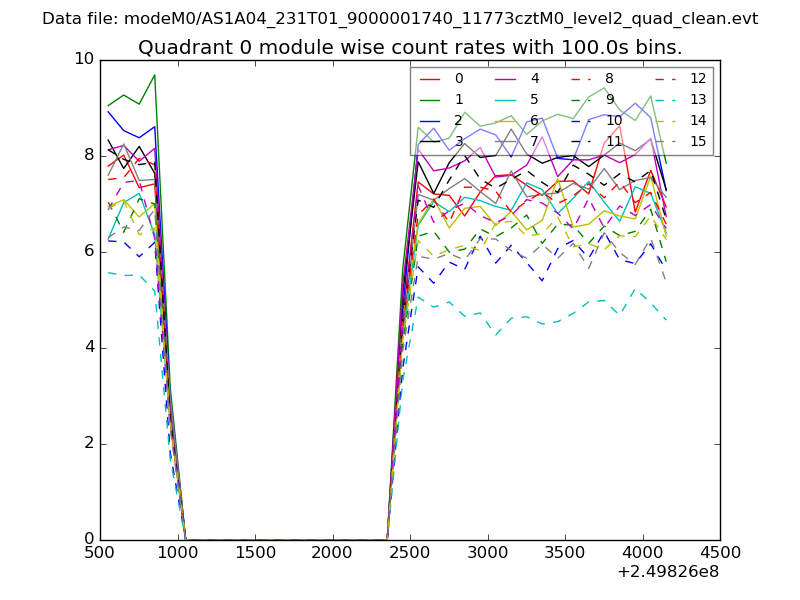 |
 |
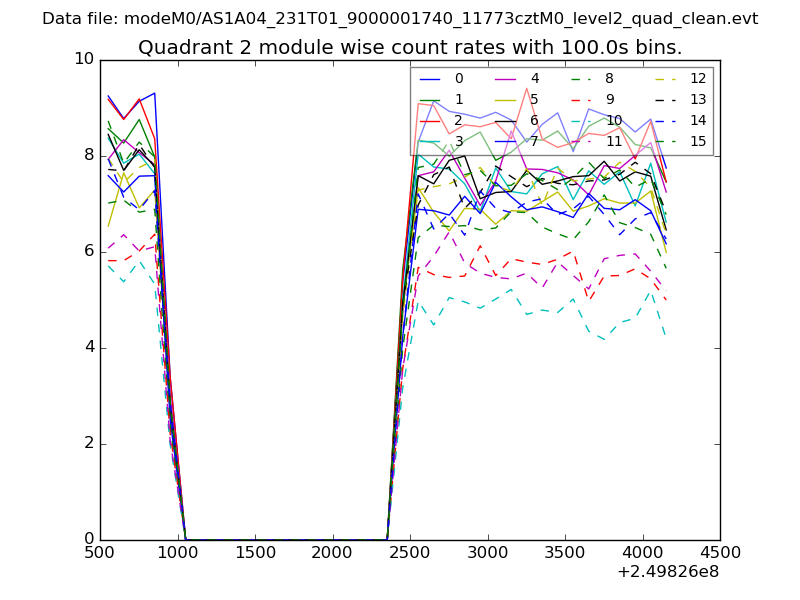
| Module-wise count rates for Quadrant B Data is divided into 100 sec bins |
 |
 |
| Module-wise count rates for Quadrant C Data is divided into 100 sec bins |
 |
 |
| Module-wise count rates for Quadrant D Data is divided into 100 sec bins |
 |
 |
| Parameter | Plot |
|---|---|
| CZT HV Monitor | 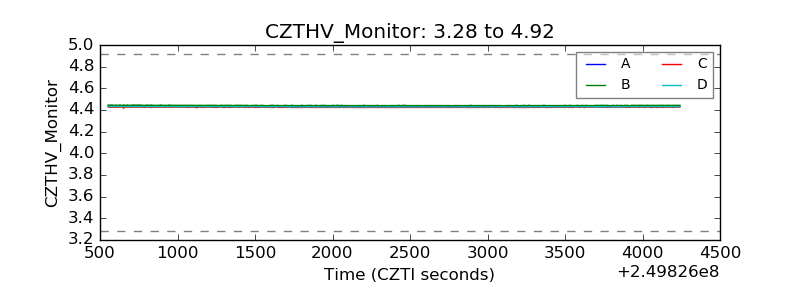 |
| D_VDD |  |
| Temperature 1 | 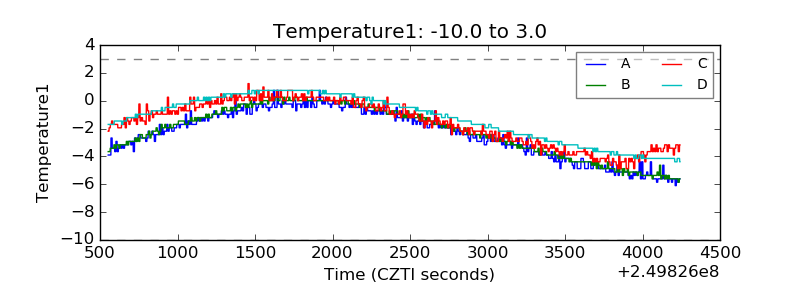 |
| Veto HV Monitor | 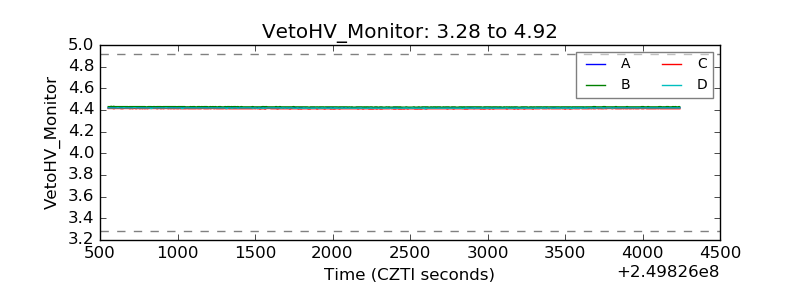 |
| Veto LLD | 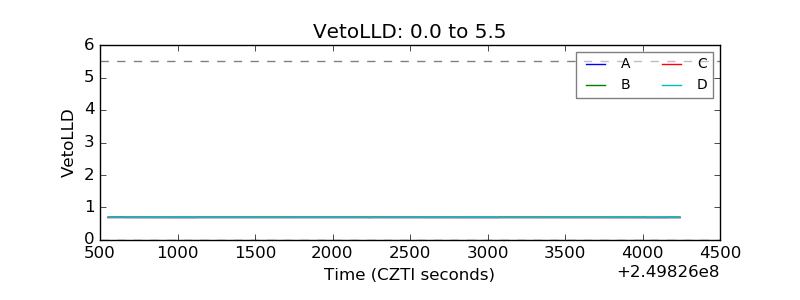 |
| Alpha Counter | 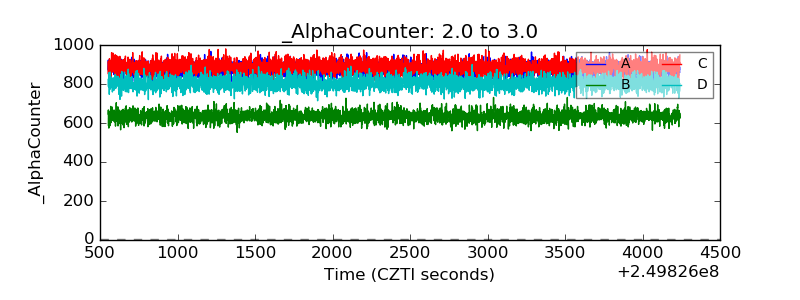 |
| _CPM_Rate | 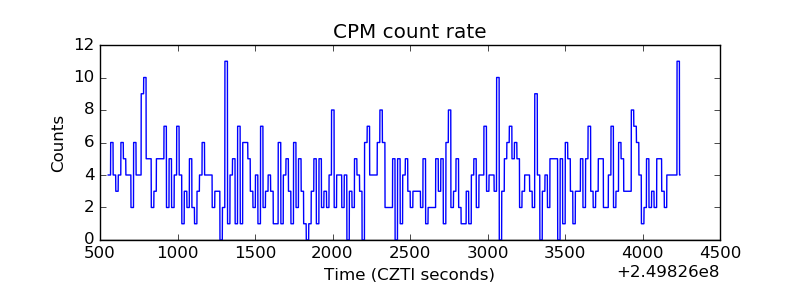 |
| CZT Counter | 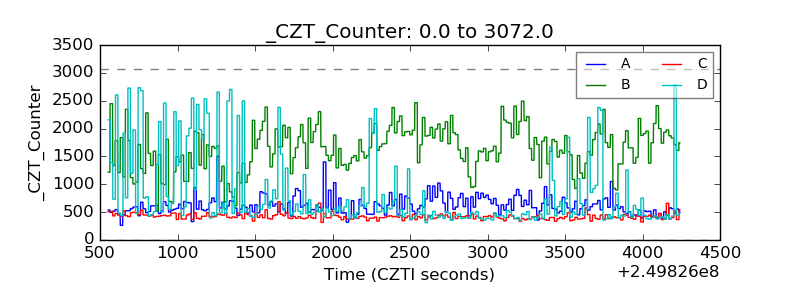 |
| +2.5 Volts monitor |  |
| +5 Volts monitor |  |
| _ROLL_ROT | 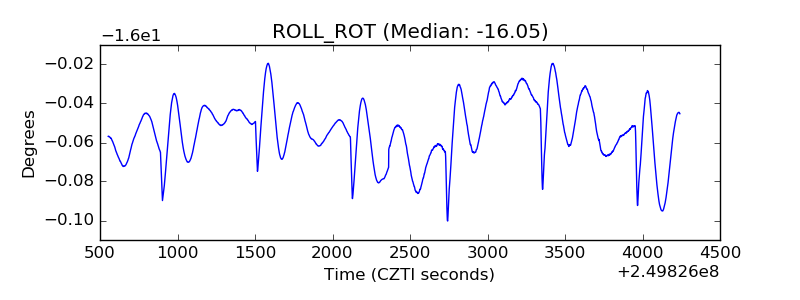 |
| _Roll_DEC |  |
| _Roll_RA | 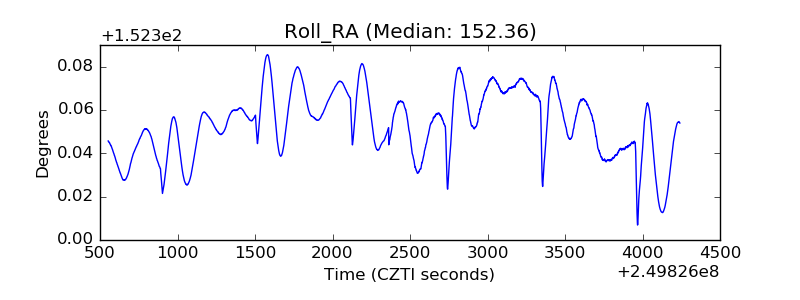 |
| Veto Counter | 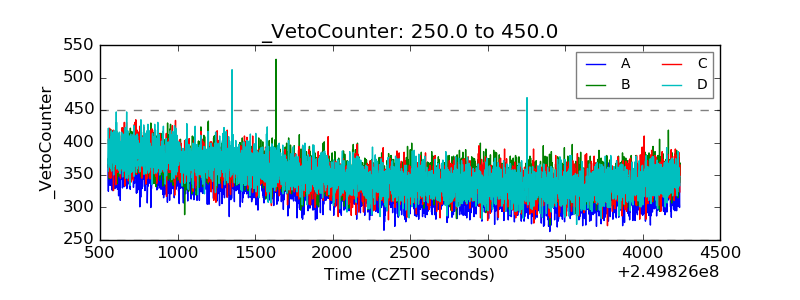 |