| Param | Original file | Final file |
|---|---|---|
| Filename | modeM0/AS1C03_024T01_9000001742cztM0_level2.fits | modeM0/AS1C03_024T01_9000001742cztM0_level2_quad_clean.evt |
| Size (bytes) | 683,896,320 | 644,014,080 |
| Size | 652.2 MB | 614.2 MB |
| Events in quadrant A | 4,161,736 | 3,908,149 |
| Events in quadrant B | 3,873,194 | 3,428,345 |
| Events in quadrant C | 4,167,226 | 3,787,031 |
| Events in quadrant D | 3,518,798 | 3,394,237 |
| Mode M0 | |||
|---|---|---|---|
| Quadrant | BADHDUFLAG | Total packets | Discarded packets |
| A | 0 | 170693 | 0 |
| B | 0 | 255225 | 0 |
| C | 0 | 149983 | 0 |
| D | 0 | 196783 | 0 |
| Mode M9 | |||
|---|---|---|---|
| Quadrant | BADHDUFLAG | Total packets | Discarded packets |
| A | 0 | 112 | 0 |
| B | 0 | 112 | 0 |
| C | 0 | 112 | 0 |
| D | 0 | 112 | 0 |
| Mode SS | |||
|---|---|---|---|
| Quadrant | BADHDUFLAG | Total packets | Discarded packets |
| A | 0 | 1476 | 0 |
| B | 0 | 1476 | 0 |
| C | 0 | 1474 | 0 |
| D | 0 | 1476 | 0 |
| Quadrant | Total seconds | Saturated seconds | Saturation percentage |
|---|---|---|---|
| A | 72695 | 2055 | 2.826879% |
| B | 72725 | 8513 | 11.705741% |
| C | 72717 | 565 | 0.776985% |
| D | 72724 | 3497 | 4.808591% |
Noise dominated data is calculated using 1-second bins in cleaned event files. If a bin has >2000 counts, and if more than 50% of those come from <1% of pixels, then it is considered to be noise-dominated and hence unusable.
| Quadrant | # 1 sec bins | Bins with >0 counts | Bins with >2000 counts | High rate bins dominated by noise | Noise dominated (total time) | Noise dominated (detector-on time) | Marked lightcurve |
|---|---|---|---|---|---|---|---|
| A | 84073 | 72641 | 0 | 0 | 0.00% | 0.00% |  |
| B | 84073 | 72717 | 0 | 0 | 0.00% | 0.00% |  |
| C | 84073 | 72745 | 0 | 0 | 0.00% | 0.00% | 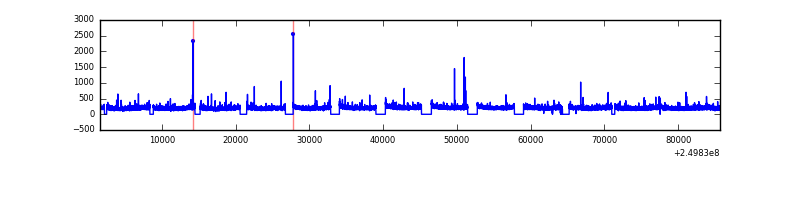 |
| D | 84073 | 72700 | 0 | 0 | 0.00% | 0.00% |  |
Top three noisy pixels from each quadrant. If the there are fewer than three noisy pixels in the level2.evt file, extra rows are filled as -1
| Pixel properties | Quadrant properties | ||||||
|---|---|---|---|---|---|---|---|
| Quadrant | DetID | PixID | Counts | Sigma | Mean | Median | Sigma |
| A | 0 | 29 | 4066 | 11.32 | 1084 | 1012 | 269.7 |
| A | 7 | 110 | 3377 | 8.77 | 1084 | 1012 | 269.7 |
| A | 0 | 30 | 3076 | 7.65 | 1084 | 1012 | 269.7 |
| B | 2 | 9 | 3345 | 11.64 | 1023 | 973 | 203.8 |
| B | 3 | 17 | 2627 | 8.12 | 1023 | 973 | 203.8 |
| B | 14 | 254 | 2569 | 7.83 | 1023 | 973 | 203.8 |
| C | 1 | 81 | 3039 | 7.04 | 1100 | 1023 | 286.5 |
| C | 1 | 80 | 2963 | 6.77 | 1100 | 1023 | 286.5 |
| C | 12 | 241 | 2918 | 6.61 | 1100 | 1023 | 286.5 |
| D | 3 | 14 | 2630 | 6.36 | 1004 | 910 | 270.5 |
| D | 6 | 231 | 2613 | 6.3 | 1004 | 910 | 270.5 |
| D | 7 | 5 | 2523 | 5.96 | 1004 | 910 | 270.5 |
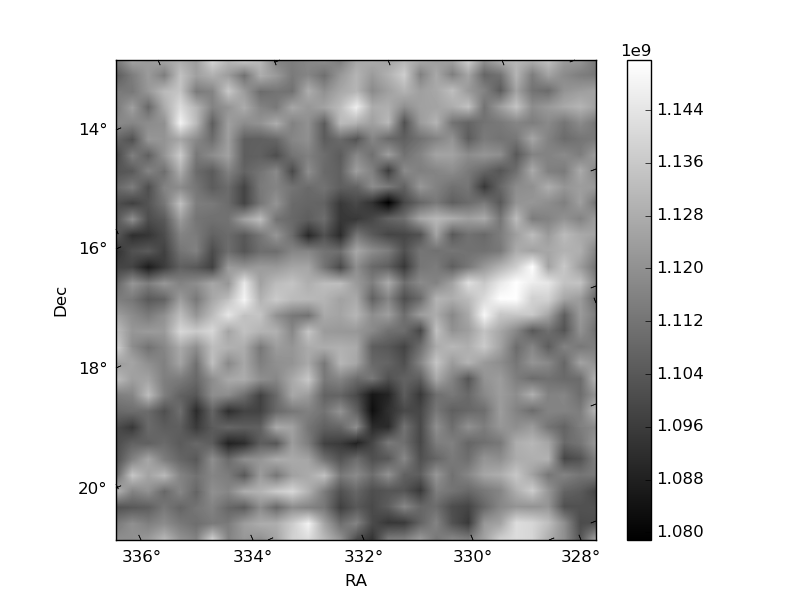
Histogram calculated using DETX and DETY for each event in the final _common_clean file
| Quadrant A | 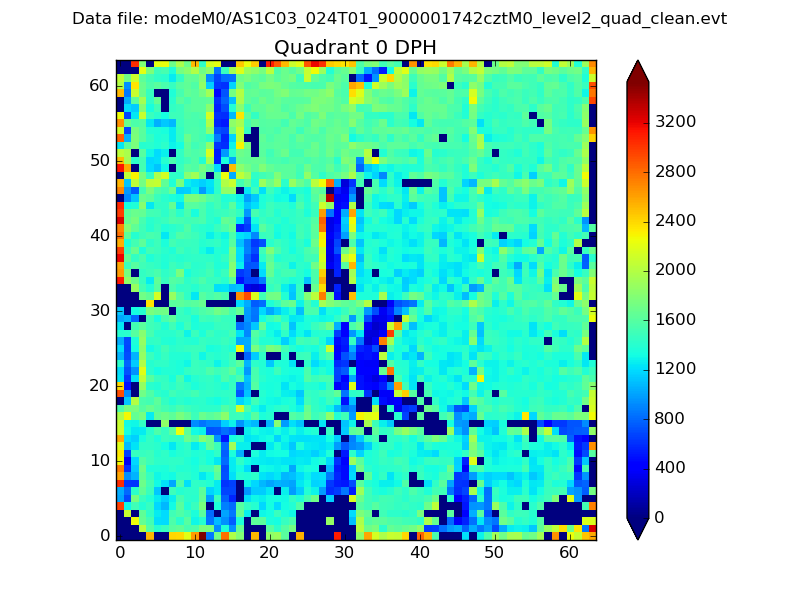 |
 |
Quadrant B |
|---|---|---|---|
| Quadrant D |  |
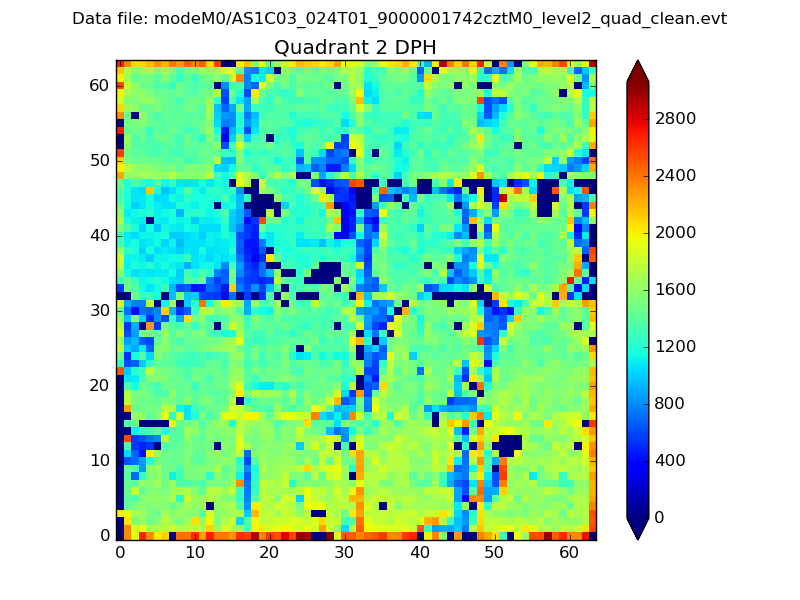 |
Quadrant C |
| Plot type | Count rate plots | Images |
|---|---|---|
| Comparison with Poisson distribution Blue bars denote a histogram of data divided into 1 sec bins. Red curve is a Poisson curve with rate = median count rate of data. |
 |
 |
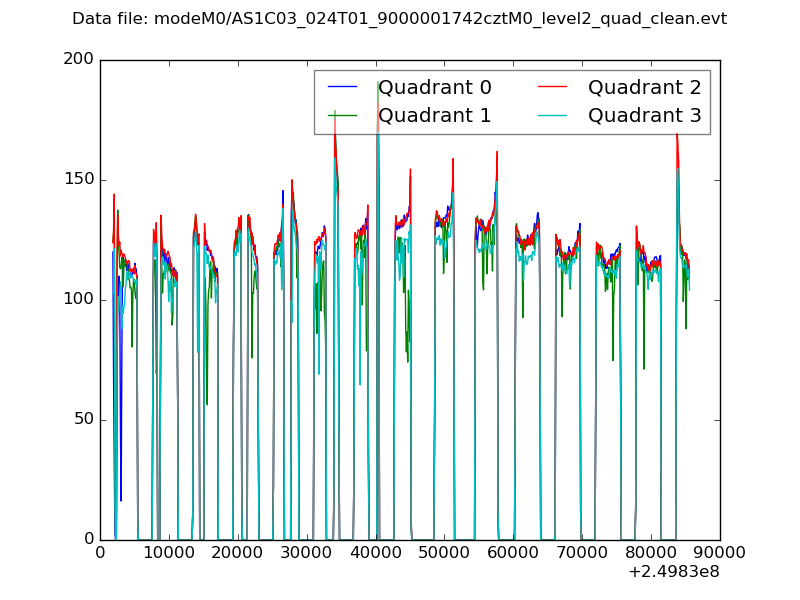
| Quadrant-wise count rates Data is divided into 100 sec bins |
 |
|
| Module-wise count rates for Quadrant A Data is divided into 100 sec bins |
 |
 |
| Module-wise count rates for Quadrant B Data is divided into 100 sec bins |
 |
 |
| Module-wise count rates for Quadrant C Data is divided into 100 sec bins |
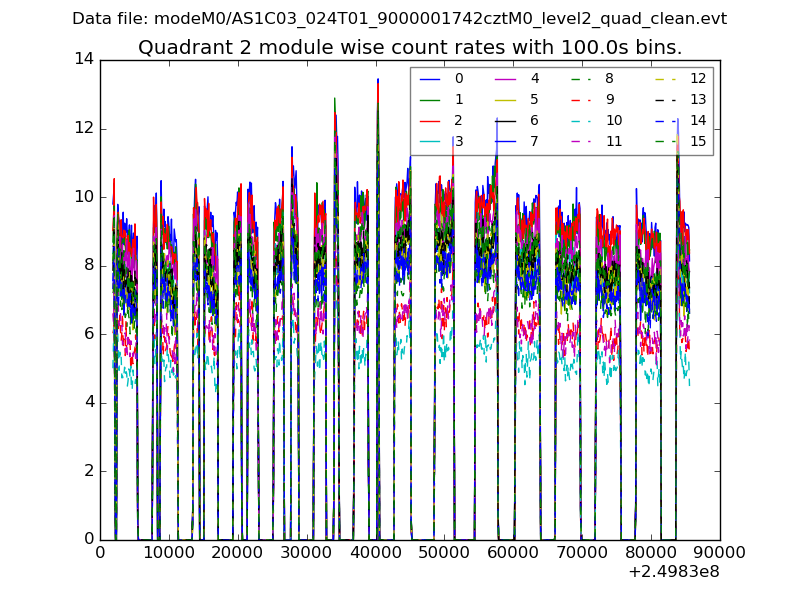 |
 |
| Module-wise count rates for Quadrant D Data is divided into 100 sec bins |
 |
 |
| Parameter | Plot |
|---|---|
| CZT HV Monitor |  |
| D_VDD | 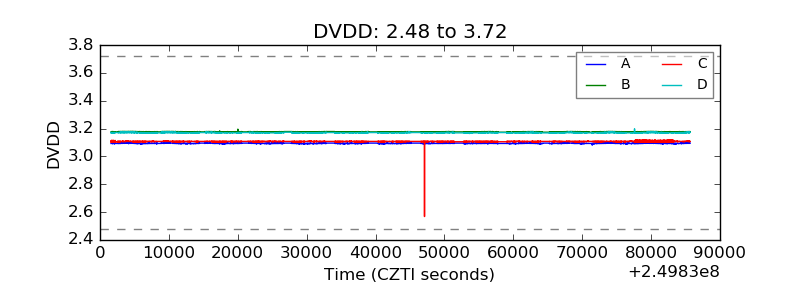 |
| Temperature 1 |  |
| Veto HV Monitor |  |
| Veto LLD | 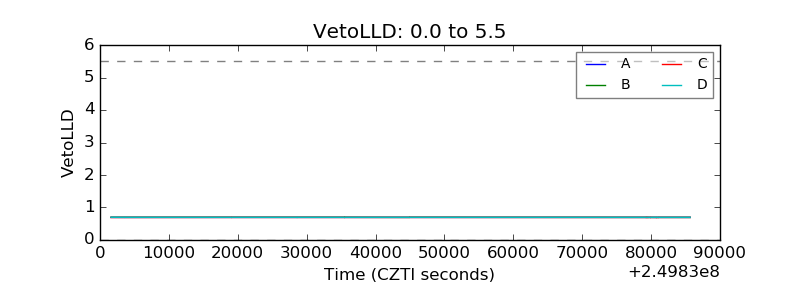 |
| Alpha Counter |  |
| _CPM_Rate | 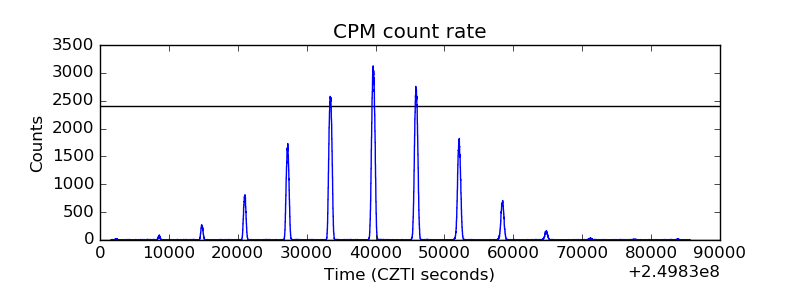 |
| CZT Counter |  |
| +2.5 Volts monitor |  |
| +5 Volts monitor |  |
| _ROLL_ROT | 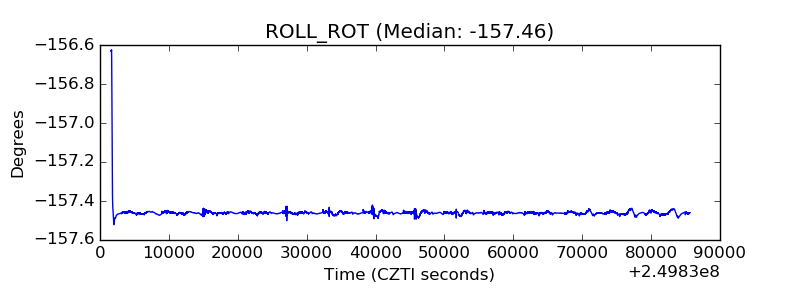 |
| _Roll_DEC | 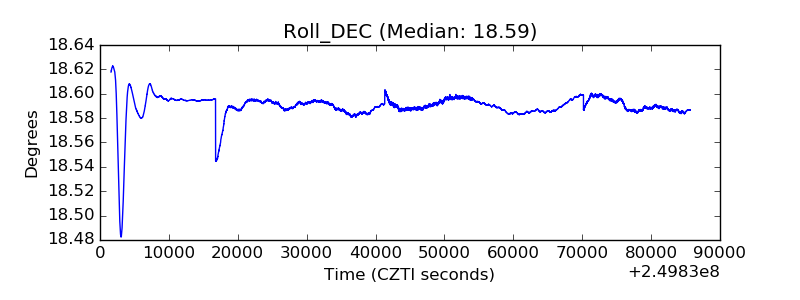 |
| _Roll_RA | 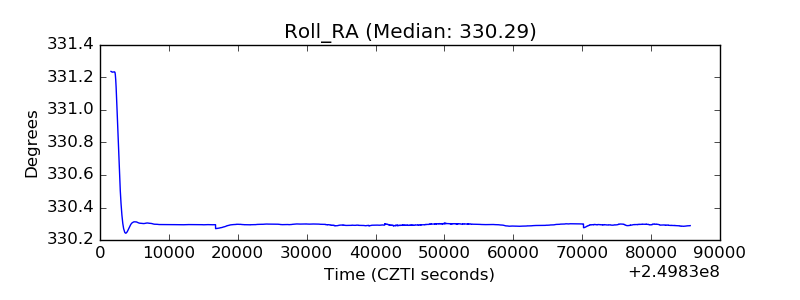 |
| Veto Counter |  |