| Param | Original file | Final file |
|---|---|---|
| Filename | modeM0/AS1C03_024T01_9000001742_11775cztM0_level2.evt | modeM0/AS1C03_024T01_9000001742_11775cztM0_level2_quad_clean.evt |
| Size (bytes) | 1,239,226,560 | 154,281,600 |
| Size | 1.2 GB | 147.1 MB |
| Events in quadrant A | 8,416,669 | 952,387 |
| Events in quadrant B | 13,759,790 | 913,402 |
| Events in quadrant C | 5,658,489 | 998,603 |
| Events in quadrant D | 8,835,522 | 925,042 |
| Mode M0 | |||
|---|---|---|---|
| Quadrant | BADHDUFLAG | Total packets | Discarded packets |
| A | 0 | 33774 | 3 |
| B | 0 | 49689 | 2 |
| C | 0 | 25962 | 2 |
| D | 0 | 35075 | 2 |
| Mode M9 | |||
|---|---|---|---|
| Quadrant | BADHDUFLAG | Total packets | Discarded packets |
| A | 0 | 12 | 0 |
| B | 0 | 12 | 0 |
| C | 0 | 12 | 0 |
| D | 0 | 12 | 0 |
| Mode SS | |||
|---|---|---|---|
| Quadrant | BADHDUFLAG | Total packets | Discarded packets |
| A | 0 | 258 | 0 |
| B | 0 | 258 | 0 |
| C | 0 | 258 | 0 |
| D | 0 | 258 | 0 |
| Quadrant | Total seconds | Saturated seconds | Saturation percentage |
|---|---|---|---|
| A | 12767 | 448 | 3.509047% |
| B | 12767 | 1649 | 12.916112% |
| C | 12767 | 49 | 0.383802% |
| D | 12767 | 723 | 5.663038% |
Noise dominated data is calculated using 1-second bins in cleaned event files. If a bin has >2000 counts, and if more than 50% of those come from <1% of pixels, then it is considered to be noise-dominated and hence unusable.
| Quadrant | # 1 sec bins | Bins with >0 counts | Bins with >2000 counts | High rate bins dominated by noise | Noise dominated (total time) | Noise dominated (detector-on time) | Marked lightcurve |
|---|---|---|---|---|---|---|---|
| A | 13953 | 12770 | 268 | 268 | 1.92% | 2.10% | 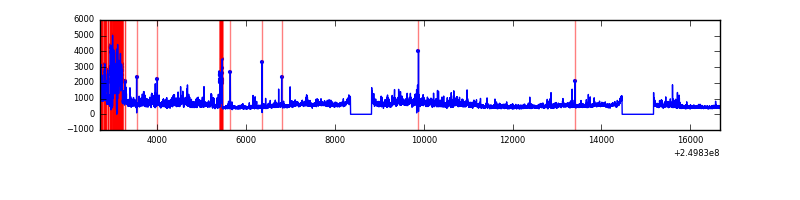 |
| B | 13953 | 12770 | 1027 | 1027 | 7.36% | 8.04% | 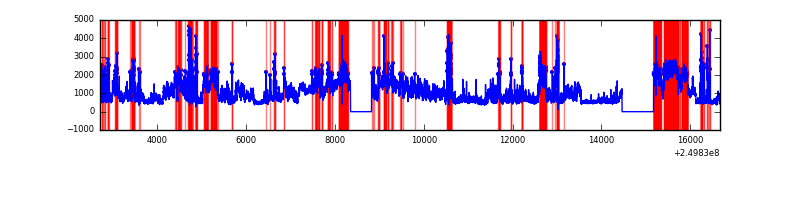 |
| C | 13953 | 12770 | 2 | 2 | 0.01% | 0.02% | 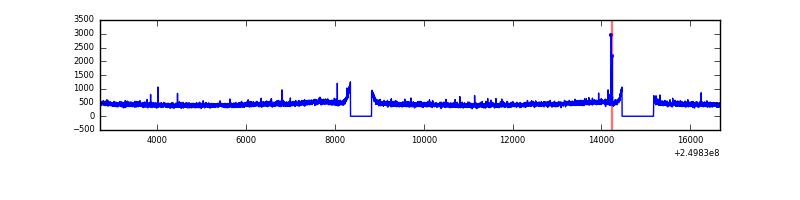 |
| D | 13953 | 12770 | 606 | 606 | 4.34% | 4.75% | 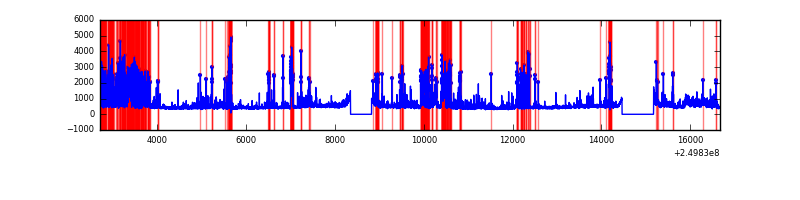 |
Top three noisy pixels from each quadrant. If the there are fewer than three noisy pixels in the level2.evt file, extra rows are filled as -1
| Pixel properties | Quadrant properties | ||||||
|---|---|---|---|---|---|---|---|
| Quadrant | DetID | PixID | Counts | Sigma | Mean | Median | Sigma |
| A | 8 | 15 | 1488166 | 5005.75 | 1453 | 1419 | 297.0 |
| A | 5 | 16 | 873122 | 2934.95 | 1453 | 1419 | 297.0 |
| A | 1 | 162 | 166587 | 556.11 | 1453 | 1419 | 297.0 |
| B | 10 | 16 | 6028505 | 22322.14 | 1419 | 1381 | 270.0 |
| B | 4 | 239 | 915818 | 3386.72 | 1419 | 1381 | 270.0 |
| B | 3 | 64 | 741389 | 2740.7 | 1419 | 1381 | 270.0 |
| C | 14 | 234 | 18848 | 51.72 | 1445 | 1452 | 336.3 |
| C | 13 | 61 | 10672 | 27.41 | 1445 | 1452 | 336.3 |
| C | 8 | 222 | 4434 | 8.87 | 1445 | 1452 | 336.3 |
| D | 1 | 52 | 1987522 | 5770.58 | 1415 | 1372 | 344.2 |
| D | 9 | 85 | 474346 | 1374.18 | 1415 | 1372 | 344.2 |
| D | 10 | 199 | 352277 | 1019.52 | 1415 | 1372 | 344.2 |
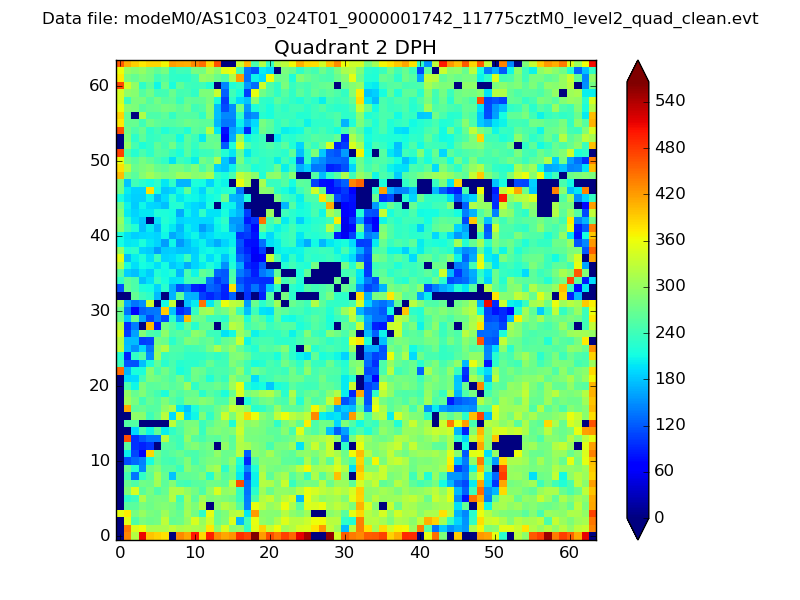
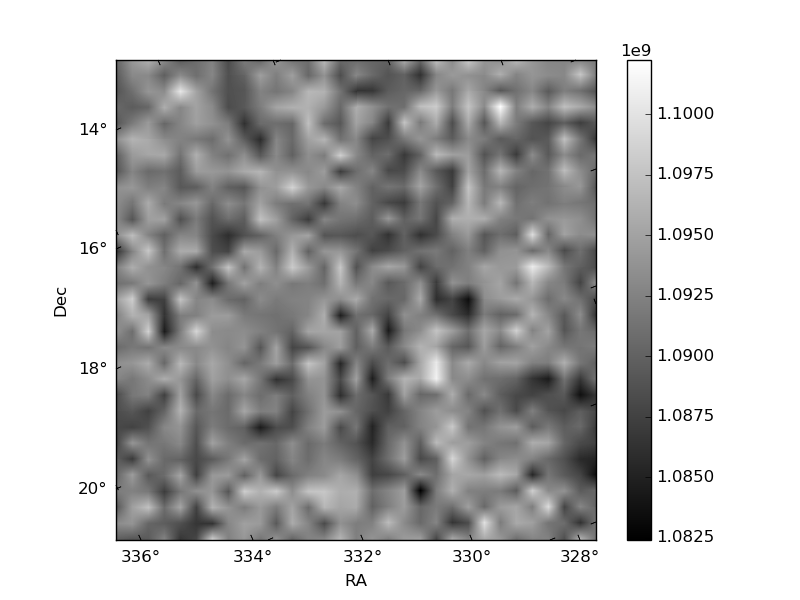
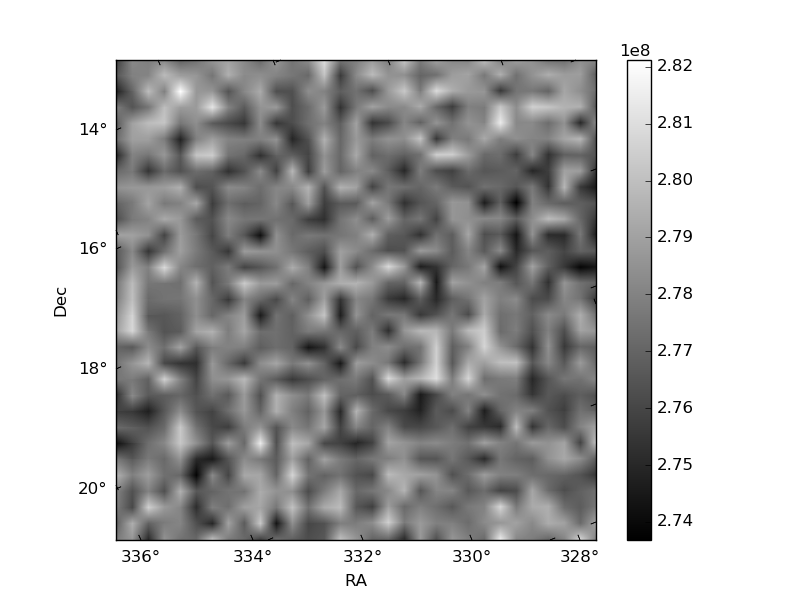
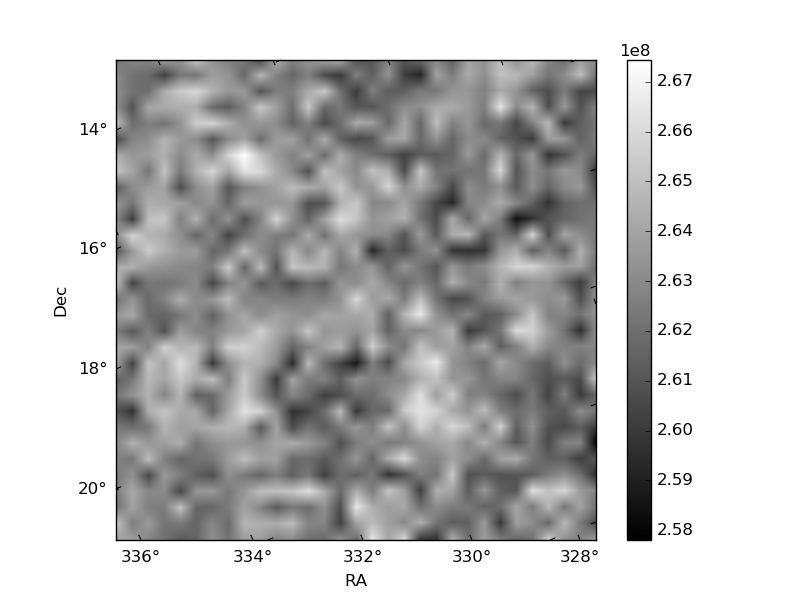
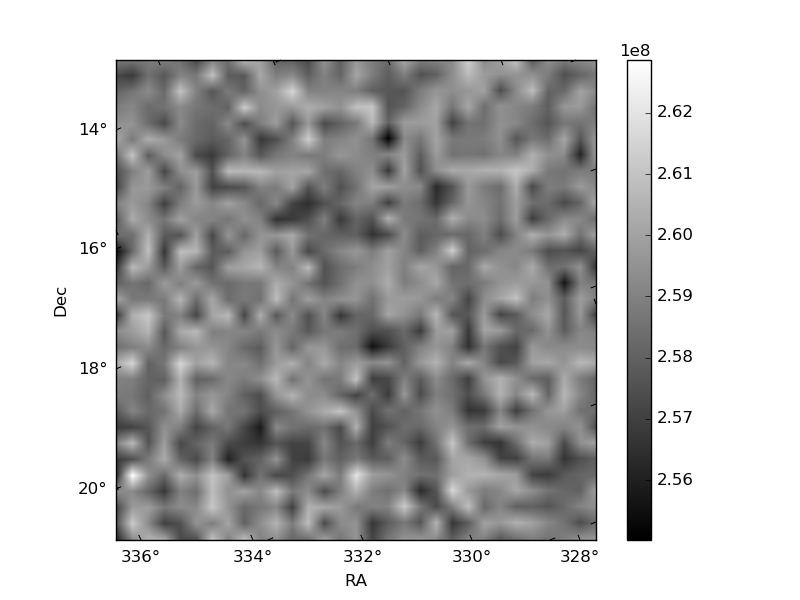
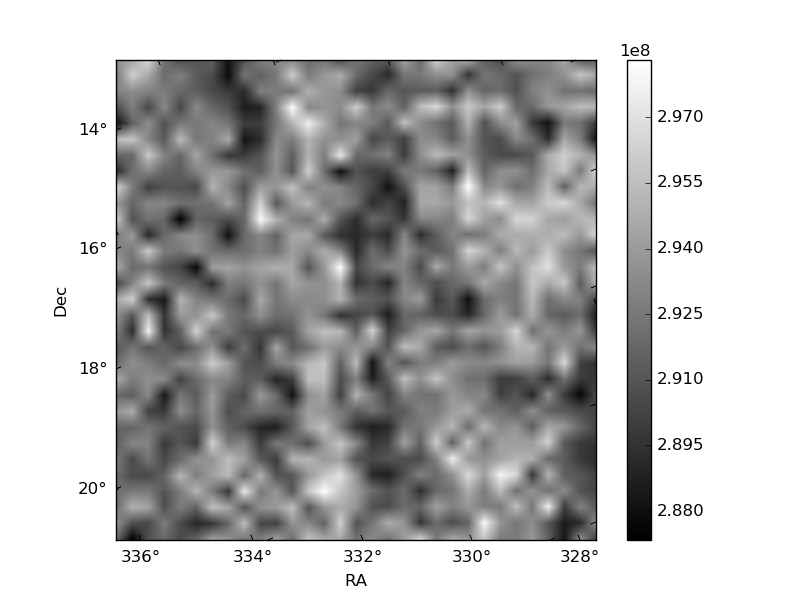
Histogram calculated using DETX and DETY for each event in the final _common_clean file
| Quadrant A | 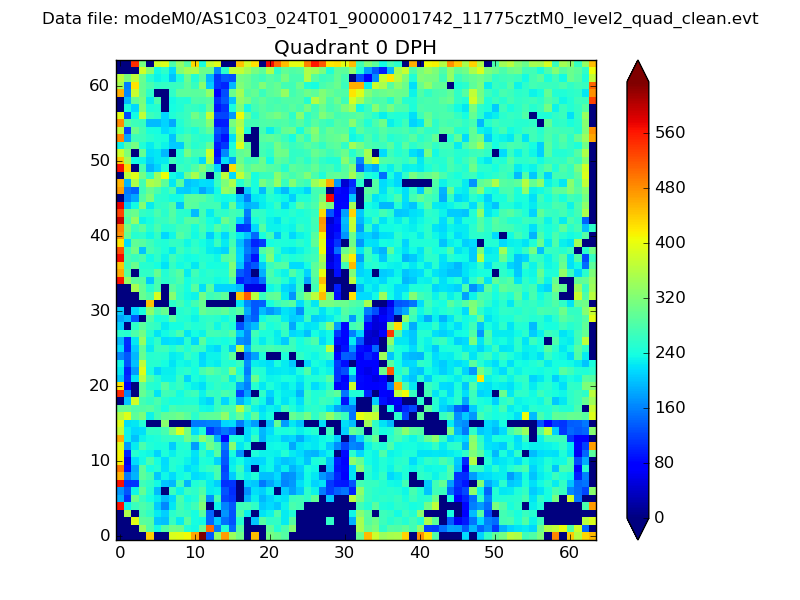 |
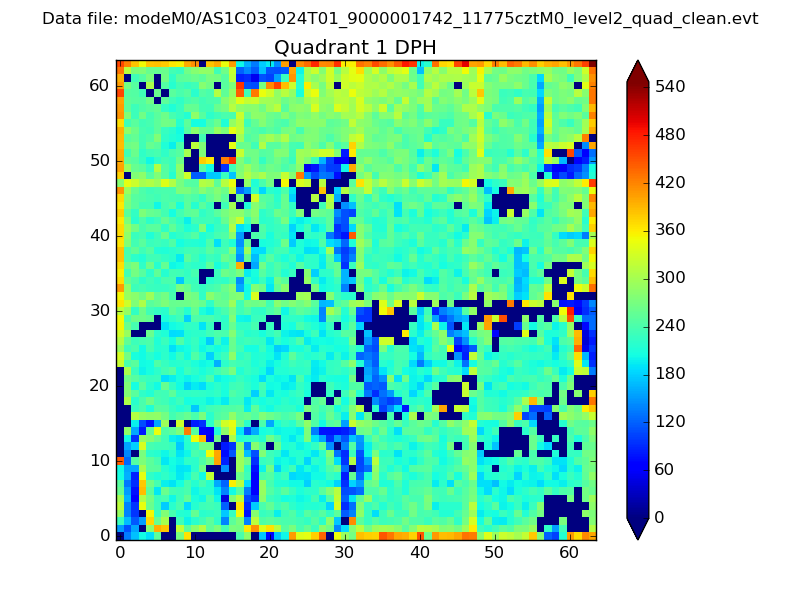 |
Quadrant B |
|---|---|---|---|
| Quadrant D | 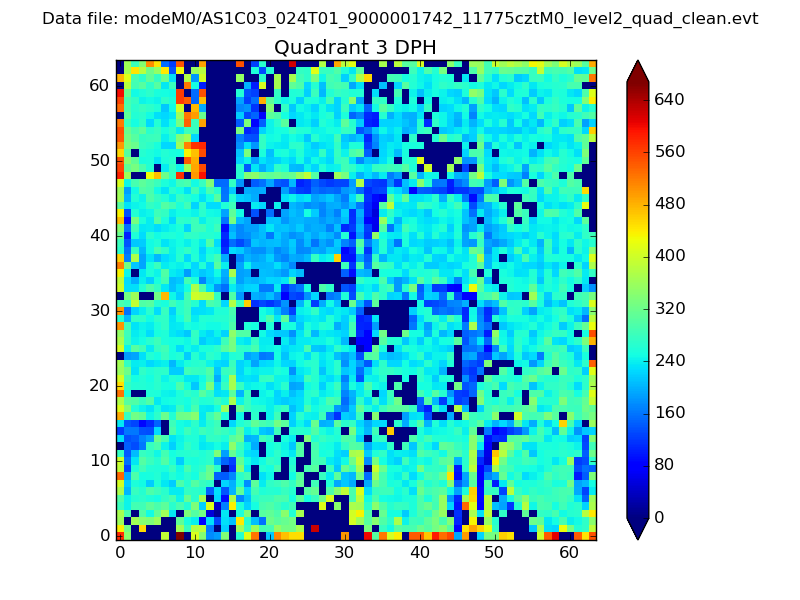 |
 |
Quadrant C |
| Plot type | Count rate plots | Images |
|---|---|---|
| Comparison with Poisson distribution Blue bars denote a histogram of data divided into 1 sec bins. Red curve is a Poisson curve with rate = median count rate of data. |
 |
 |
| Quadrant-wise count rates Data is divided into 100 sec bins |
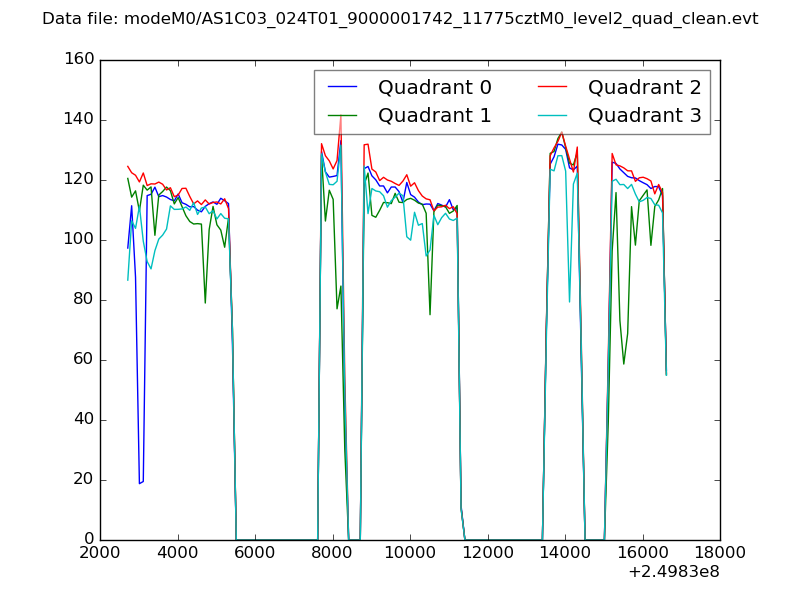 |
|
| Module-wise count rates for Quadrant A Data is divided into 100 sec bins |
 |
 |
| Module-wise count rates for Quadrant B Data is divided into 100 sec bins |
 |
 |
| Module-wise count rates for Quadrant C Data is divided into 100 sec bins |
 |
 |
| Module-wise count rates for Quadrant D Data is divided into 100 sec bins |
 |
 |
| Parameter | Plot |
|---|---|
| CZT HV Monitor |  |
| D_VDD | 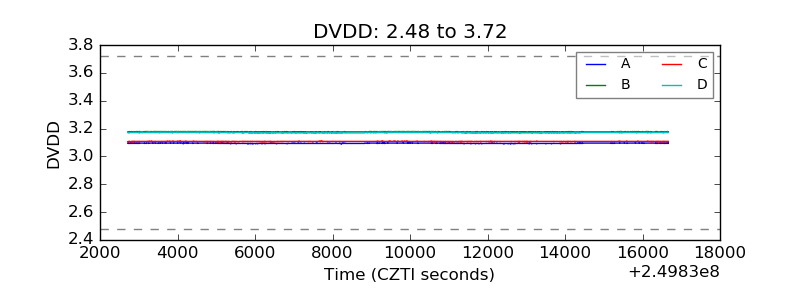 |
| Temperature 1 | 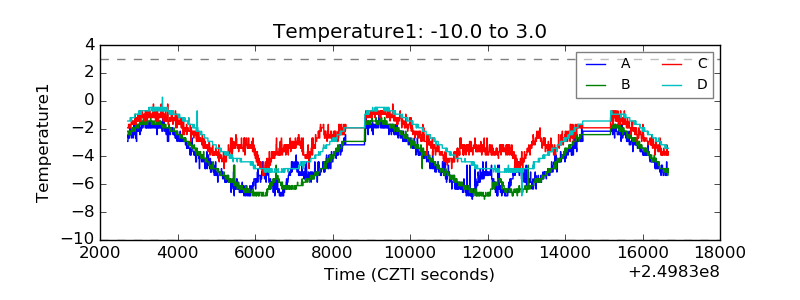 |
| Veto HV Monitor | 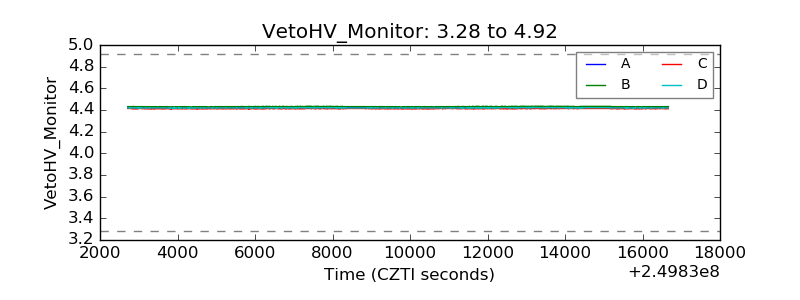 |
| Veto LLD | 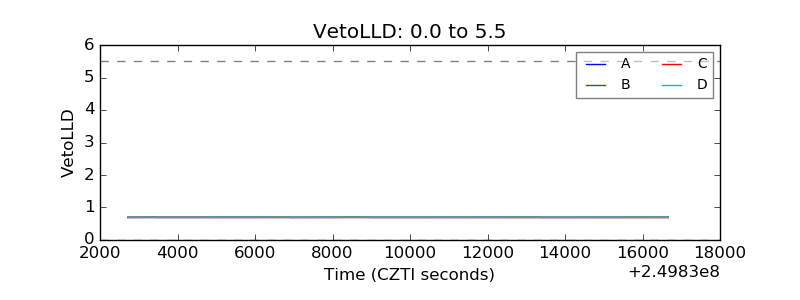 |
| Alpha Counter | 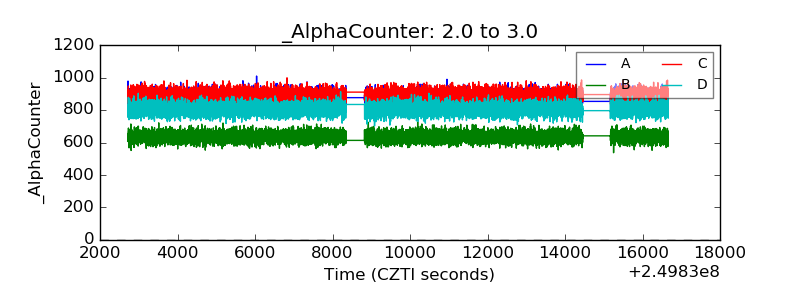 |
| _CPM_Rate | 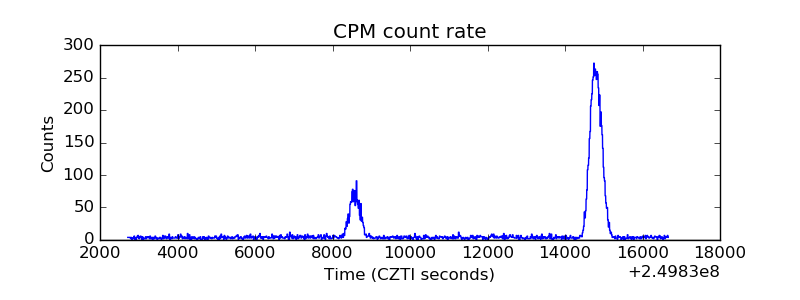 |
| CZT Counter |  |
| +2.5 Volts monitor |  |
| +5 Volts monitor | 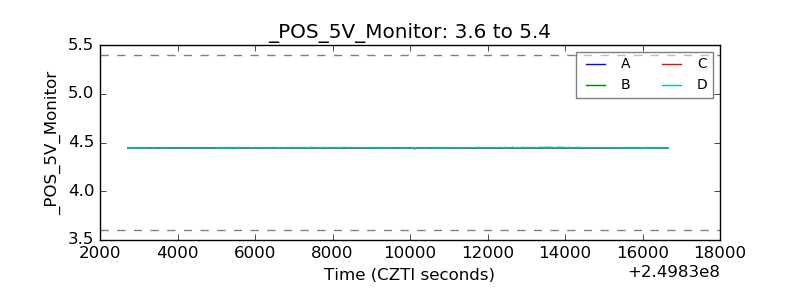 |
| _ROLL_ROT |  |
| _Roll_DEC | 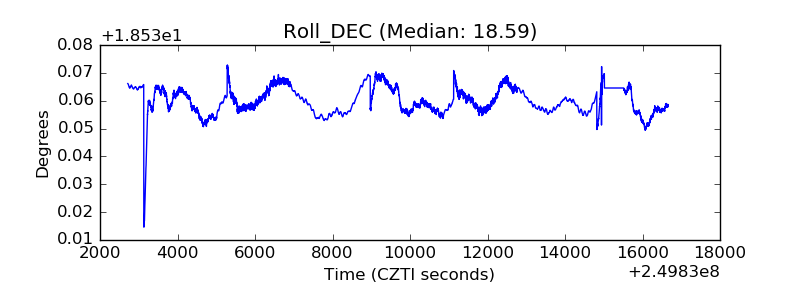 |
| _Roll_RA | 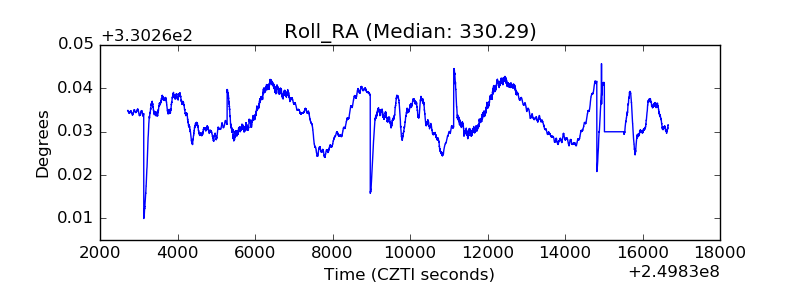 |
| Veto Counter |  |