| Param | Original file | Final file |
|---|---|---|
| Filename | modeM0/AS1C03_024T01_9000001742_11777cztM0_level2.evt | modeM0/AS1C03_024T01_9000001742_11777cztM0_level2_quad_clean.evt |
| Size (bytes) | 563,382,720 | 83,462,400 |
| Size | 537.3 MB | 79.6 MB |
| Events in quadrant A | 3,331,896 | 529,695 |
| Events in quadrant B | 6,591,491 | 502,465 |
| Events in quadrant C | 3,035,298 | 529,703 |
| Events in quadrant D | 3,647,683 | 496,365 |
| Mode M0 | |||
|---|---|---|---|
| Quadrant | BADHDUFLAG | Total packets | Discarded packets |
| A | 0 | 14228 | 3 |
| B | 0 | 24280 | 2 |
| C | 0 | 13616 | 2 |
| D | 0 | 15368 | 2 |
| Mode M9 | |||
|---|---|---|---|
| Quadrant | BADHDUFLAG | Total packets | Discarded packets |
| A | 0 | 12 | 0 |
| B | 0 | 12 | 0 |
| C | 0 | 12 | 0 |
| D | 0 | 13 | 0 |
| Mode SS | |||
|---|---|---|---|
| Quadrant | BADHDUFLAG | Total packets | Discarded packets |
| A | 0 | 138 | 0 |
| B | 0 | 138 | 0 |
| C | 0 | 138 | 0 |
| D | 0 | 138 | 0 |
| Quadrant | Total seconds | Saturated seconds | Saturation percentage |
|---|---|---|---|
| A | 6720 | 48 | 0.714286% |
| B | 6720 | 631 | 9.389881% |
| C | 6720 | 38 | 0.565476% |
| D | 6720 | 211 | 3.139881% |
Noise dominated data is calculated using 1-second bins in cleaned event files. If a bin has >2000 counts, and if more than 50% of those come from <1% of pixels, then it is considered to be noise-dominated and hence unusable.
| Quadrant | # 1 sec bins | Bins with >0 counts | Bins with >2000 counts | High rate bins dominated by noise | Noise dominated (total time) | Noise dominated (detector-on time) | Marked lightcurve |
|---|---|---|---|---|---|---|---|
| A | 7771 | 6722 | 0 | 0 | 0.00% | 0.00% | 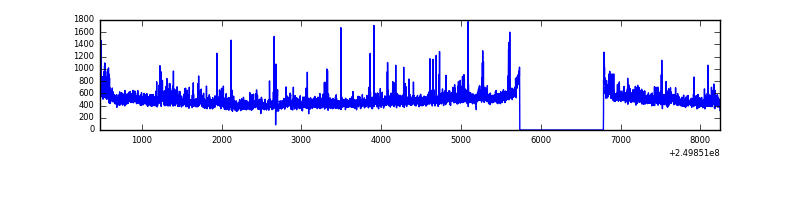 |
| B | 7771 | 6722 | 538 | 538 | 6.92% | 8.00% | 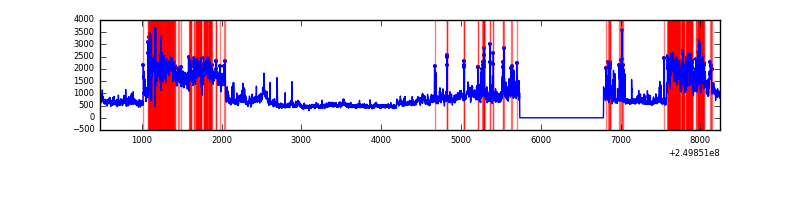 |
| C | 7771 | 6722 | 4 | 4 | 0.05% | 0.06% | 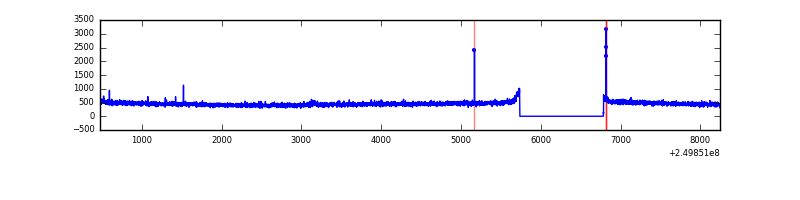 |
| D | 7771 | 6722 | 130 | 130 | 1.67% | 1.93% | 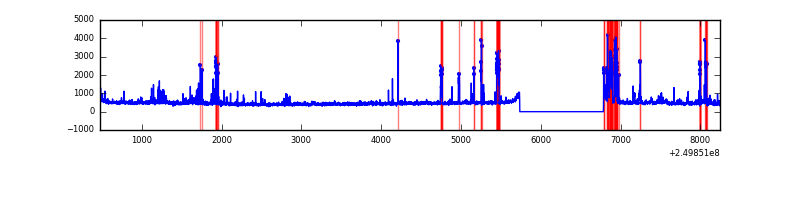 |
Top three noisy pixels from each quadrant. If the there are fewer than three noisy pixels in the level2.evt file, extra rows are filled as -1
| Pixel properties | Quadrant properties | ||||||
|---|---|---|---|---|---|---|---|
| Quadrant | DetID | PixID | Counts | Sigma | Mean | Median | Sigma |
| A | 1 | 162 | 82337 | 507.57 | 789 | 773 | 160.7 |
| A | 8 | 15 | 76474 | 471.09 | 789 | 773 | 160.7 |
| A | 1 | 178 | 40755 | 248.81 | 789 | 773 | 160.7 |
| B | 10 | 16 | 2764434 | 18547.47 | 774 | 755 | 149.0 |
| B | 4 | 239 | 488064 | 3270.4 | 774 | 755 | 149.0 |
| B | 15 | 204 | 121613 | 811.1 | 774 | 755 | 149.0 |
| C | 1 | 3 | 9855 | 50.37 | 774 | 781 | 180.2 |
| C | 13 | 61 | 5575 | 26.61 | 774 | 781 | 180.2 |
| C | 8 | 222 | 5393 | 25.6 | 774 | 781 | 180.2 |
| D | 1 | 52 | 273969 | 1501.53 | 757 | 735 | 182.0 |
| D | 13 | 104 | 237977 | 1303.74 | 757 | 735 | 182.0 |
| D | 13 | 137 | 79564 | 433.2 | 757 | 735 | 182.0 |
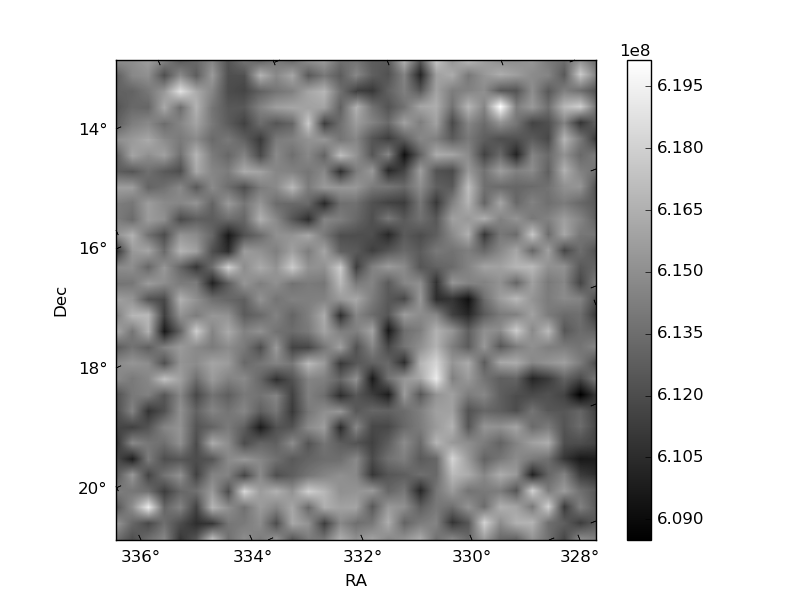
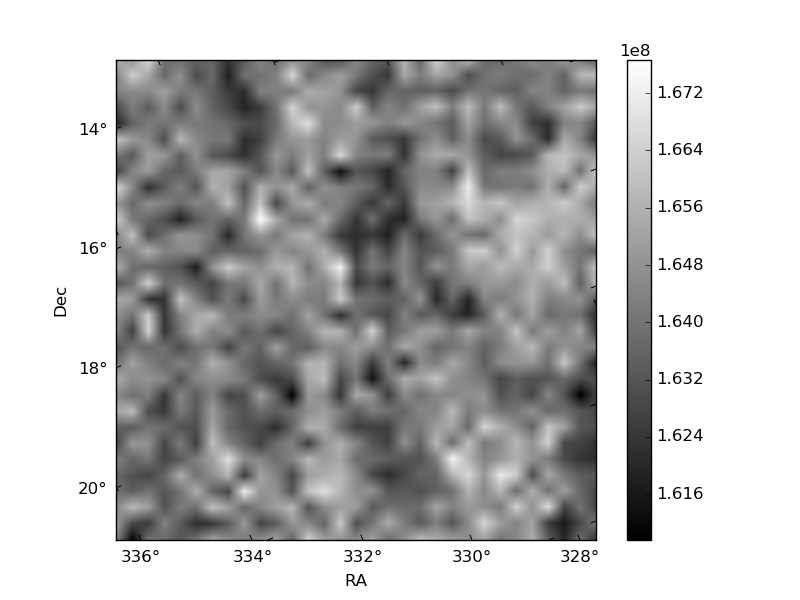
Histogram calculated using DETX and DETY for each event in the final _common_clean file
| Quadrant A | 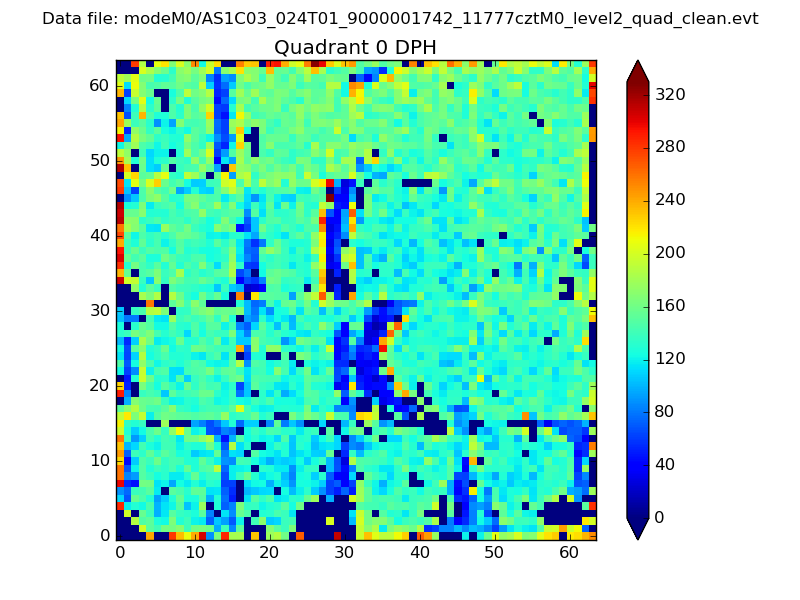 |
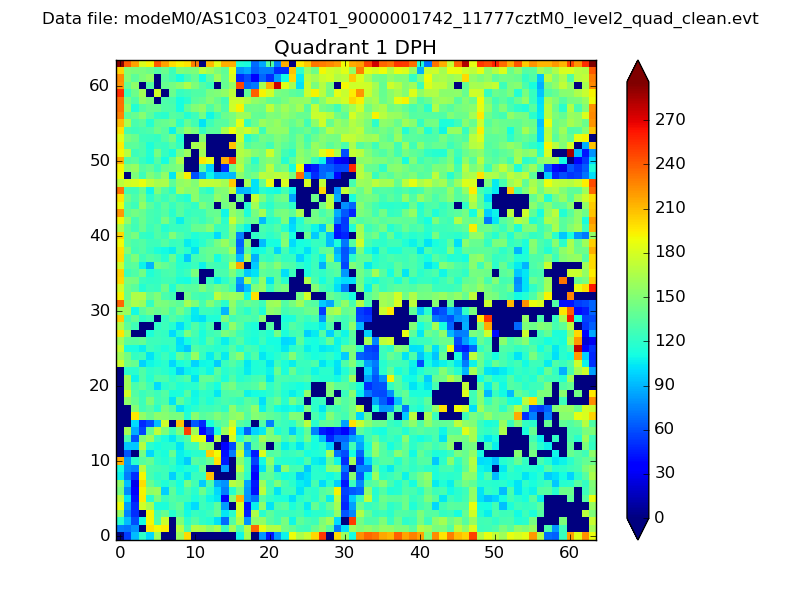 |
Quadrant B |
|---|---|---|---|
| Quadrant D | 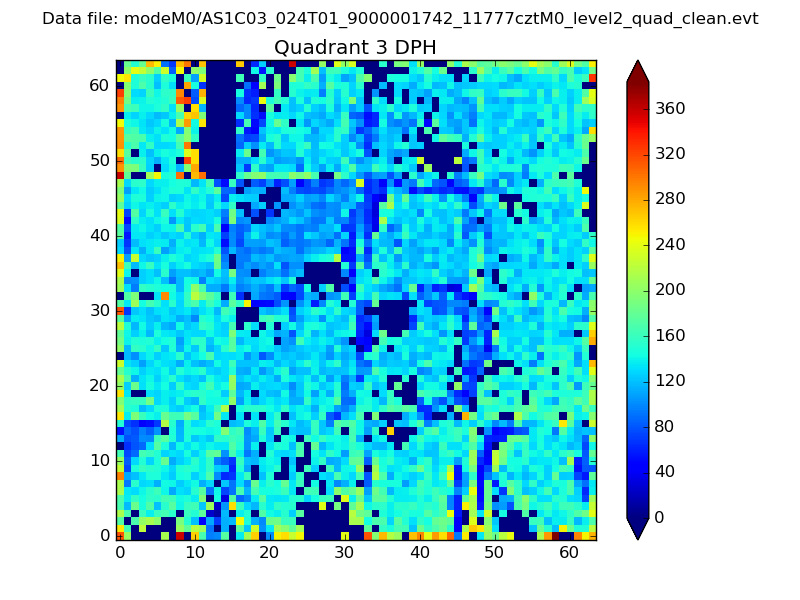 |
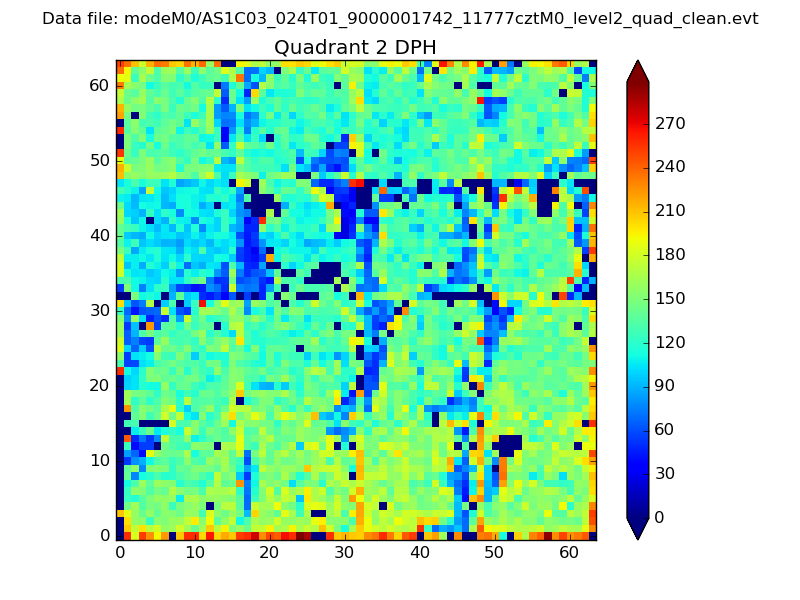 |
Quadrant C |
| Plot type | Count rate plots | Images |
|---|---|---|
| Comparison with Poisson distribution Blue bars denote a histogram of data divided into 1 sec bins. Red curve is a Poisson curve with rate = median count rate of data. |
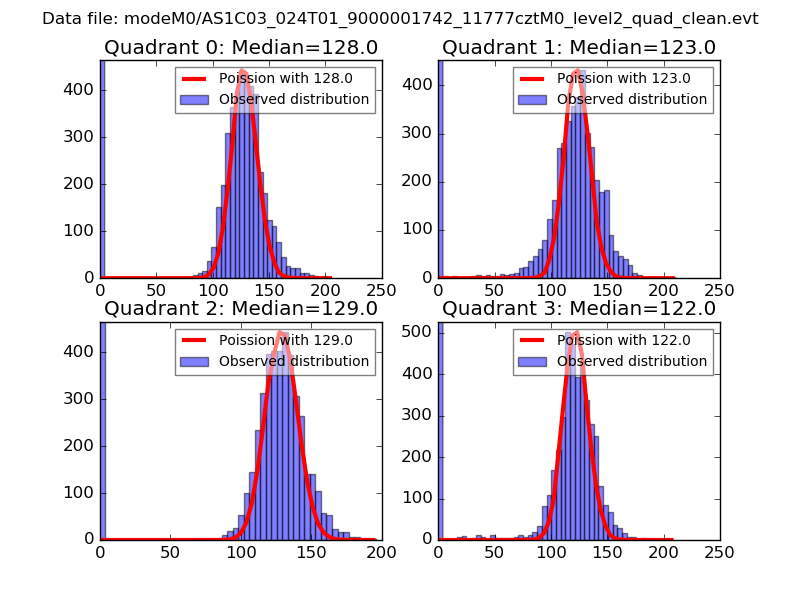 |
 |
| Quadrant-wise count rates Data is divided into 100 sec bins |
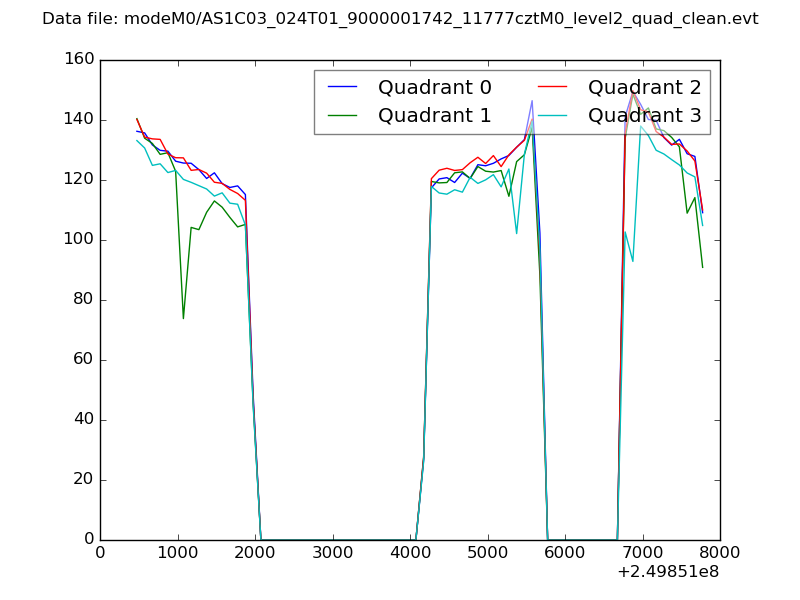 |
|
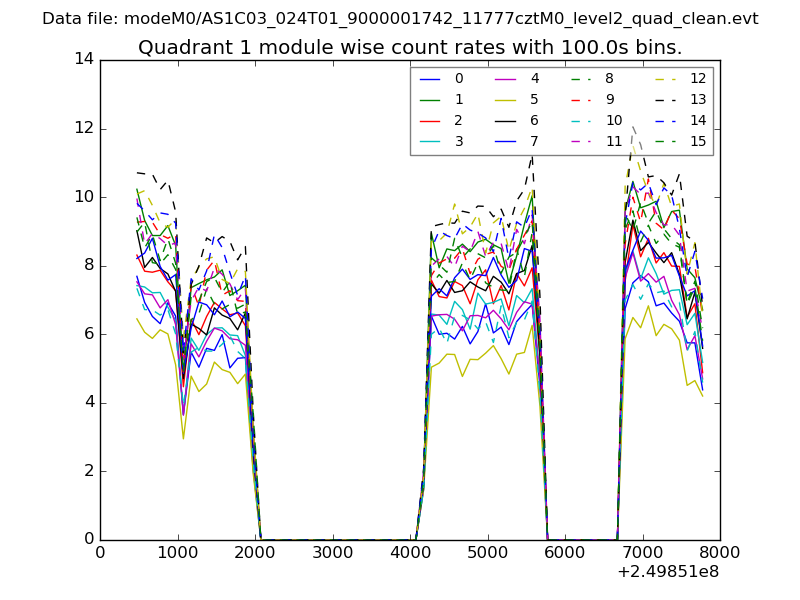
| Module-wise count rates for Quadrant A Data is divided into 100 sec bins |
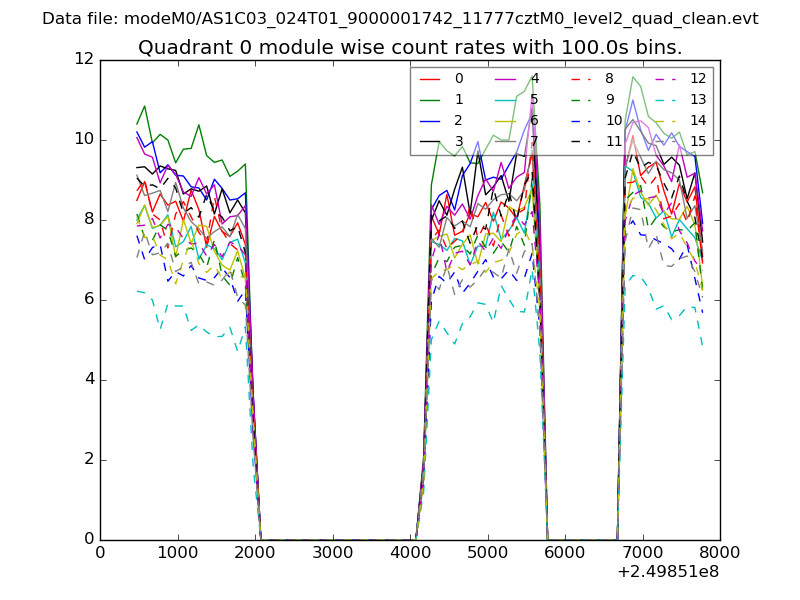 |
 |
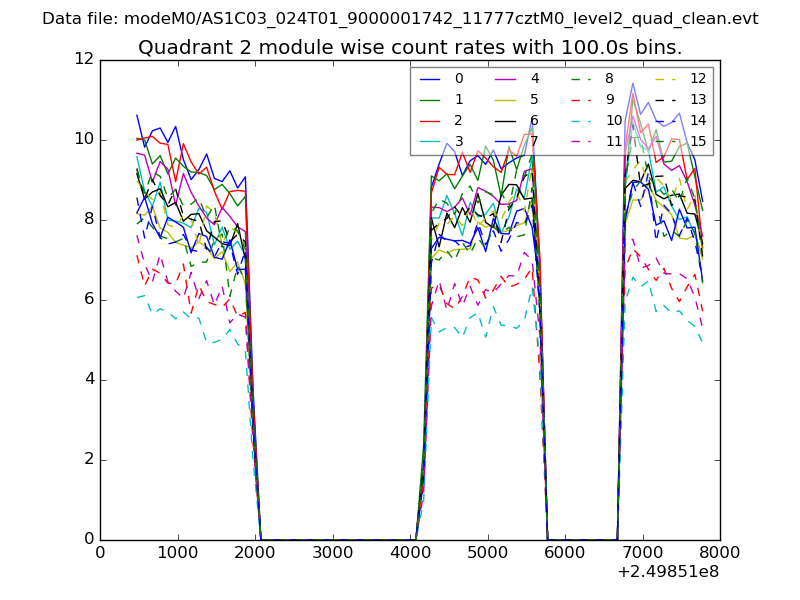
| Module-wise count rates for Quadrant B Data is divided into 100 sec bins |
 |
 |
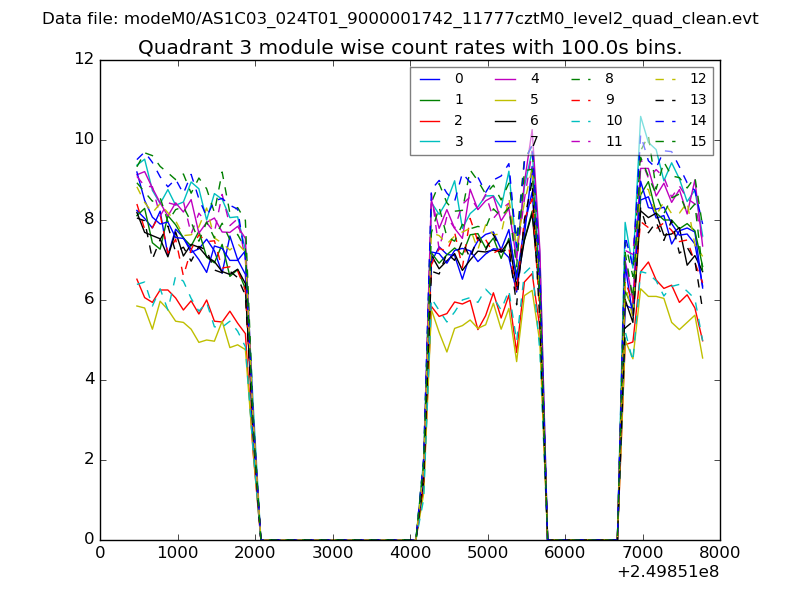
| Module-wise count rates for Quadrant C Data is divided into 100 sec bins |
 |
 |
| Module-wise count rates for Quadrant D Data is divided into 100 sec bins |
 |
 |
| Parameter | Plot |
|---|---|
| CZT HV Monitor | 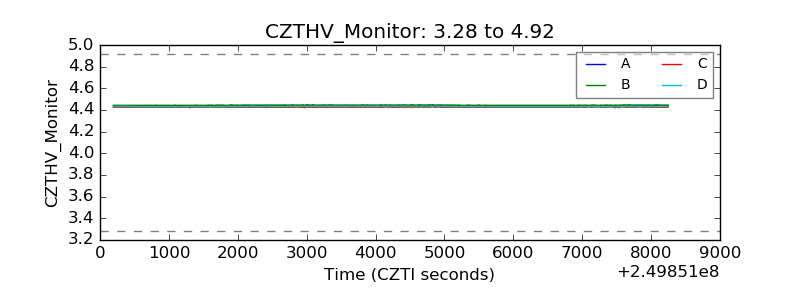 |
| D_VDD | 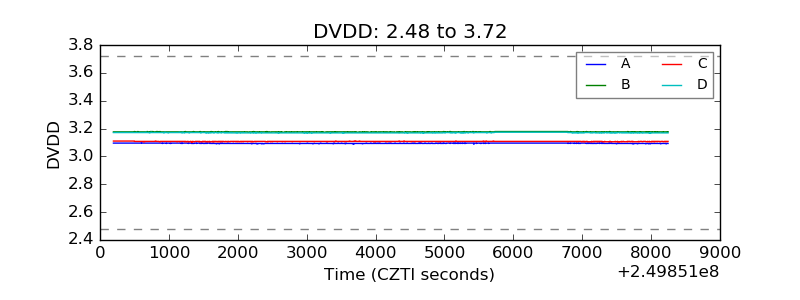 |
| Temperature 1 | 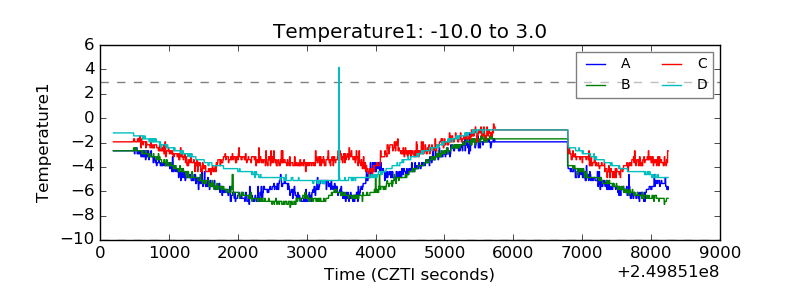 |
| Veto HV Monitor | 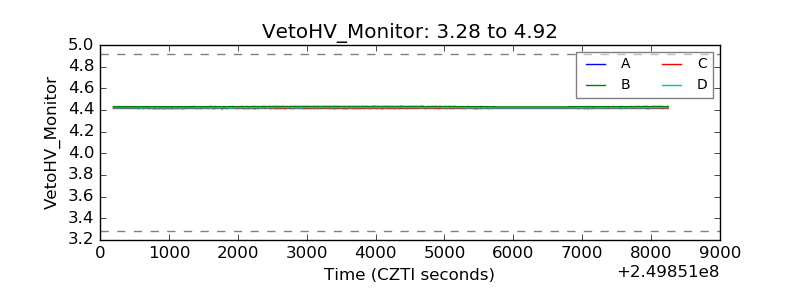 |
| Veto LLD | 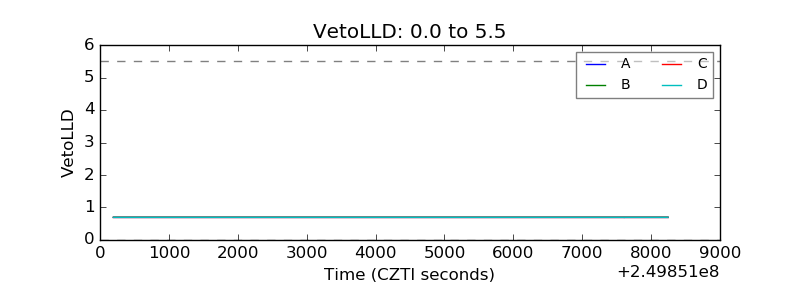 |
| Alpha Counter | 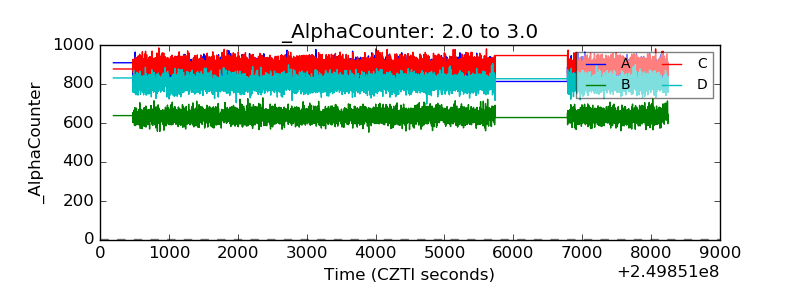 |
| _CPM_Rate | 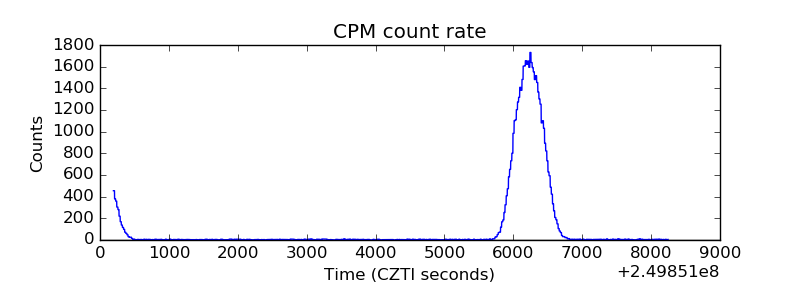 |
| CZT Counter | 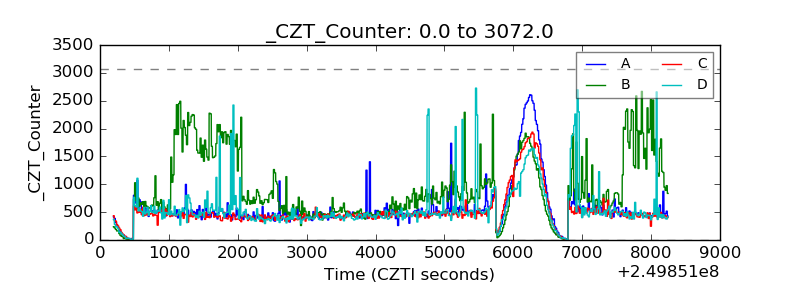 |
| +2.5 Volts monitor |  |
| +5 Volts monitor |  |
| _ROLL_ROT | 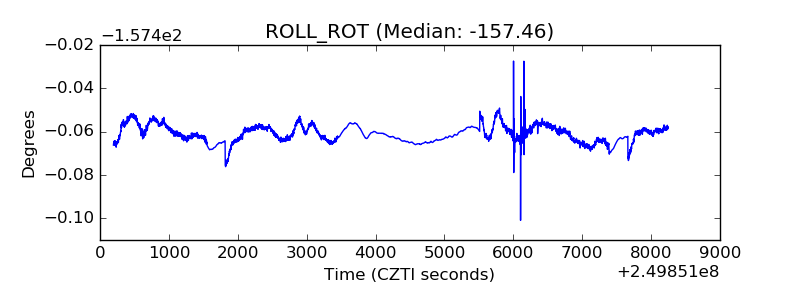 |
| _Roll_DEC |  |
| _Roll_RA | 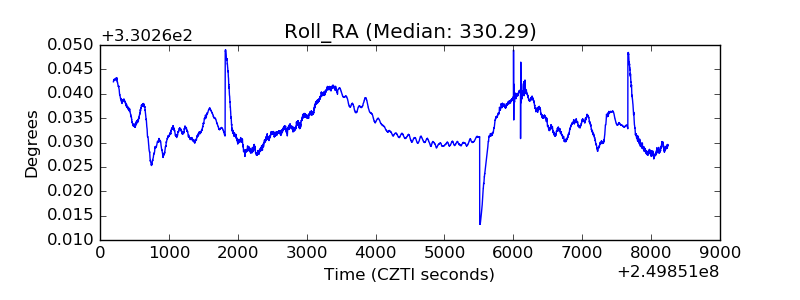 |
| Veto Counter | 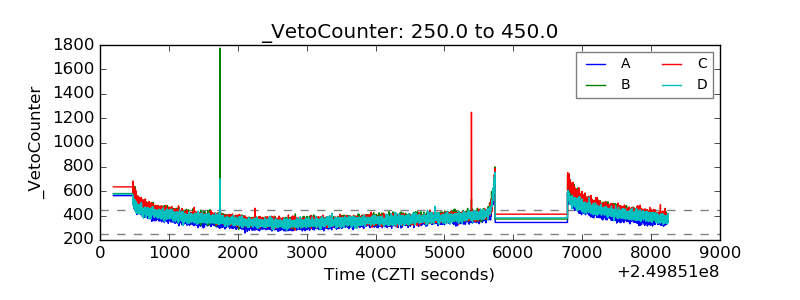 |