| Param | Original file | Final file |
|---|---|---|
| Filename | modeM0/AS1C03_024T01_9000001742_11779cztM0_level2.evt | modeM0/AS1C03_024T01_9000001742_11779cztM0_level2_quad_clean.evt |
| Size (bytes) | 659,180,160 | 76,268,160 |
| Size | 628.6 MB | 72.7 MB |
| Events in quadrant A | 3,702,269 | 481,051 |
| Events in quadrant B | 8,743,803 | 435,987 |
| Events in quadrant C | 3,102,466 | 483,353 |
| Events in quadrant D | 3,965,200 | 444,944 |
| Mode M0 | |||
|---|---|---|---|
| Quadrant | BADHDUFLAG | Total packets | Discarded packets |
| A | 0 | 15324 | 3 |
| B | 0 | 30777 | 2 |
| C | 0 | 13619 | 2 |
| D | 0 | 16228 | 2 |
| Mode M9 | |||
|---|---|---|---|
| Quadrant | BADHDUFLAG | Total packets | Discarded packets |
| A | 0 | 22 | 0 |
| B | 0 | 22 | 0 |
| C | 0 | 22 | 0 |
| D | 0 | 22 | 0 |
| Mode SS | |||
|---|---|---|---|
| Quadrant | BADHDUFLAG | Total packets | Discarded packets |
| A | 0 | 138 | 0 |
| B | 0 | 138 | 0 |
| C | 0 | 138 | 0 |
| D | 0 | 138 | 0 |
| Quadrant | Total seconds | Saturated seconds | Saturation percentage |
|---|---|---|---|
| A | 6641 | 53 | 0.798073% |
| B | 6641 | 1641 | 24.710134% |
| C | 6641 | 42 | 0.632435% |
| D | 6641 | 267 | 4.020479% |
Noise dominated data is calculated using 1-second bins in cleaned event files. If a bin has >2000 counts, and if more than 50% of those come from <1% of pixels, then it is considered to be noise-dominated and hence unusable.
| Quadrant | # 1 sec bins | Bins with >0 counts | Bins with >2000 counts | High rate bins dominated by noise | Noise dominated (total time) | Noise dominated (detector-on time) | Marked lightcurve |
|---|---|---|---|---|---|---|---|
| A | 8887 | 6644 | 1 | 1 | 0.01% | 0.02% | 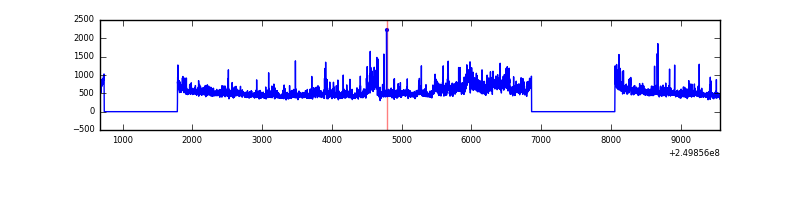 |
| B | 8887 | 6644 | 1208 | 1208 | 13.59% | 18.18% | 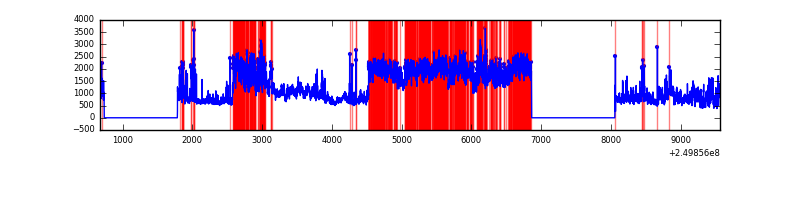 |
| C | 8887 | 6644 | 3 | 3 | 0.03% | 0.05% | 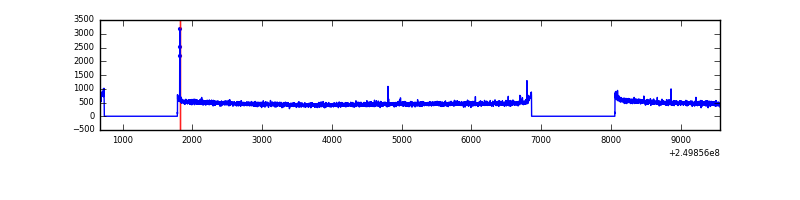 |
| D | 8887 | 6644 | 190 | 190 | 2.14% | 2.86% | 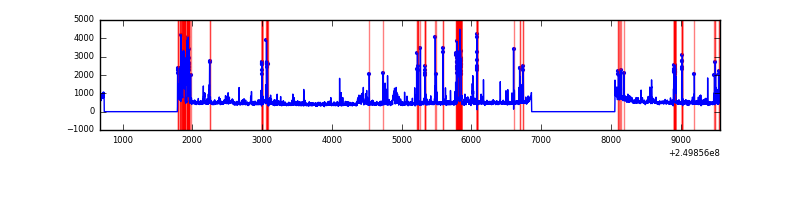 |
Top three noisy pixels from each quadrant. If the there are fewer than three noisy pixels in the level2.evt file, extra rows are filled as -1
| Pixel properties | Quadrant properties | ||||||
|---|---|---|---|---|---|---|---|
| Quadrant | DetID | PixID | Counts | Sigma | Mean | Median | Sigma |
| A | 8 | 15 | 378617 | 2315.11 | 804 | 787 | 163.2 |
| A | 1 | 162 | 91368 | 555.02 | 804 | 787 | 163.2 |
| A | 1 | 178 | 46089 | 277.58 | 804 | 787 | 163.2 |
| B | 10 | 16 | 5037374 | 34591.58 | 769 | 751 | 145.6 |
| B | 4 | 239 | 442686 | 3035.21 | 769 | 751 | 145.6 |
| B | 3 | 64 | 81044 | 551.45 | 769 | 751 | 145.6 |
| C | 1 | 3 | 17316 | 90.02 | 790 | 797 | 183.5 |
| C | 13 | 61 | 5710 | 26.77 | 790 | 797 | 183.5 |
| C | 14 | 234 | 2816 | 11.0 | 790 | 797 | 183.5 |
| D | 1 | 52 | 446982 | 2398.32 | 767 | 746 | 186.1 |
| D | 13 | 104 | 223007 | 1194.55 | 767 | 746 | 186.1 |
| D | 13 | 137 | 124530 | 665.28 | 767 | 746 | 186.1 |
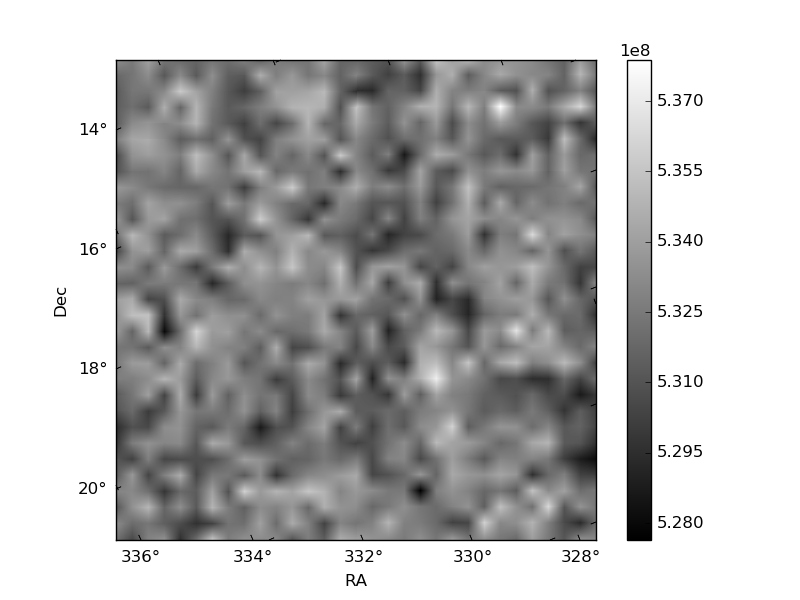
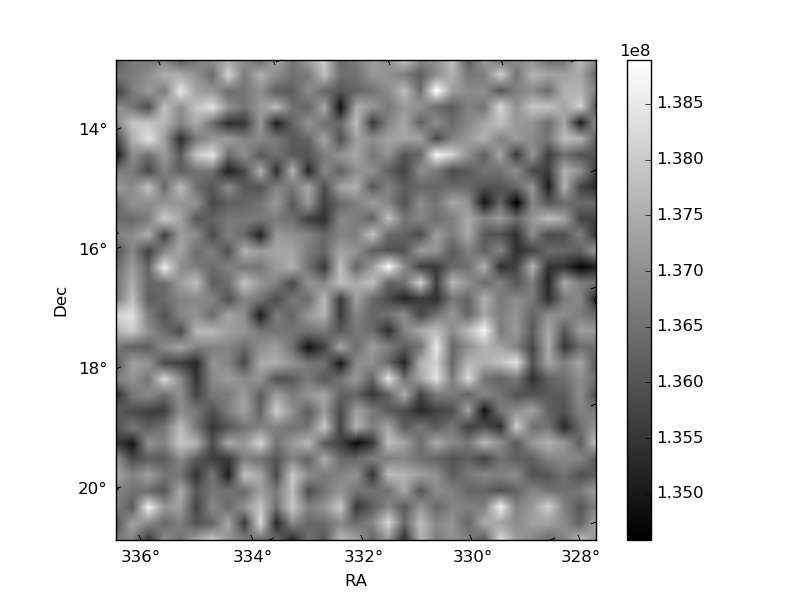
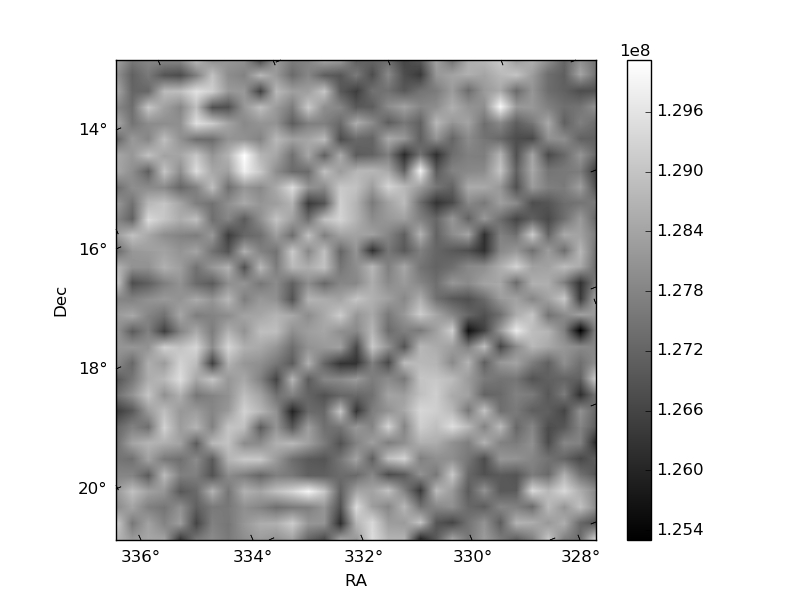
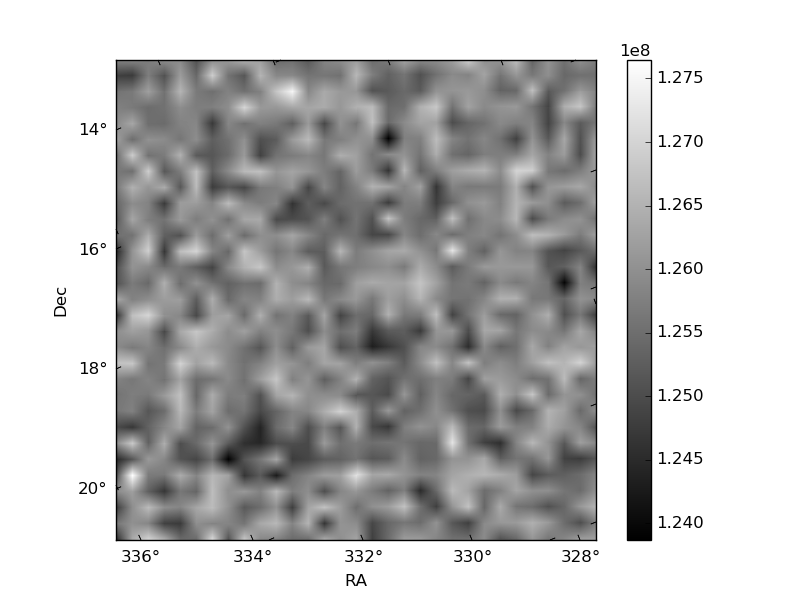
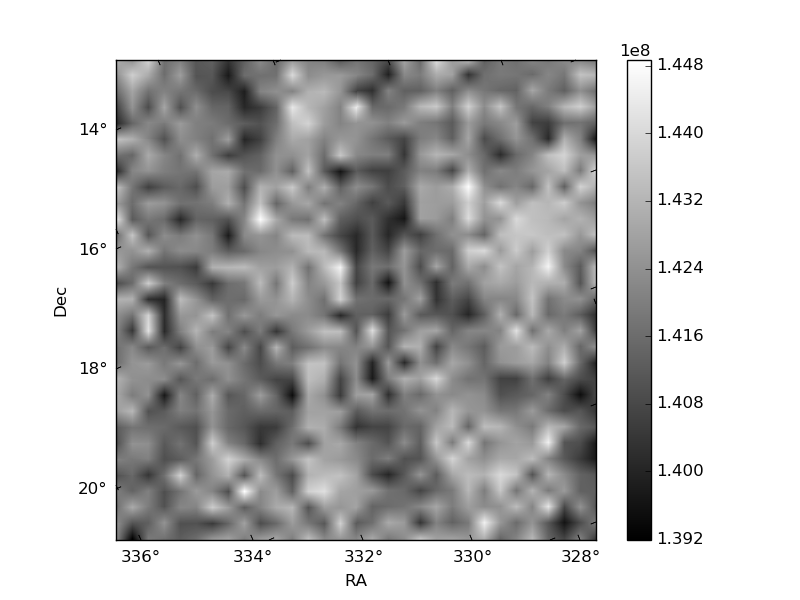
Histogram calculated using DETX and DETY for each event in the final _common_clean file
| Quadrant A | 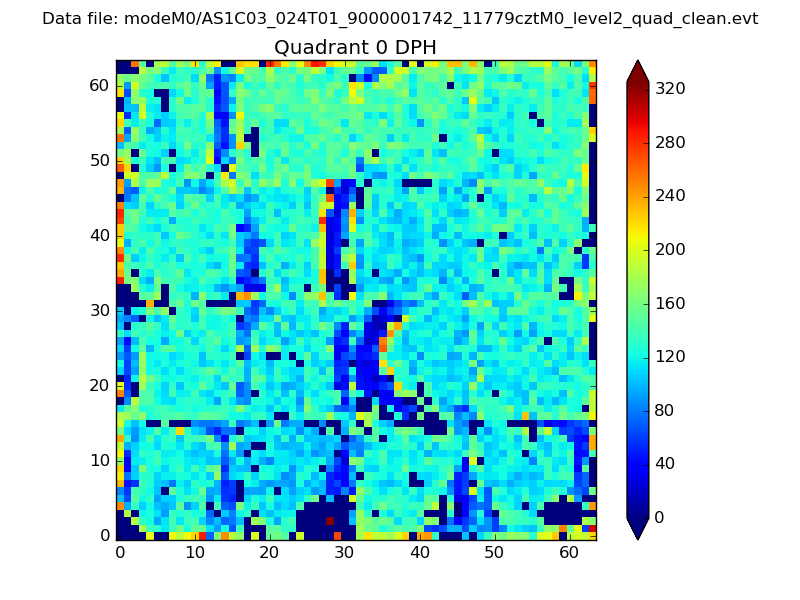 |
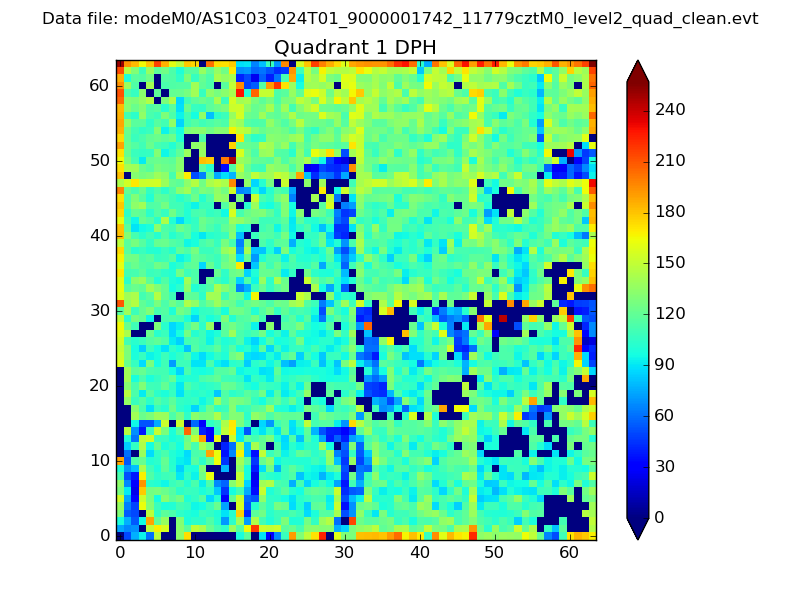 |
Quadrant B |
|---|---|---|---|
| Quadrant D | 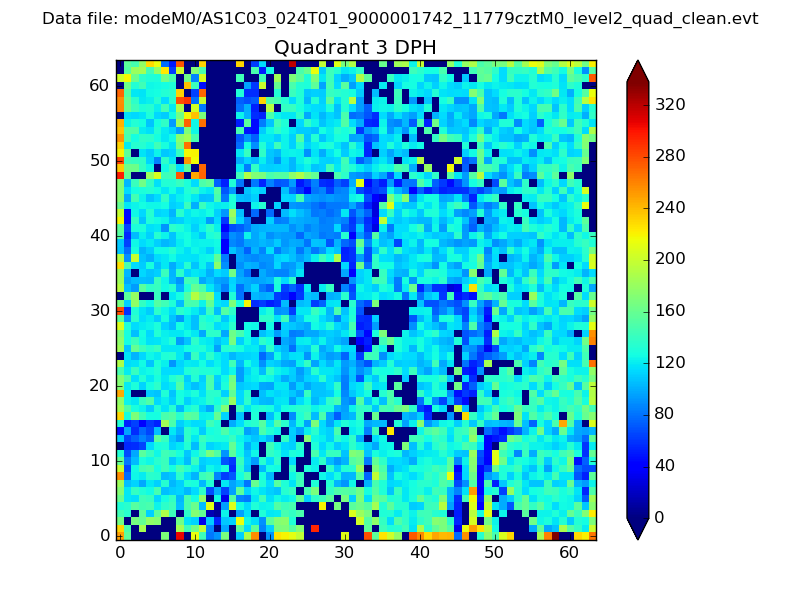 |
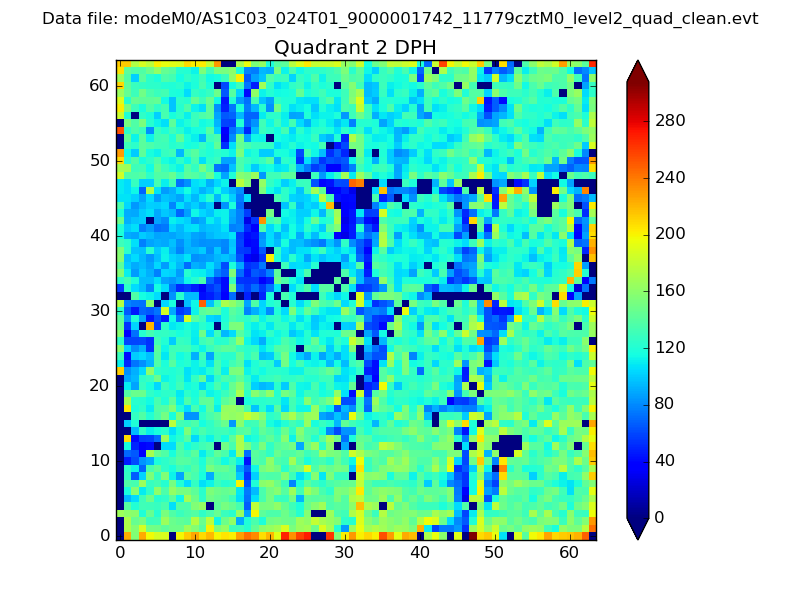 |
Quadrant C |
| Plot type | Count rate plots | Images |
|---|---|---|
| Comparison with Poisson distribution Blue bars denote a histogram of data divided into 1 sec bins. Red curve is a Poisson curve with rate = median count rate of data. |
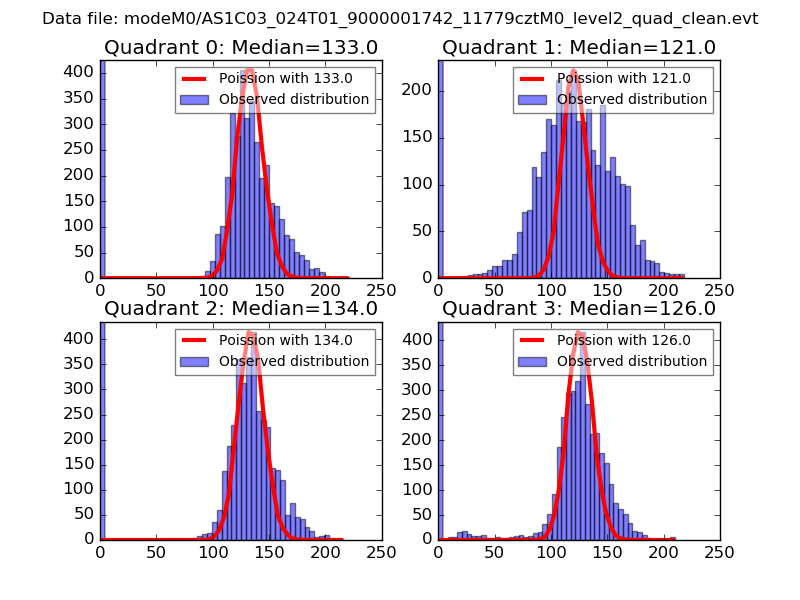 |
 |
| Quadrant-wise count rates Data is divided into 100 sec bins |
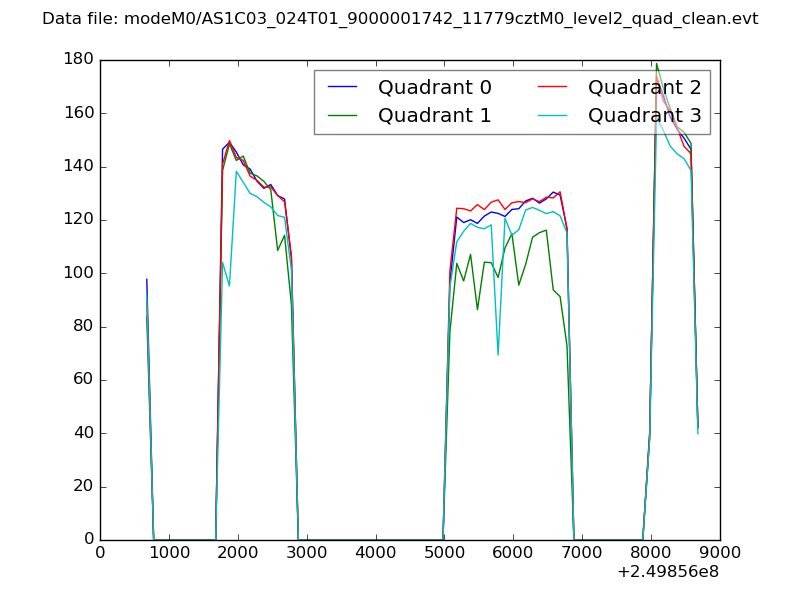 |
|
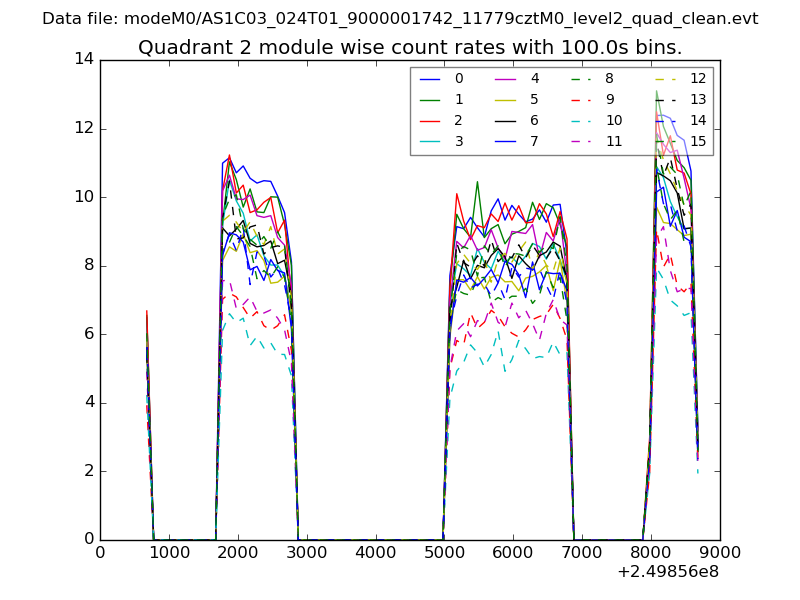
| Module-wise count rates for Quadrant A Data is divided into 100 sec bins |
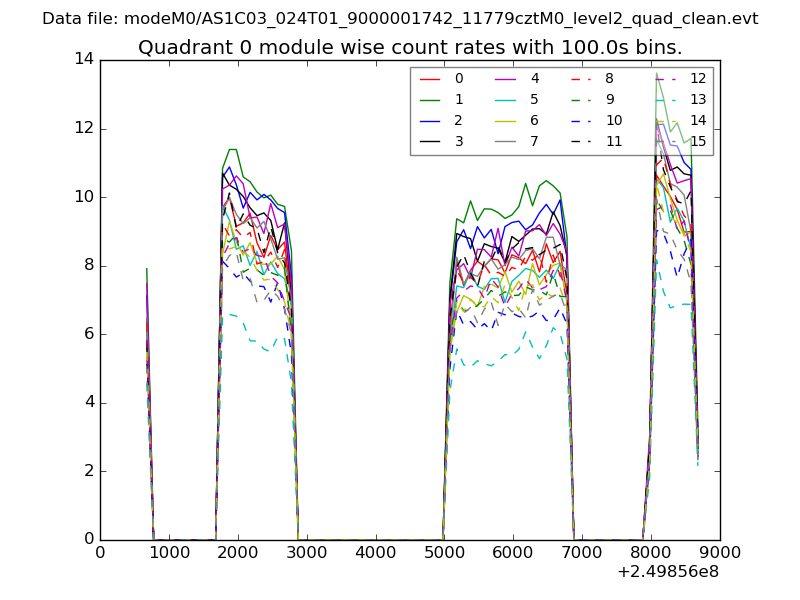 |
 |
| Module-wise count rates for Quadrant B Data is divided into 100 sec bins |
 |
 |
| Module-wise count rates for Quadrant C Data is divided into 100 sec bins |
 |
 |
| Module-wise count rates for Quadrant D Data is divided into 100 sec bins |
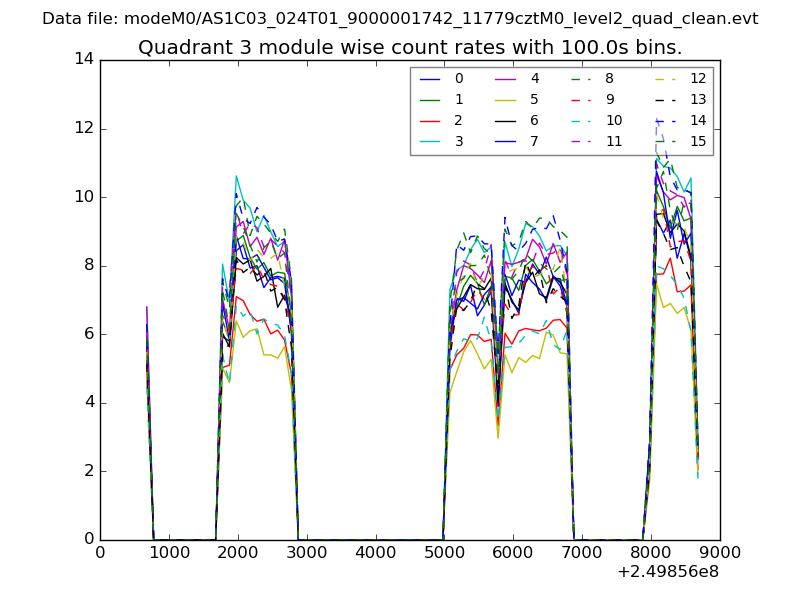 |
 |
| Parameter | Plot |
|---|---|
| CZT HV Monitor | 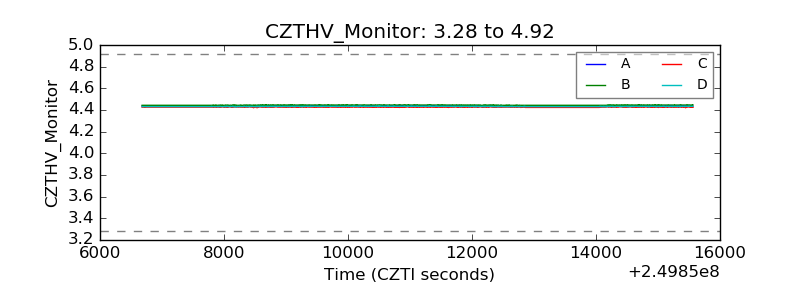 |
| D_VDD | 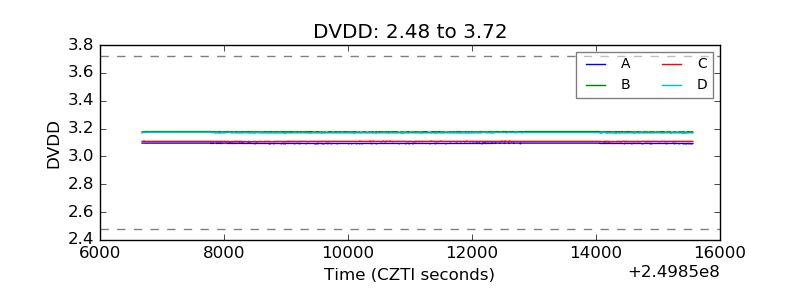 |
| Temperature 1 | 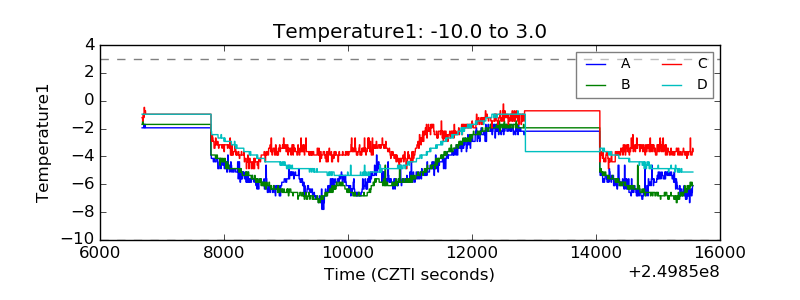 |
| Veto HV Monitor | 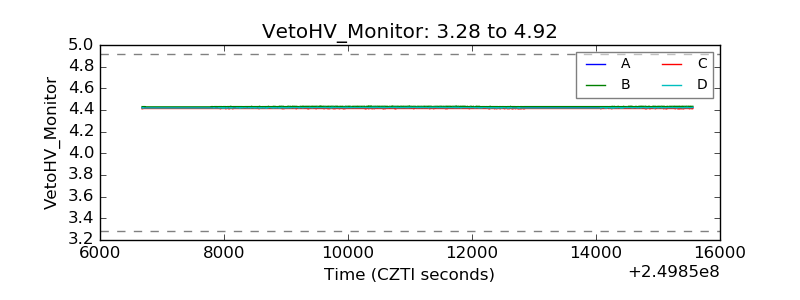 |
| Veto LLD | 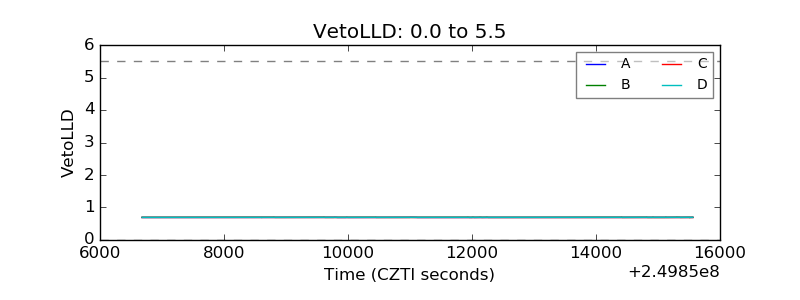 |
| Alpha Counter | 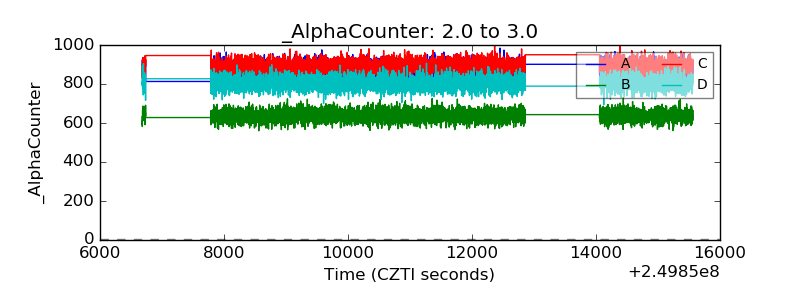 |
| _CPM_Rate | 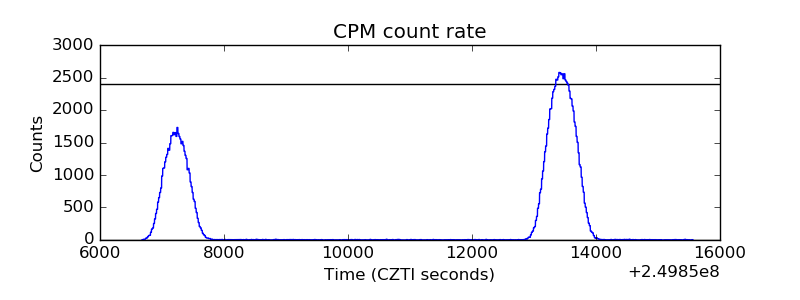 |
| CZT Counter | 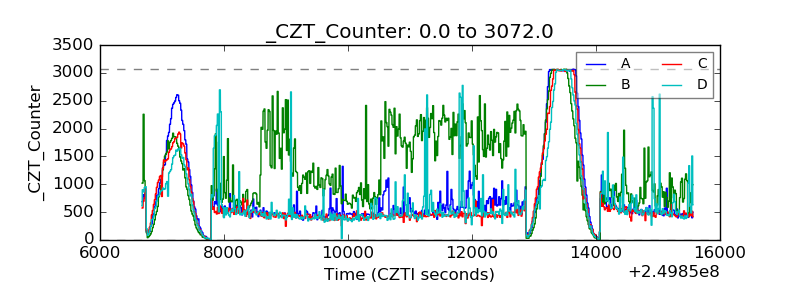 |
| +2.5 Volts monitor |  |
| +5 Volts monitor |  |
| _ROLL_ROT | 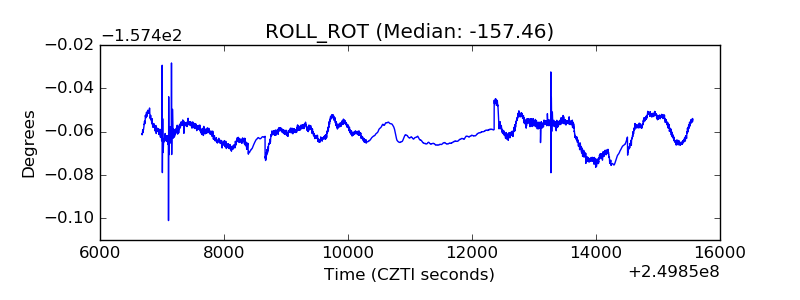 |
| _Roll_DEC |  |
| _Roll_RA | 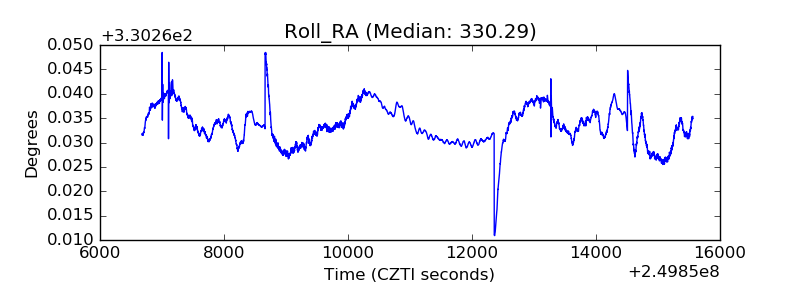 |
| Veto Counter | 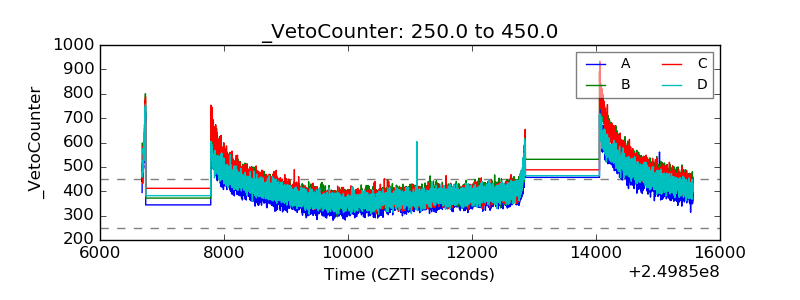 |