| Param | Original file | Final file |
|---|---|---|
| Filename | modeM0/AS1C03_024T01_9000001742_11781cztM0_level2.evt | modeM0/AS1C03_024T01_9000001742_11781cztM0_level2_quad_clean.evt |
| Size (bytes) | 643,985,280 | 53,199,360 |
| Size | 614.2 MB | 50.7 MB |
| Events in quadrant A | 3,350,910 | 318,770 |
| Events in quadrant B | 6,869,274 | 263,155 |
| Events in quadrant C | 2,920,651 | 321,790 |
| Events in quadrant D | 5,960,988 | 291,158 |
| Mode M0 | |||
|---|---|---|---|
| Quadrant | BADHDUFLAG | Total packets | Discarded packets |
| A | 0 | 13637 | 2 |
| B | 0 | 24320 | 1 |
| C | 0 | 12305 | 1 |
| D | 0 | 21771 | 1 |
| Mode M9 | |||
|---|---|---|---|
| Quadrant | BADHDUFLAG | Total packets | Discarded packets |
| A | 0 | 14 | 0 |
| B | 0 | 14 | 0 |
| C | 0 | 14 | 0 |
| D | 0 | 14 | 0 |
| Mode SS | |||
|---|---|---|---|
| Quadrant | BADHDUFLAG | Total packets | Discarded packets |
| A | 0 | 120 | 0 |
| B | 0 | 120 | 0 |
| C | 0 | 120 | 0 |
| D | 0 | 120 | 0 |
| Quadrant | Total seconds | Saturated seconds | Saturation percentage |
|---|---|---|---|
| A | 5942 | 49 | 0.824638% |
| B | 5942 | 1104 | 18.579603% |
| C | 5942 | 9 | 0.151464% |
| D | 5942 | 805 | 13.547627% |
Noise dominated data is calculated using 1-second bins in cleaned event files. If a bin has >2000 counts, and if more than 50% of those come from <1% of pixels, then it is considered to be noise-dominated and hence unusable.
| Quadrant | # 1 sec bins | Bins with >0 counts | Bins with >2000 counts | High rate bins dominated by noise | Noise dominated (total time) | Noise dominated (detector-on time) | Marked lightcurve |
|---|---|---|---|---|---|---|---|
| A | 7298 | 5944 | 1 | 1 | 0.01% | 0.02% | 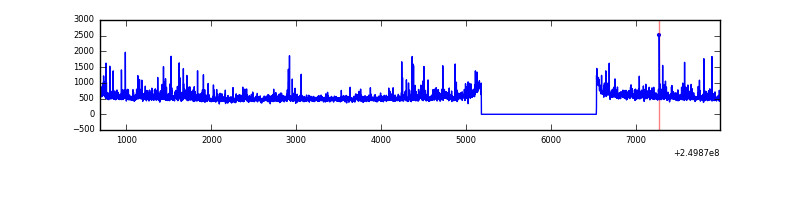 |
| B | 7298 | 5944 | 842 | 842 | 11.54% | 14.17% |  |
| C | 7298 | 5944 | 0 | 0 | 0.00% | 0.00% | 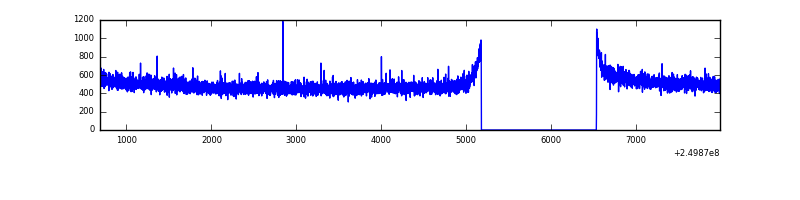 |
| D | 7298 | 5944 | 669 | 669 | 9.17% | 11.26% |  |
Top three noisy pixels from each quadrant. If the there are fewer than three noisy pixels in the level2.evt file, extra rows are filled as -1
| Pixel properties | Quadrant properties | ||||||
|---|---|---|---|---|---|---|---|
| Quadrant | DetID | PixID | Counts | Sigma | Mean | Median | Sigma |
| A | 1 | 162 | 138445 | 885.6 | 768 | 753 | 155.5 |
| A | 1 | 178 | 70489 | 448.52 | 768 | 753 | 155.5 |
| A | 1 | 161 | 62897 | 399.69 | 768 | 753 | 155.5 |
| B | 10 | 16 | 3525196 | 25920.11 | 733 | 719 | 136.0 |
| B | 4 | 239 | 323322 | 2372.52 | 733 | 719 | 136.0 |
| B | 15 | 204 | 64565 | 469.54 | 733 | 719 | 136.0 |
| C | 13 | 61 | 5690 | 28.75 | 748 | 756 | 171.6 |
| C | 14 | 234 | 2435 | 9.78 | 748 | 756 | 171.6 |
| C | 3 | 202 | 1846 | 6.35 | 748 | 756 | 171.6 |
| D | 13 | 137 | 1418555 | 8491.58 | 698 | 680 | 167.0 |
| D | 1 | 52 | 1281677 | 7671.83 | 698 | 680 | 167.0 |
| D | 10 | 199 | 463398 | 2771.19 | 698 | 680 | 167.0 |
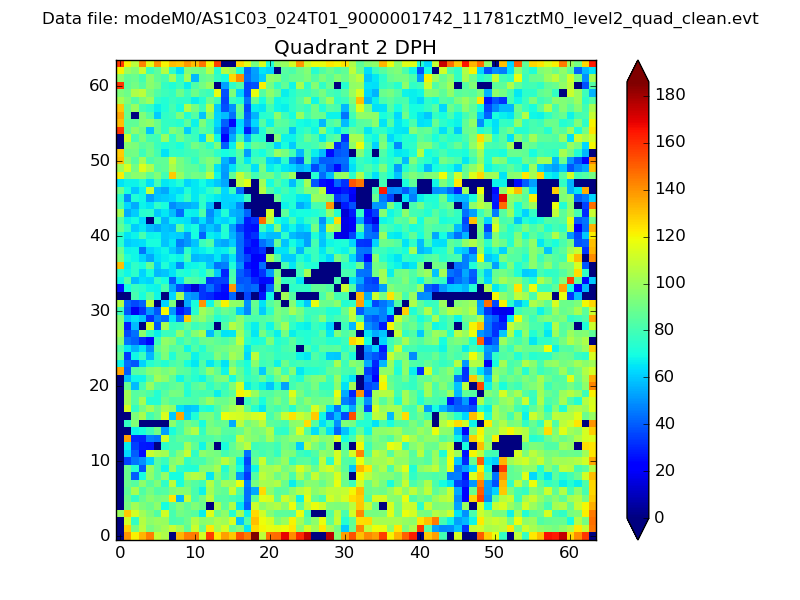
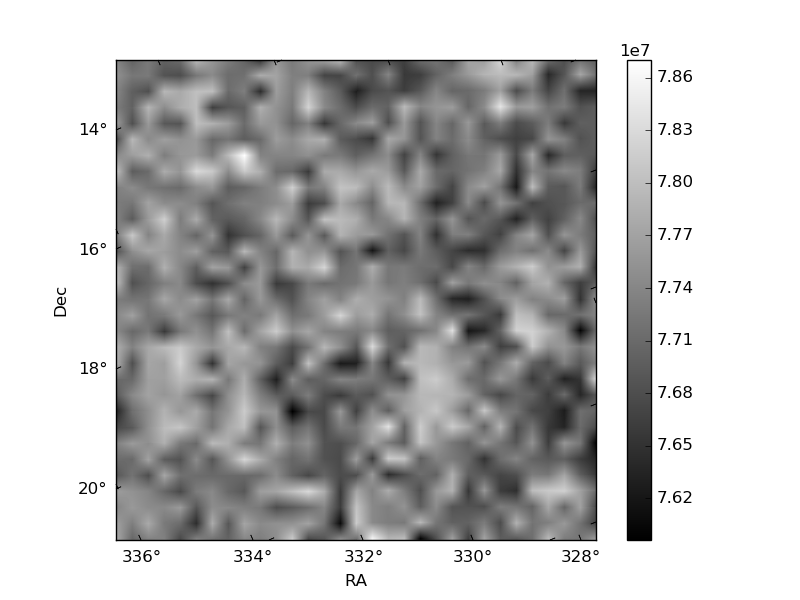
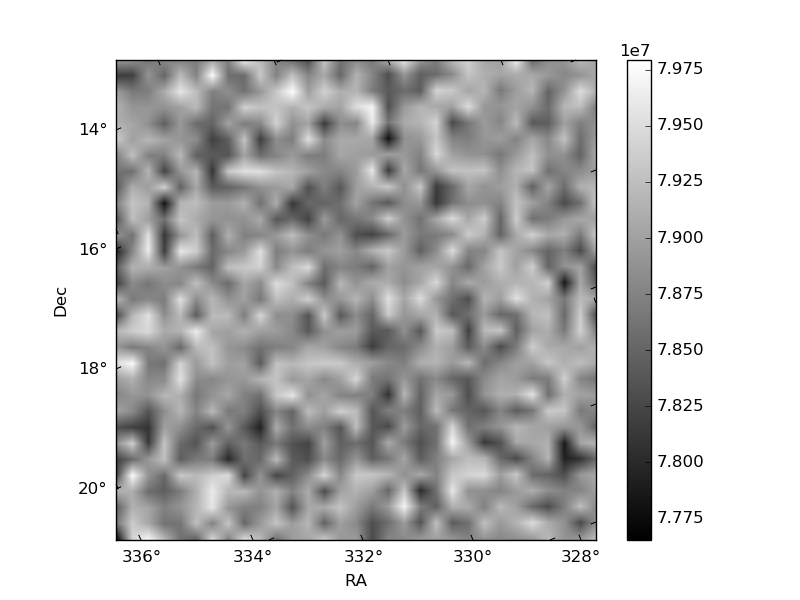
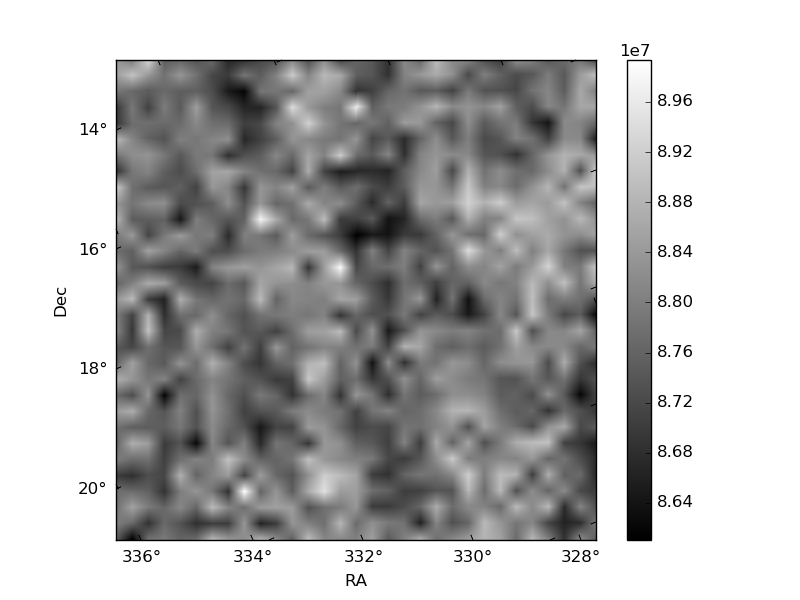
Histogram calculated using DETX and DETY for each event in the final _common_clean file
| Quadrant A | 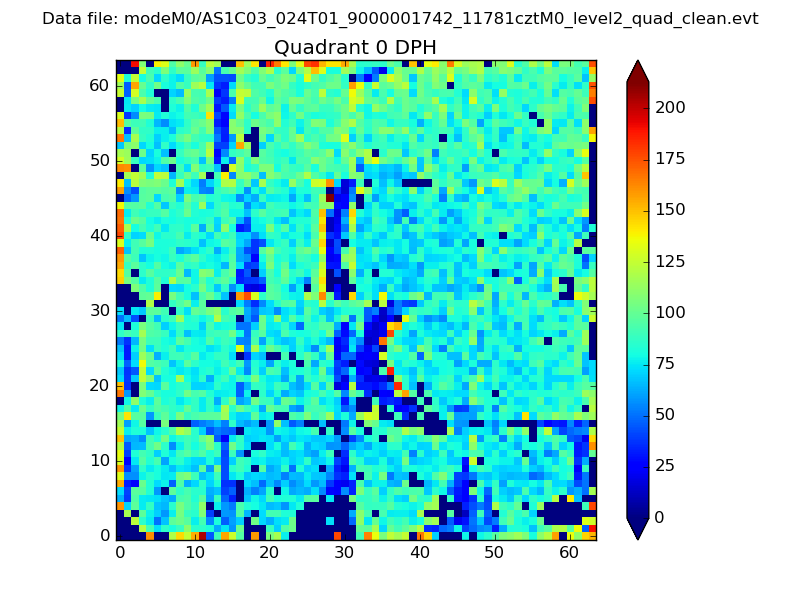 |
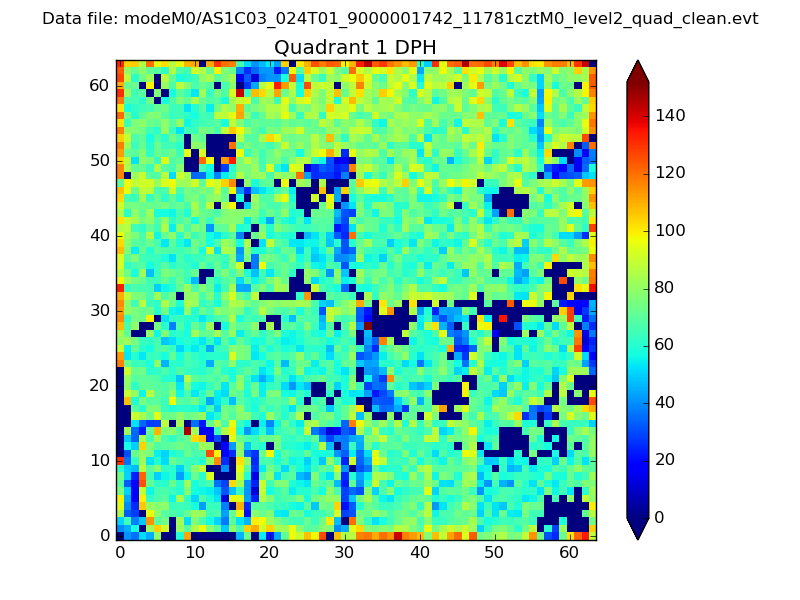 |
Quadrant B |
|---|---|---|---|
| Quadrant D | 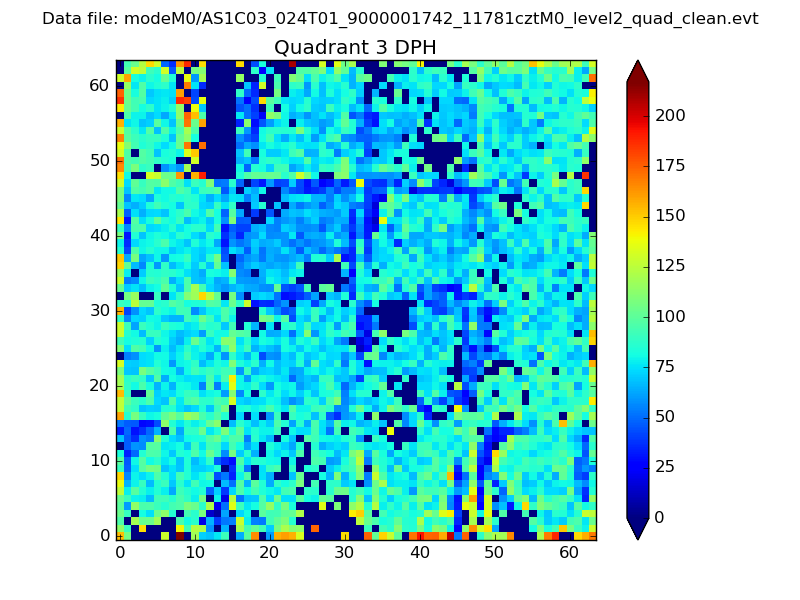 |
 |
Quadrant C |
| Plot type | Count rate plots | Images |
|---|---|---|
| Comparison with Poisson distribution Blue bars denote a histogram of data divided into 1 sec bins. Red curve is a Poisson curve with rate = median count rate of data. |
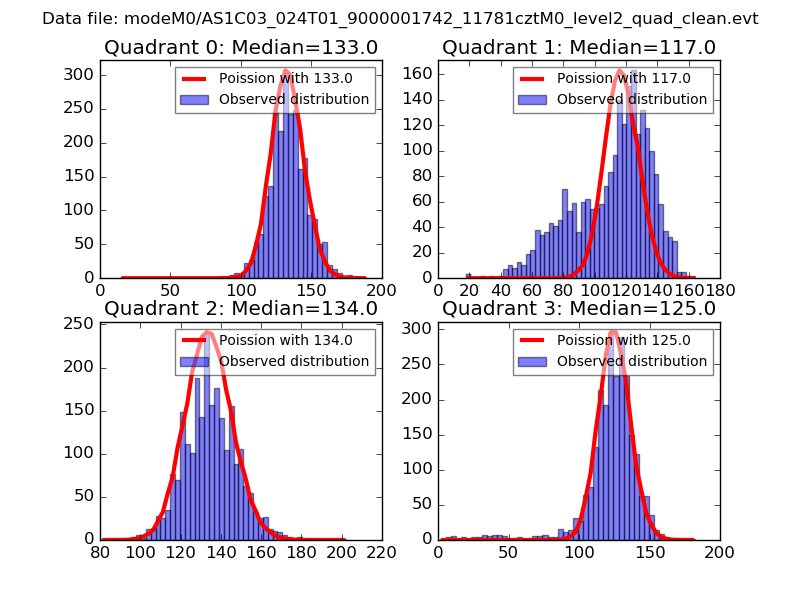 |
 |
| Quadrant-wise count rates Data is divided into 100 sec bins |
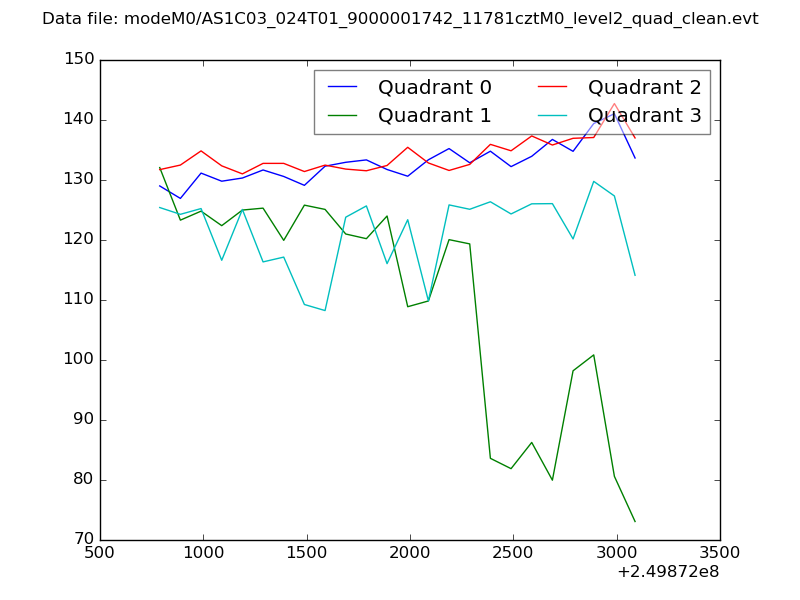 |
|
| Module-wise count rates for Quadrant A Data is divided into 100 sec bins |
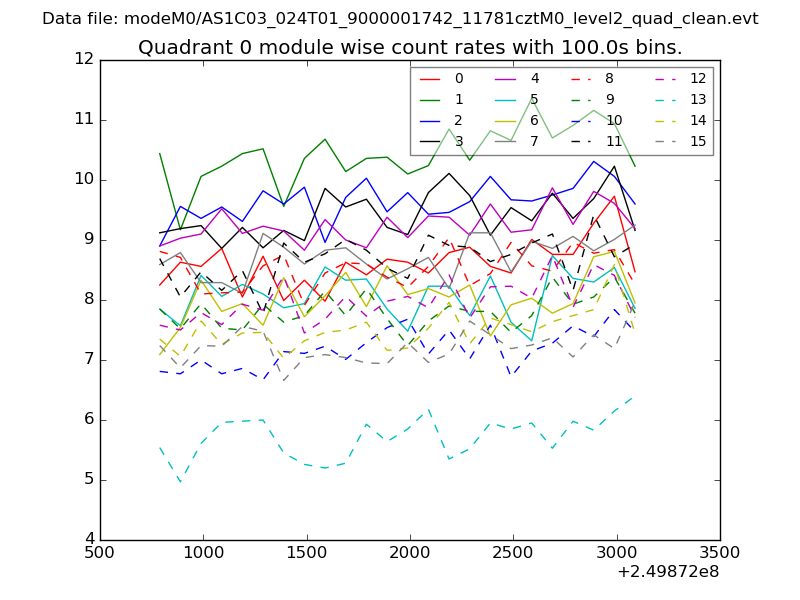 |
 |
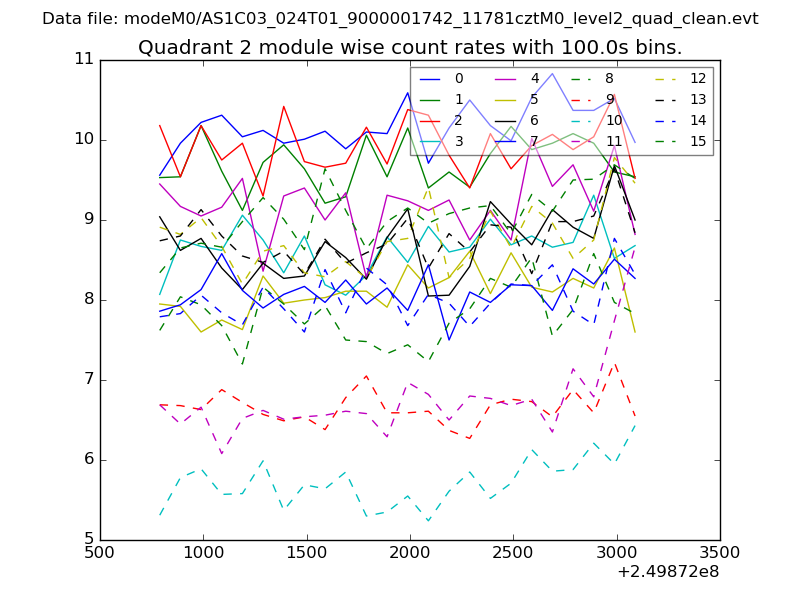
| Module-wise count rates for Quadrant B Data is divided into 100 sec bins |
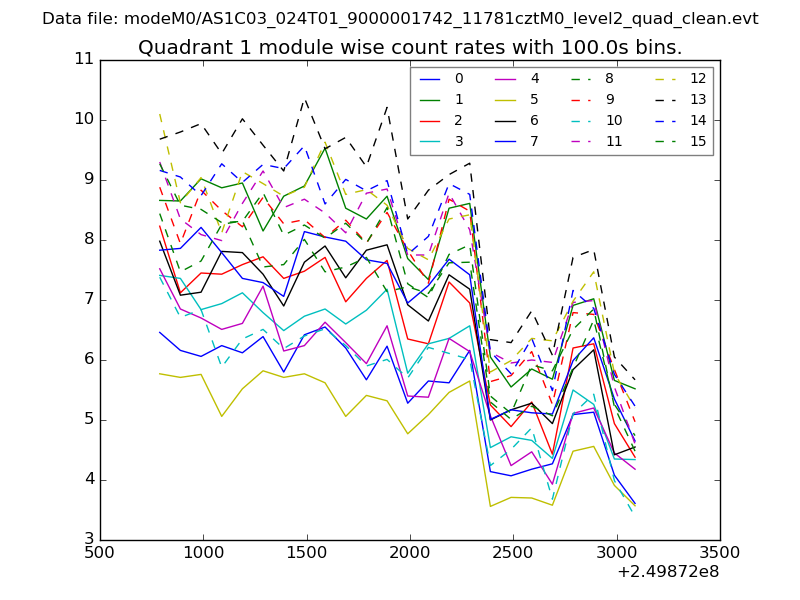 |
 |
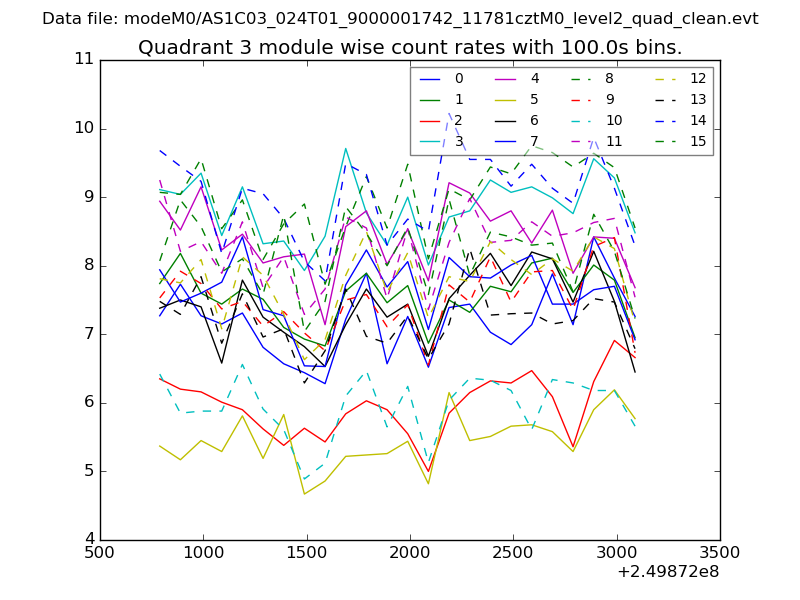
| Module-wise count rates for Quadrant C Data is divided into 100 sec bins |
 |
 |
| Module-wise count rates for Quadrant D Data is divided into 100 sec bins |
 |
 |
| Parameter | Plot |
|---|---|
| CZT HV Monitor | 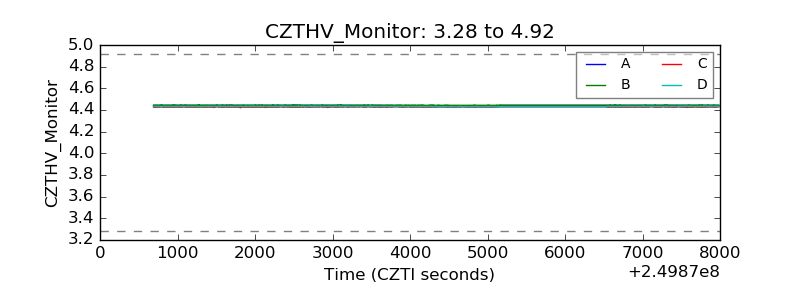 |
| D_VDD | 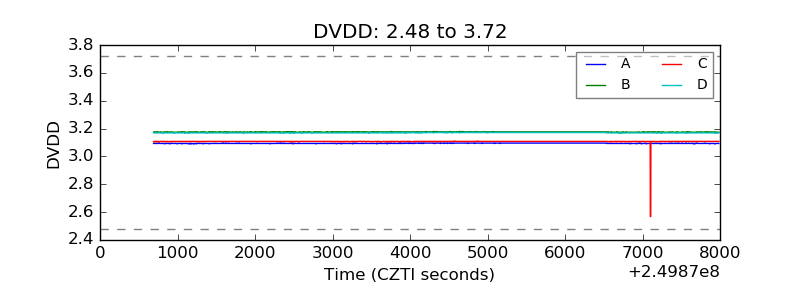 |
| Temperature 1 | 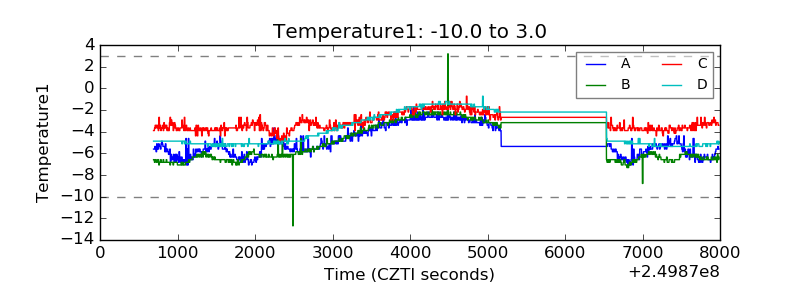 |
| Veto HV Monitor | 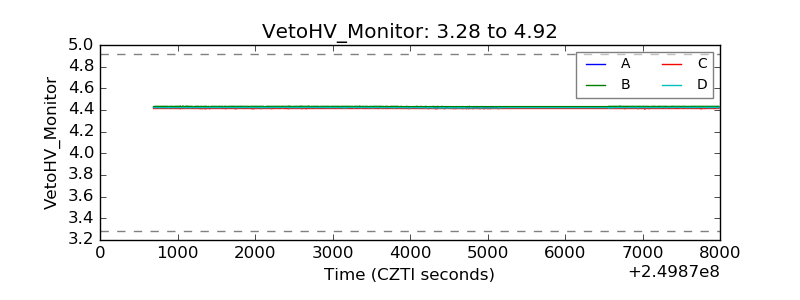 |
| Veto LLD | 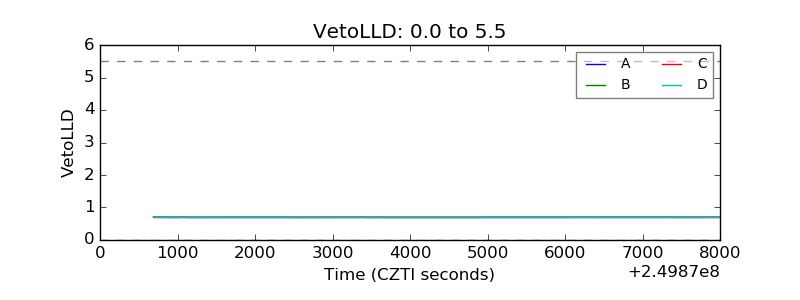 |
| Alpha Counter | 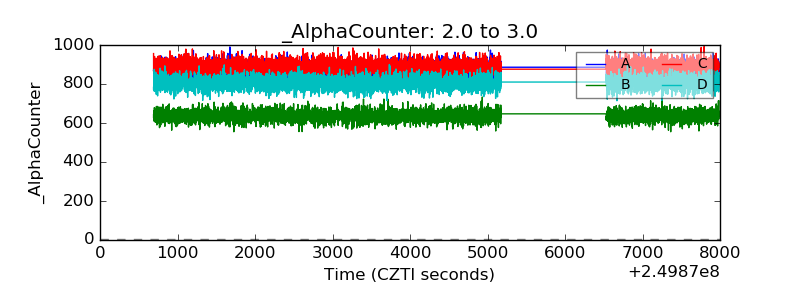 |
| _CPM_Rate |  |
| CZT Counter | 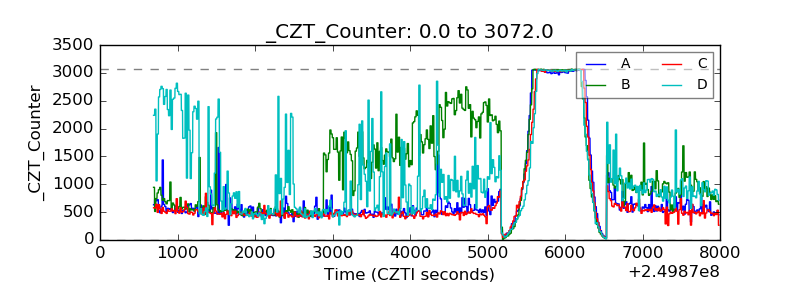 |
| +2.5 Volts monitor |  |
| +5 Volts monitor |  |
| _ROLL_ROT | 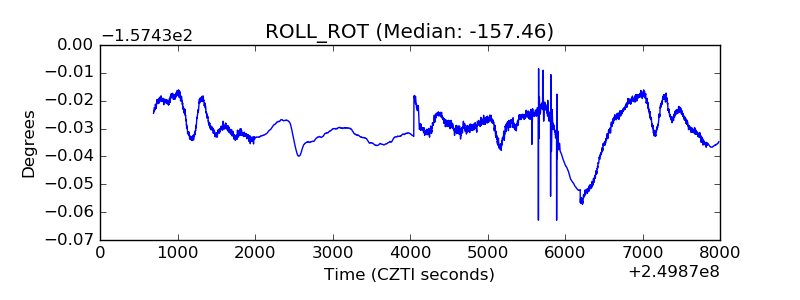 |
| _Roll_DEC | 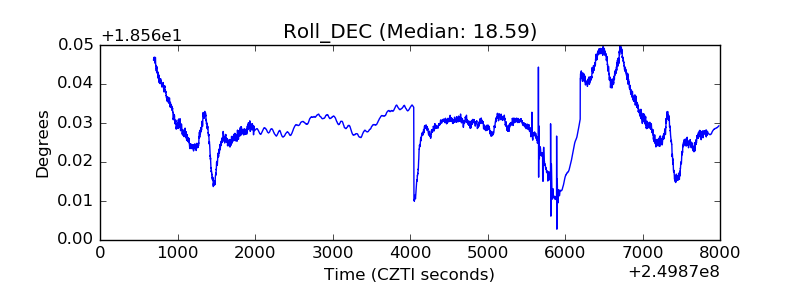 |
| _Roll_RA | 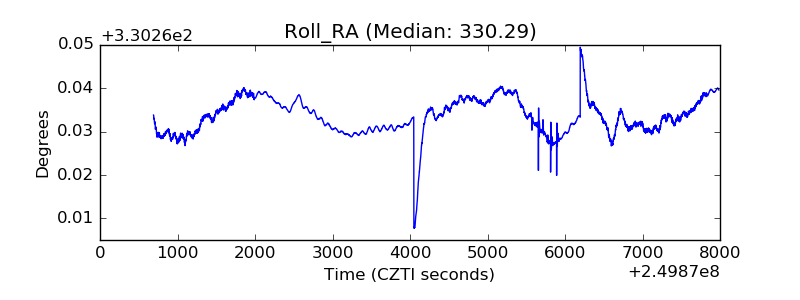 |
| Veto Counter | 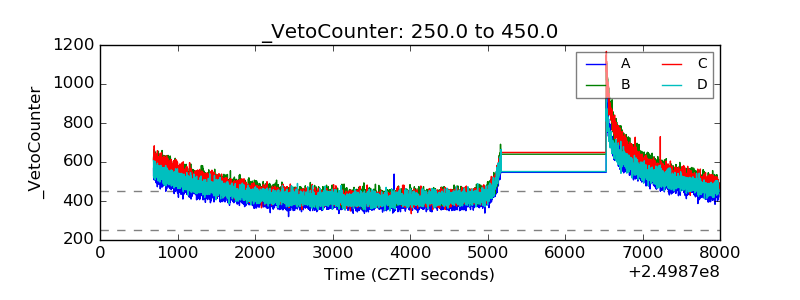 |