| Param | Original file | Final file |
|---|---|---|
| Filename | modeM0/AS1C03_024T01_9000001742_11783cztM0_level2.evt | modeM0/AS1C03_024T01_9000001742_11783cztM0_level2_quad_clean.evt |
| Size (bytes) | 596,839,680 | 71,190,720 |
| Size | 569.2 MB | 67.9 MB |
| Events in quadrant A | 3,652,581 | 439,635 |
| Events in quadrant B | 5,752,551 | 423,913 |
| Events in quadrant C | 3,034,885 | 445,592 |
| Events in quadrant D | 5,215,795 | 412,998 |
| Mode M0 | |||
|---|---|---|---|
| Quadrant | BADHDUFLAG | Total packets | Discarded packets |
| A | 0 | 14705 | 2 |
| B | 0 | 21466 | 1 |
| C | 0 | 12921 | 1 |
| D | 0 | 19810 | 1 |
| Mode M9 | |||
|---|---|---|---|
| Quadrant | BADHDUFLAG | Total packets | Discarded packets |
| A | 0 | 13 | 0 |
| B | 0 | 13 | 0 |
| C | 0 | 13 | 0 |
| D | 0 | 13 | 0 |
| Mode SS | |||
|---|---|---|---|
| Quadrant | BADHDUFLAG | Total packets | Discarded packets |
| A | 0 | 126 | 0 |
| B | 0 | 126 | 0 |
| C | 0 | 126 | 0 |
| D | 0 | 126 | 0 |
| Quadrant | Total seconds | Saturated seconds | Saturation percentage |
|---|---|---|---|
| A | 6207 | 147 | 2.368294% |
| B | 6207 | 505 | 8.135976% |
| C | 6207 | 61 | 0.982761% |
| D | 6207 | 146 | 2.352183% |
Noise dominated data is calculated using 1-second bins in cleaned event files. If a bin has >2000 counts, and if more than 50% of those come from <1% of pixels, then it is considered to be noise-dominated and hence unusable.
| Quadrant | # 1 sec bins | Bins with >0 counts | Bins with >2000 counts | High rate bins dominated by noise | Noise dominated (total time) | Noise dominated (detector-on time) | Marked lightcurve |
|---|---|---|---|---|---|---|---|
| A | 7453 | 6209 | 5 | 5 | 0.07% | 0.08% | 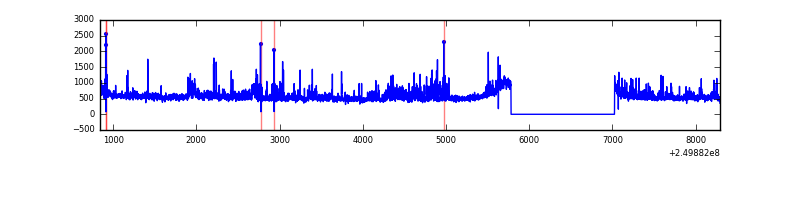 |
| B | 7453 | 6209 | 236 | 236 | 3.17% | 3.80% | 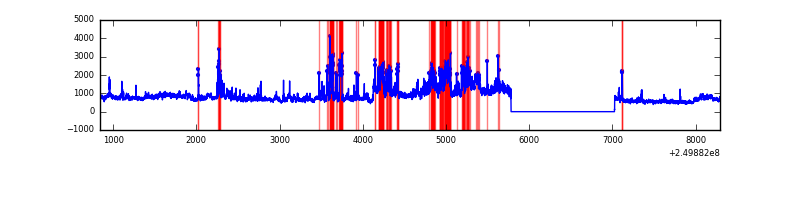 |
| C | 7453 | 6209 | 0 | 0 | 0.00% | 0.00% | 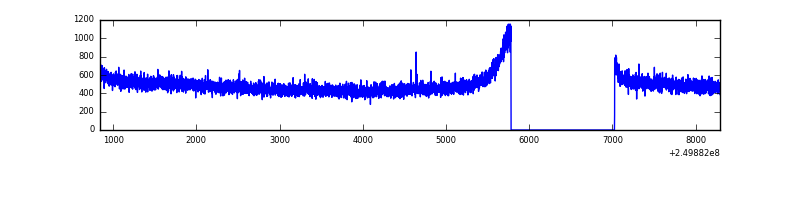 |
| D | 7453 | 6209 | 92 | 92 | 1.23% | 1.48% | 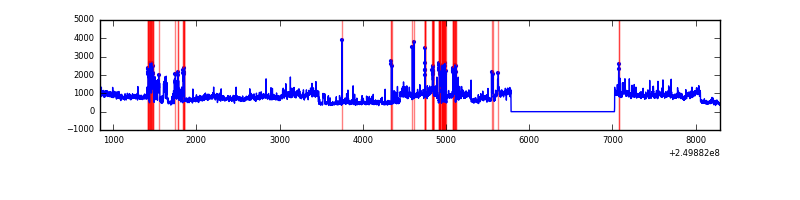 |
Top three noisy pixels from each quadrant. If the there are fewer than three noisy pixels in the level2.evt file, extra rows are filled as -1
| Pixel properties | Quadrant properties | ||||||
|---|---|---|---|---|---|---|---|
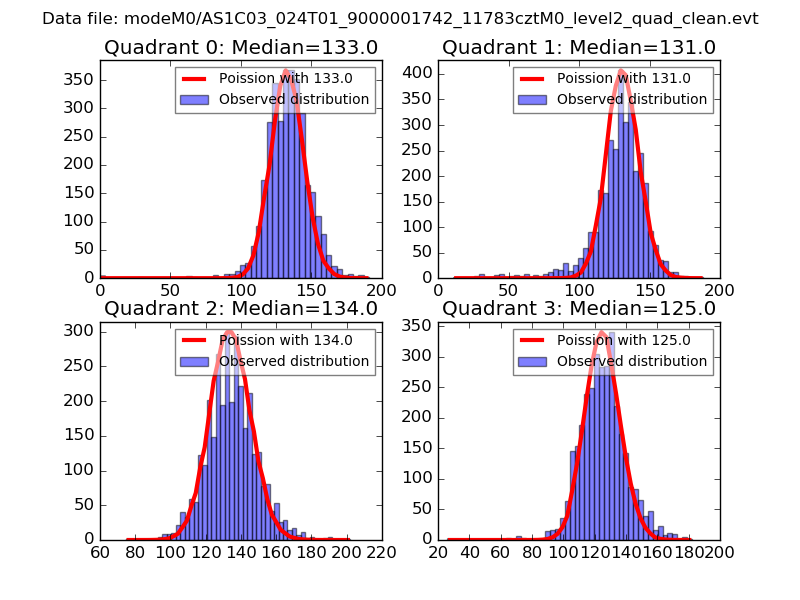
| Quadrant | DetID | PixID | Counts | Sigma | Mean | Median | Sigma |
| A | 8 | 15 | 195824 | 1207.92 | 804 | 789 | 161.5 |
| A | 1 | 162 | 132831 | 817.78 | 804 | 789 | 161.5 |
| A | 1 | 178 | 72242 | 442.53 | 804 | 789 | 161.5 |
| B | 10 | 16 | 1559082 | 10438.61 | 790 | 774 | 149.3 |
| B | 4 | 239 | 787203 | 5268.04 | 790 | 774 | 149.3 |
| B | 15 | 204 | 141167 | 940.45 | 790 | 774 | 149.3 |
| C | 13 | 61 | 5633 | 26.94 | 778 | 784 | 180.0 |
| C | 14 | 234 | 3772 | 16.6 | 778 | 784 | 180.0 |
| C | 3 | 202 | 1950 | 6.48 | 778 | 784 | 180.0 |
| D | 1 | 52 | 2051662 | 11193.79 | 765 | 746 | 183.2 |
| D | 8 | 195 | 156030 | 847.53 | 765 | 746 | 183.2 |
| D | 13 | 104 | 40232 | 215.51 | 765 | 746 | 183.2 |
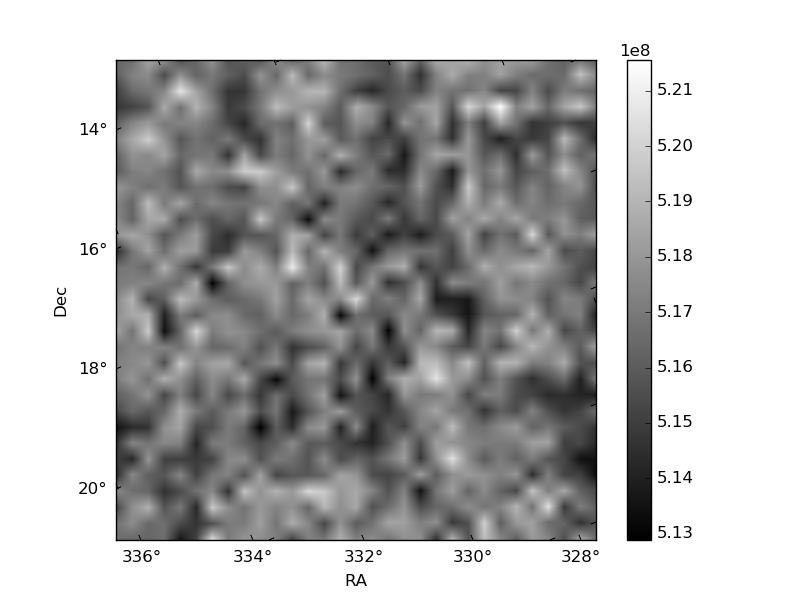
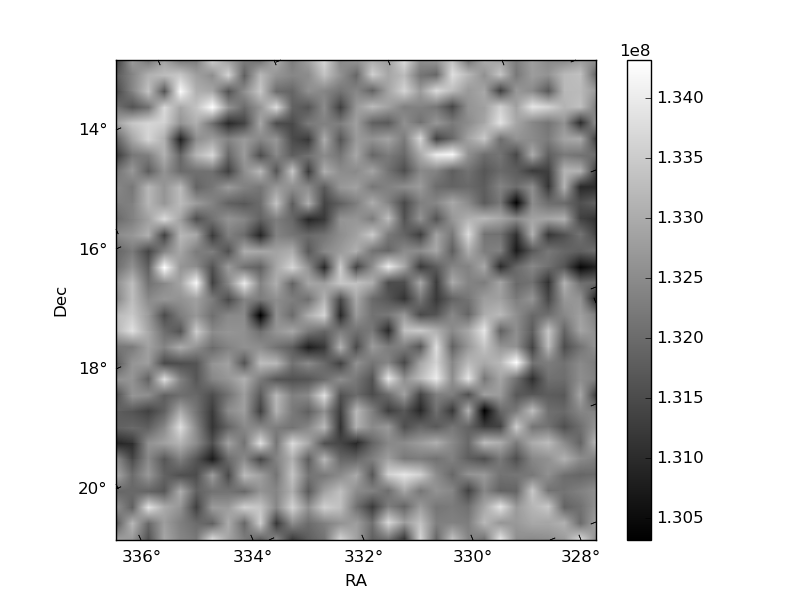
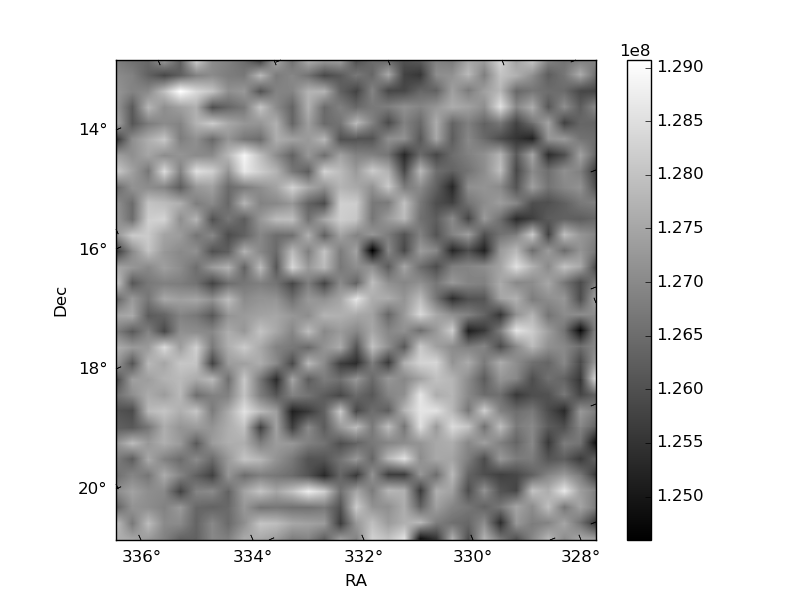
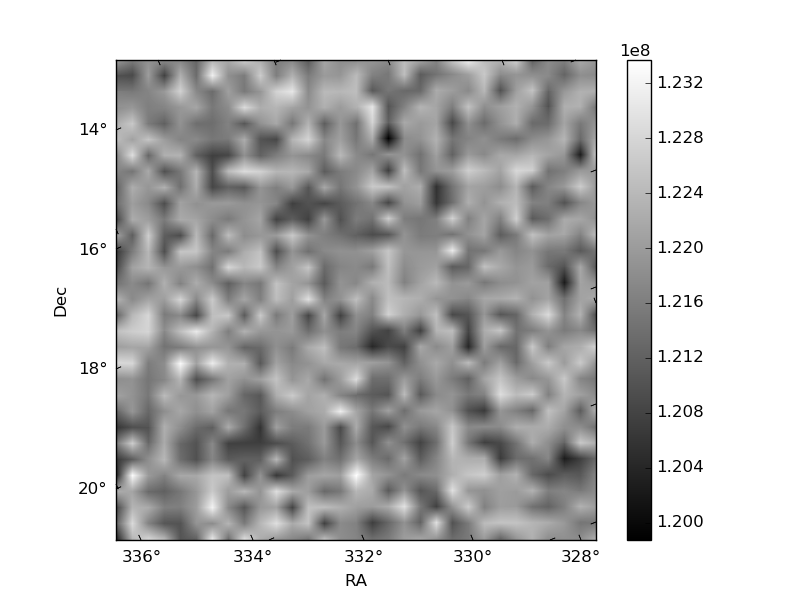
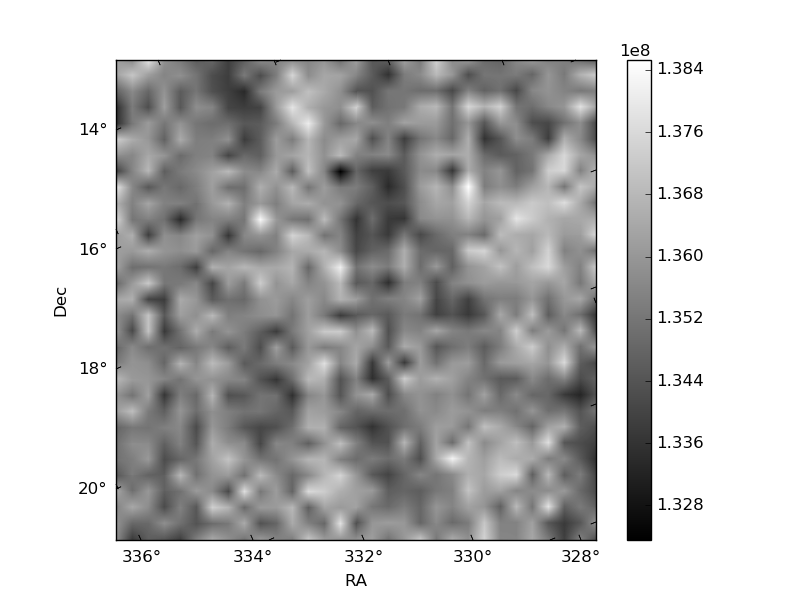
Histogram calculated using DETX and DETY for each event in the final _common_clean file
| Quadrant A | 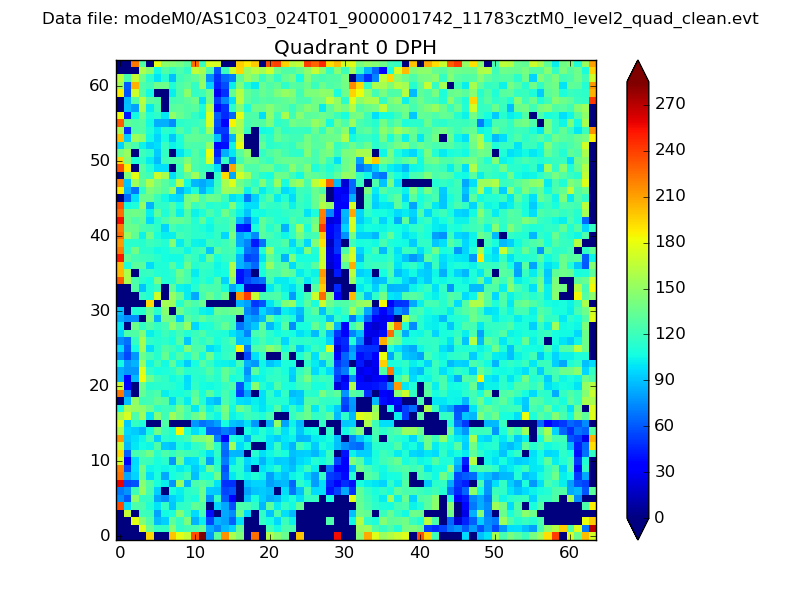 |
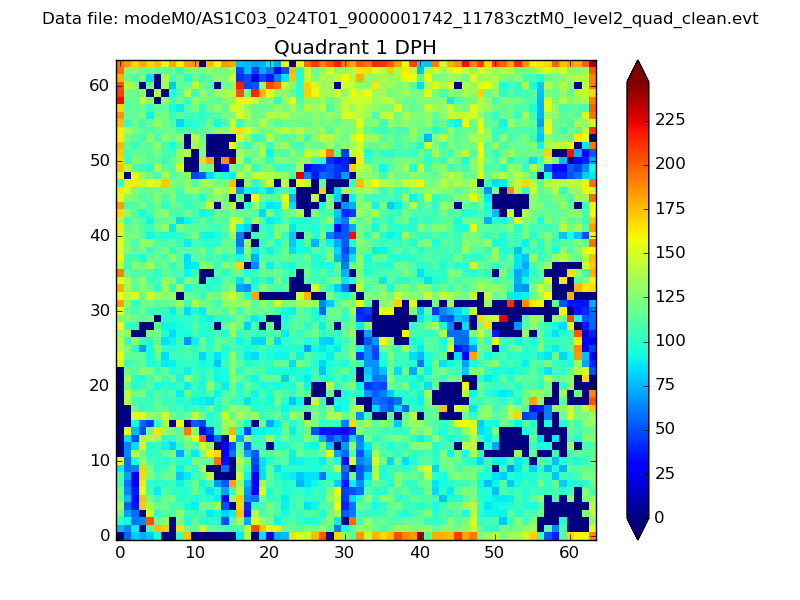 |
Quadrant B |
|---|---|---|---|
| Quadrant D | 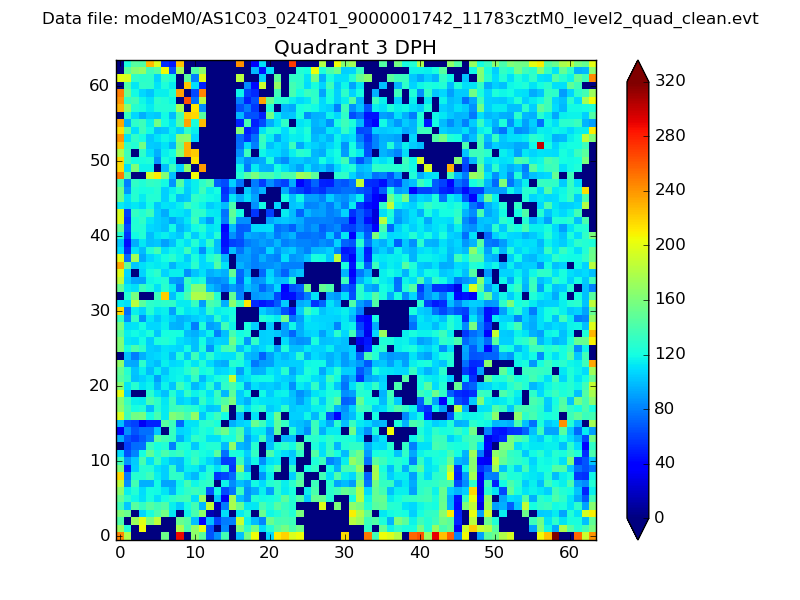 |
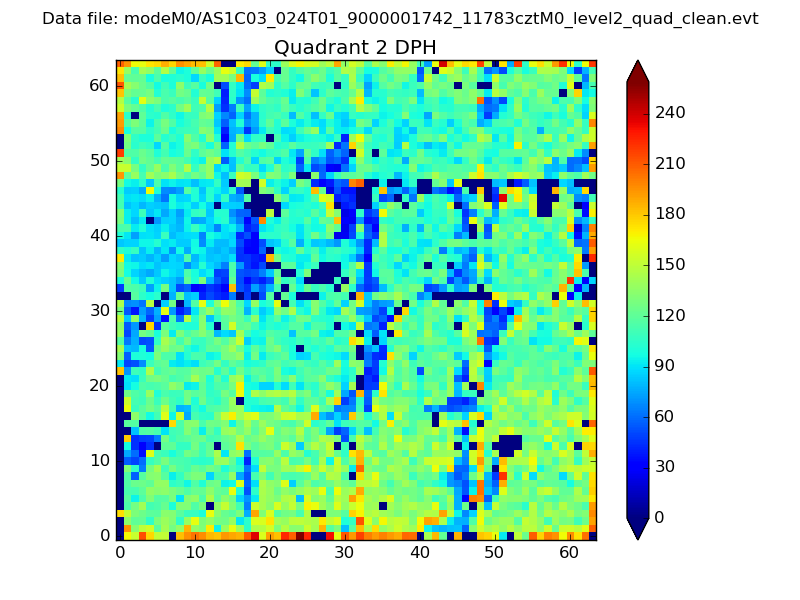 |
Quadrant C |
| Plot type | Count rate plots | Images |
|---|---|---|
| Comparison with Poisson distribution Blue bars denote a histogram of data divided into 1 sec bins. Red curve is a Poisson curve with rate = median count rate of data. |
 |
 |
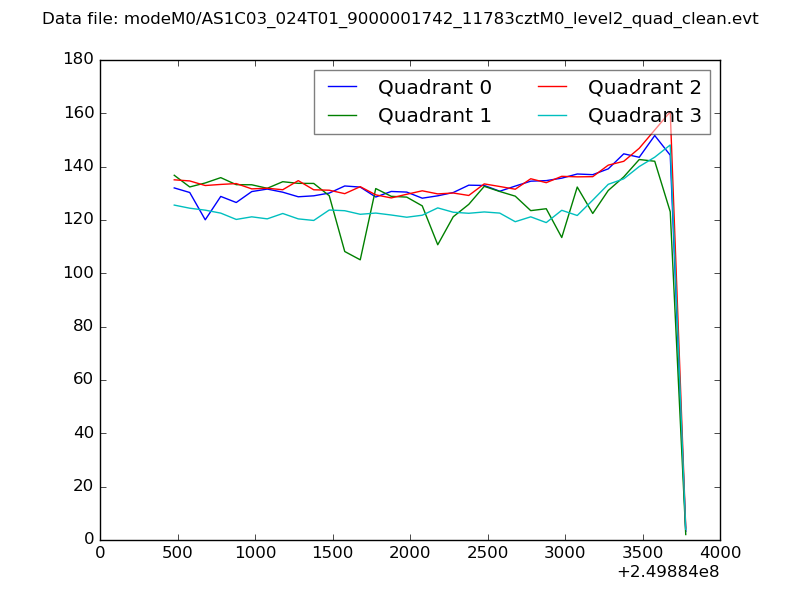
| Quadrant-wise count rates Data is divided into 100 sec bins |
 |
|
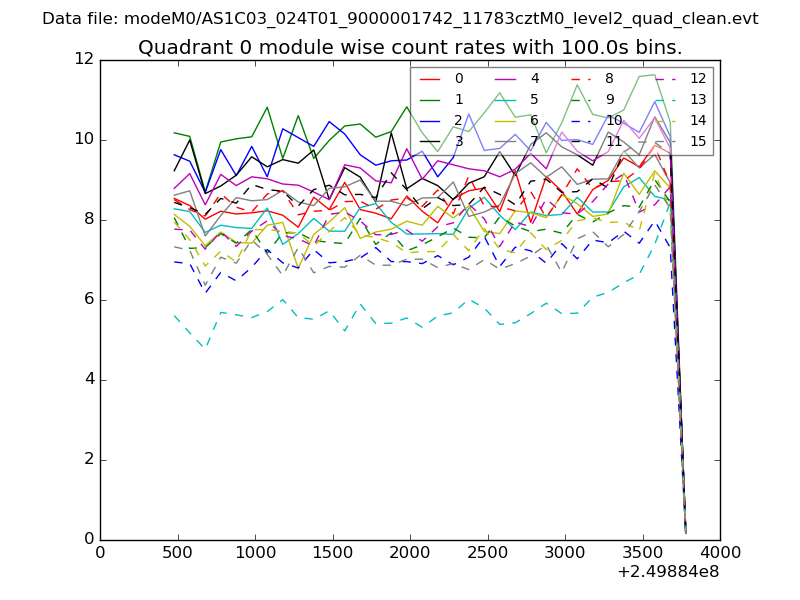
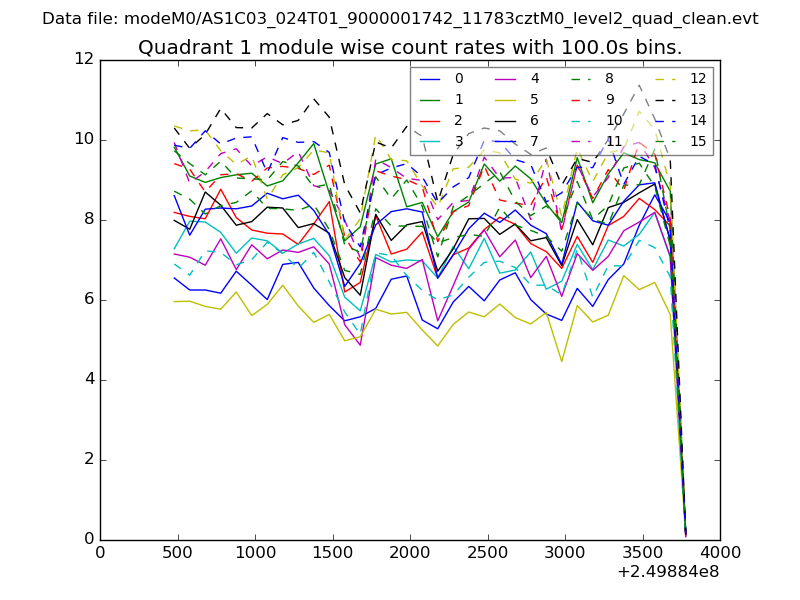
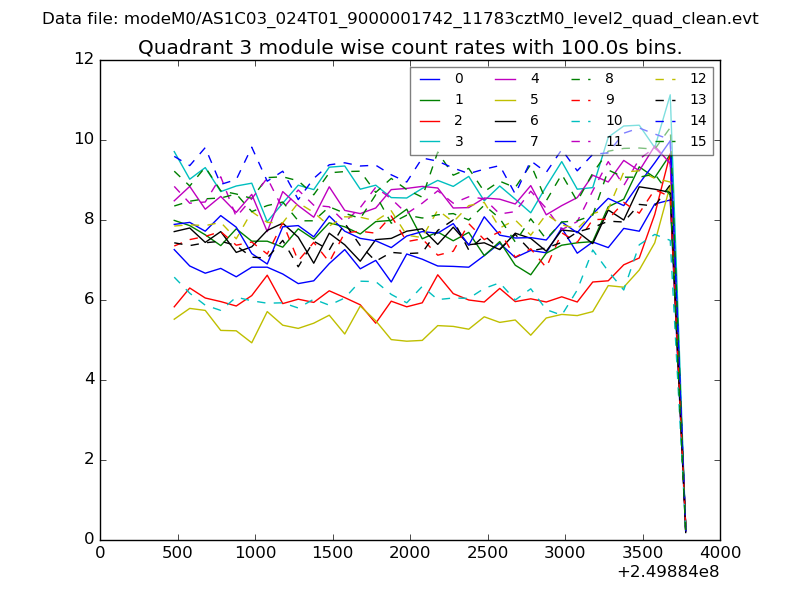
| Module-wise count rates for Quadrant A Data is divided into 100 sec bins |
 |
 |
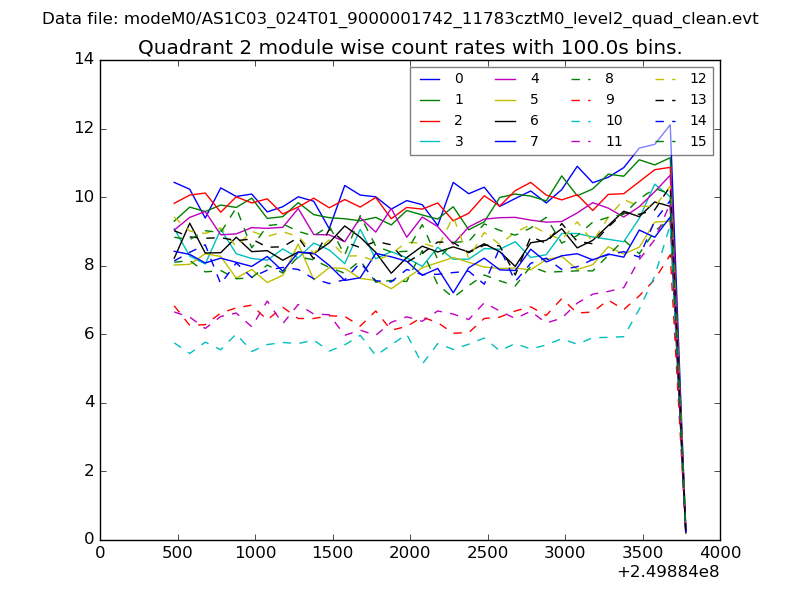
| Module-wise count rates for Quadrant B Data is divided into 100 sec bins |
 |
 |
| Module-wise count rates for Quadrant C Data is divided into 100 sec bins |
 |
 |
| Module-wise count rates for Quadrant D Data is divided into 100 sec bins |
 |
 |
| Parameter | Plot |
|---|---|
| CZT HV Monitor | 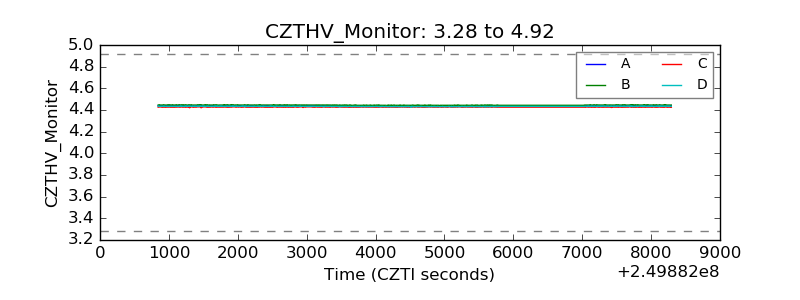 |
| D_VDD | 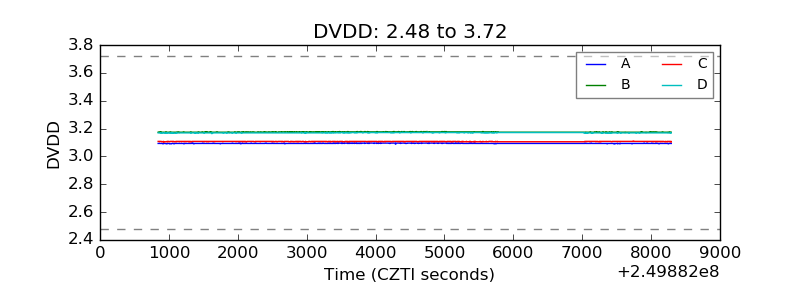 |
| Temperature 1 | 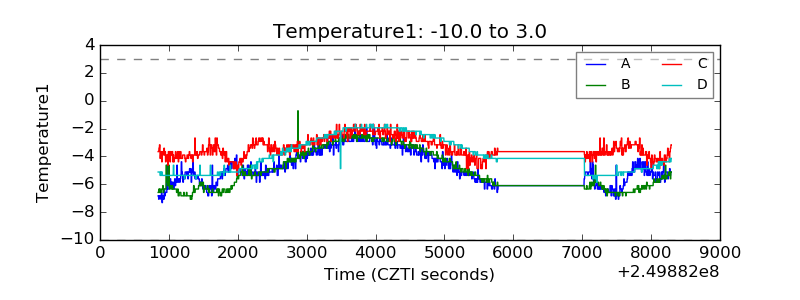 |
| Veto HV Monitor | 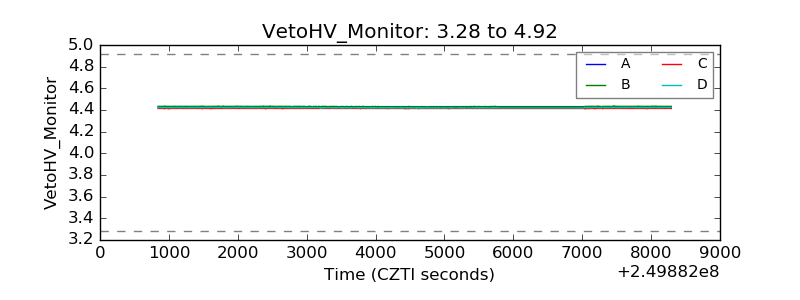 |
| Veto LLD |  |
| Alpha Counter | 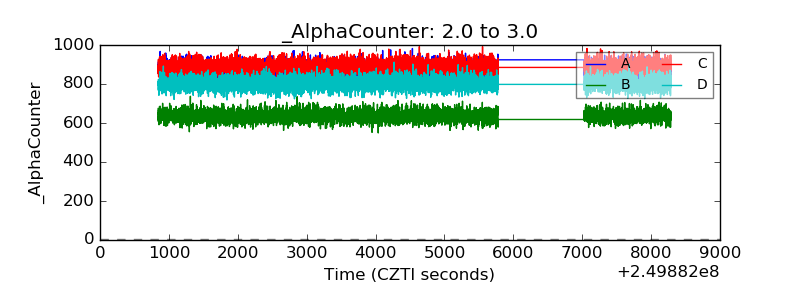 |
| _CPM_Rate | 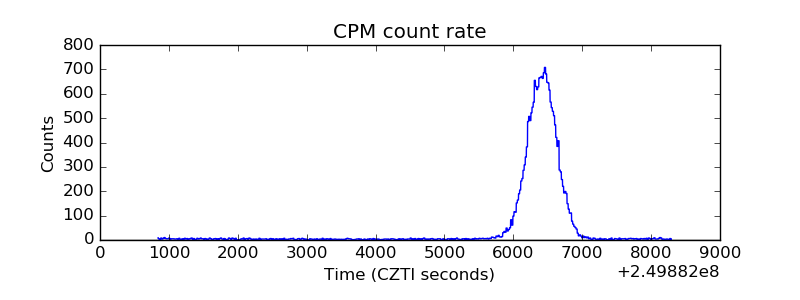 |
| CZT Counter | 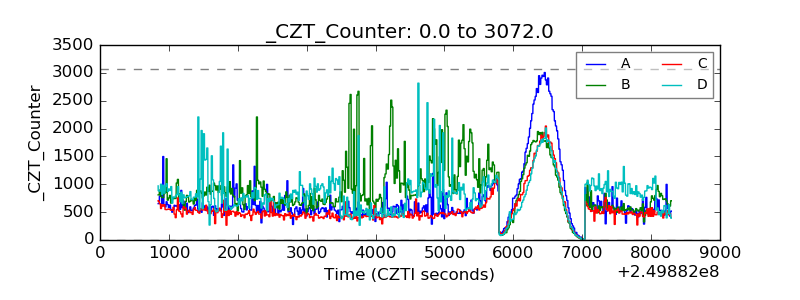 |
| +2.5 Volts monitor |  |
| +5 Volts monitor |  |
| _ROLL_ROT | 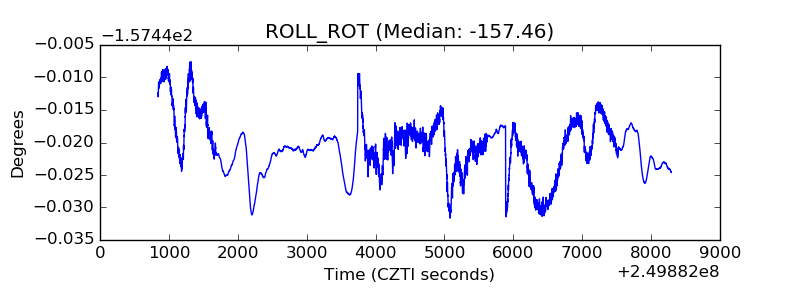 |
| _Roll_DEC | 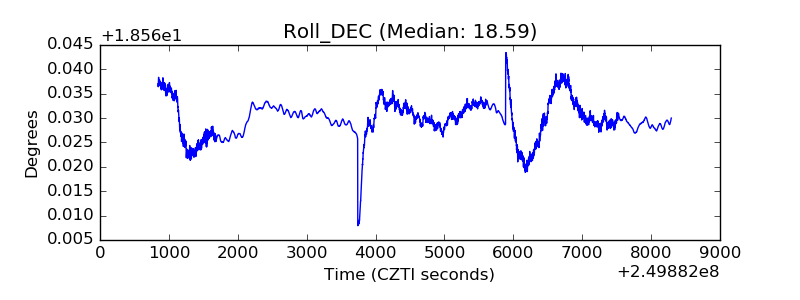 |
| _Roll_RA | 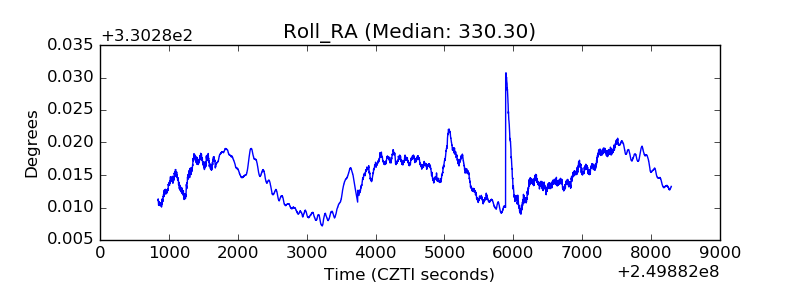 |
| Veto Counter | 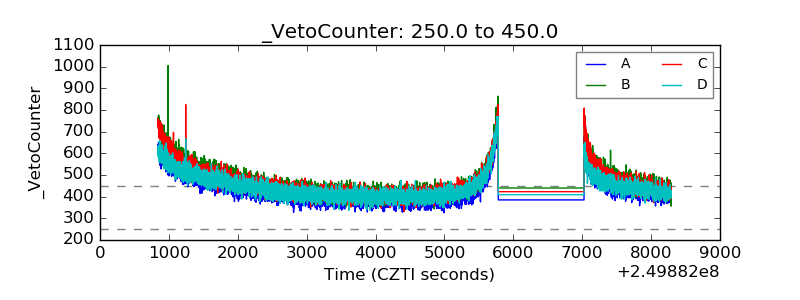 |