| Param | Original file | Final file |
|---|---|---|
| Filename | modeM0/AS1C03_024T01_9000001742_11784cztM0_level2.evt | modeM0/AS1C03_024T01_9000001742_11784cztM0_level2_quad_clean.evt |
| Size (bytes) | 939,464,640 | 151,902,720 |
| Size | 895.9 MB | 144.9 MB |
| Events in quadrant A | 6,164,893 | 981,014 |
| Events in quadrant B | 8,579,910 | 964,177 |
| Events in quadrant C | 5,007,929 | 989,658 |
| Events in quadrant D | 7,978,054 | 925,865 |
| Mode M0 | |||
|---|---|---|---|
| Quadrant | BADHDUFLAG | Total packets | Discarded packets |
| A | 0 | 26354 | 1327 |
| B | 0 | 33264 | 465 |
| C | 0 | 22491 | 497 |
| D | 0 | 31490 | 577 |
| Mode M9 | |||
|---|---|---|---|
| Quadrant | BADHDUFLAG | Total packets | Discarded packets |
| A | 0 | 22 | 0 |
| B | 0 | 22 | 0 |
| C | 0 | 22 | 0 |
| D | 0 | 22 | 0 |
| Mode SS | |||
|---|---|---|---|
| Quadrant | BADHDUFLAG | Total packets | Discarded packets |
| A | 0 | 220 | 6 |
| B | 0 | 220 | 4 |
| C | 0 | 220 | 8 |
| D | 0 | 220 | 4 |
| Quadrant | Total seconds | Saturated seconds | Saturation percentage |
|---|---|---|---|
| A | 10675 | 283 | 2.651054% |
| B | 10709 | 686 | 6.405827% |
| C | 10696 | 86 | 0.804039% |
| D | 10703 | 180 | 1.681771% |
Noise dominated data is calculated using 1-second bins in cleaned event files. If a bin has >2000 counts, and if more than 50% of those come from <1% of pixels, then it is considered to be noise-dominated and hence unusable.
| Quadrant | # 1 sec bins | Bins with >0 counts | Bins with >2000 counts | High rate bins dominated by noise | Noise dominated (total time) | Noise dominated (detector-on time) | Marked lightcurve |
|---|---|---|---|---|---|---|---|
| A | 13025 | 10702 | 69 | 69 | 0.53% | 0.64% | 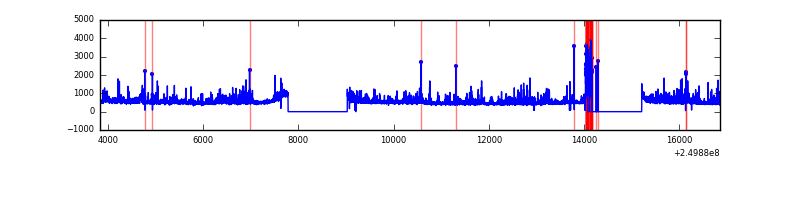 |
| B | 13025 | 10745 | 325 | 325 | 2.50% | 3.02% | 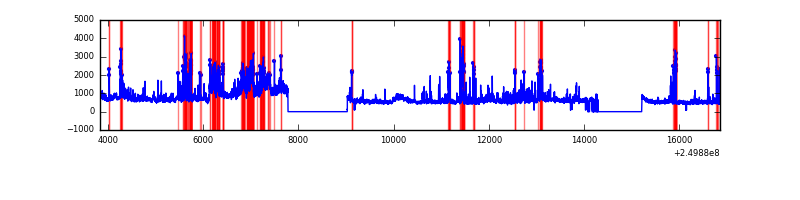 |
| C | 13025 | 10732 | 0 | 0 | 0.00% | 0.00% | 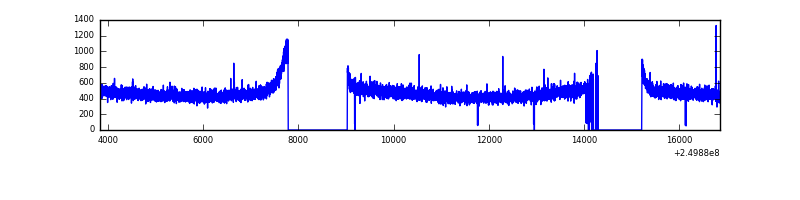 |
| D | 13025 | 10735 | 90 | 90 | 0.69% | 0.84% | 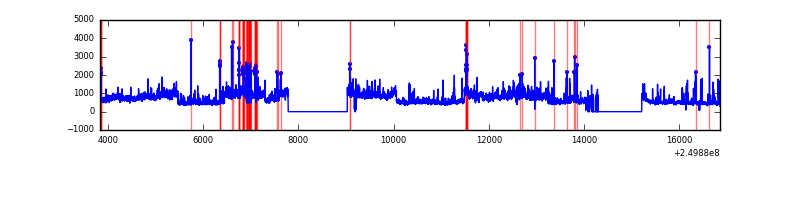 |
Top three noisy pixels from each quadrant. If the there are fewer than three noisy pixels in the level2.evt file, extra rows are filled as -1
| Pixel properties | Quadrant properties | ||||||
|---|---|---|---|---|---|---|---|
| Quadrant | DetID | PixID | Counts | Sigma | Mean | Median | Sigma |
| A | 8 | 15 | 238124 | 897.01 | 1314 | 1290 | 264.0 |
| A | 1 | 162 | 223463 | 841.48 | 1314 | 1290 | 264.0 |
| A | 15 | 174 | 197413 | 742.82 | 1314 | 1290 | 264.0 |
| B | 10 | 16 | 1538419 | 6192.91 | 1311 | 1282 | 248.2 |
| B | 4 | 239 | 1225052 | 4930.4 | 1311 | 1282 | 248.2 |
| B | 15 | 204 | 266898 | 1070.13 | 1311 | 1282 | 248.2 |
| C | 13 | 61 | 9187 | 26.76 | 1283 | 1294 | 294.9 |
| C | 14 | 234 | 6037 | 16.08 | 1283 | 1294 | 294.9 |
| C | 3 | 202 | 3127 | 6.22 | 1283 | 1294 | 294.9 |
| D | 1 | 52 | 2410807 | 7912.91 | 1273 | 1242 | 304.5 |
| D | 8 | 195 | 497511 | 1629.73 | 1273 | 1242 | 304.5 |
| D | 13 | 104 | 58269 | 187.27 | 1273 | 1242 | 304.5 |
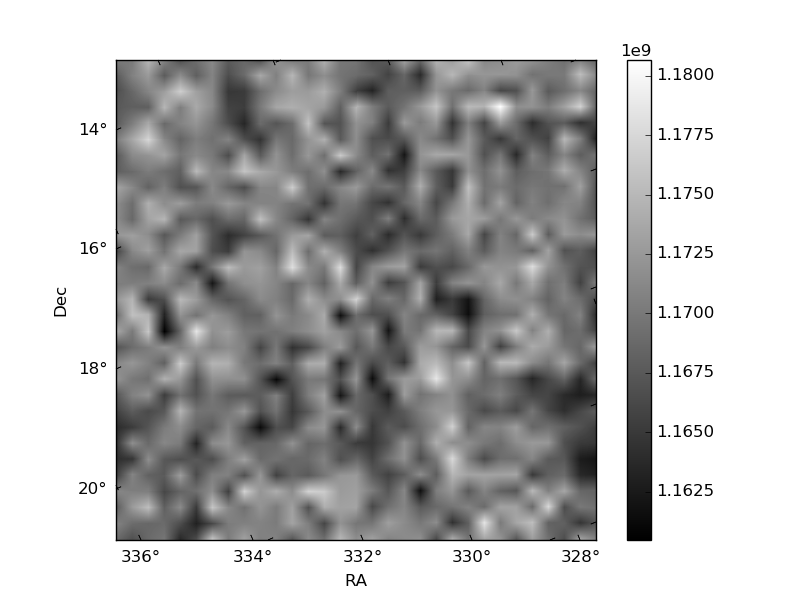
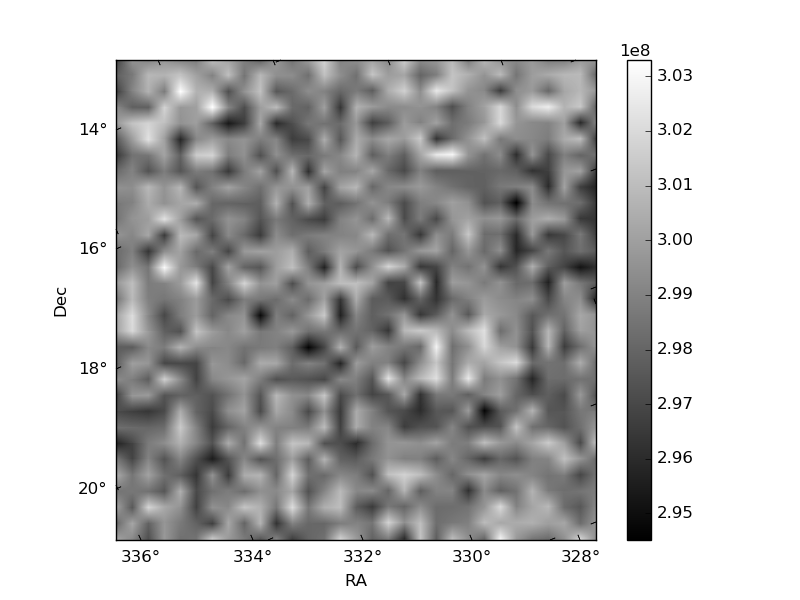
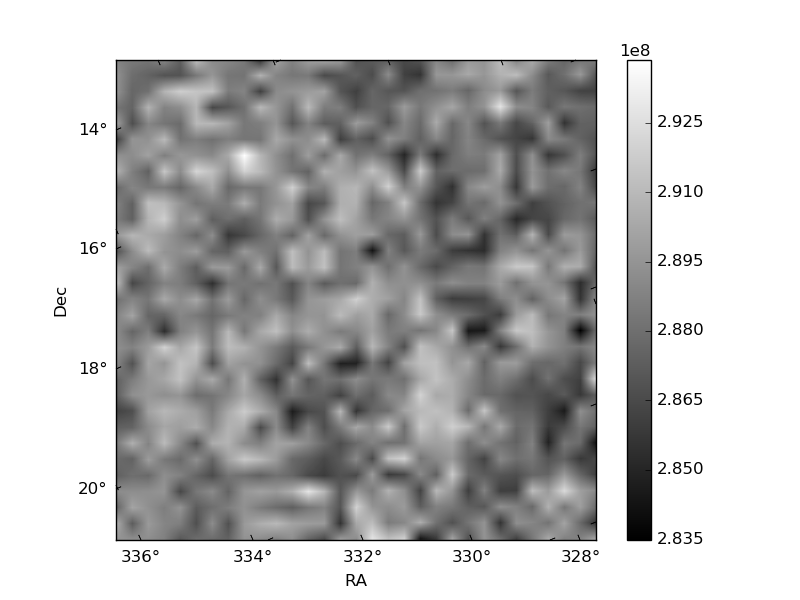
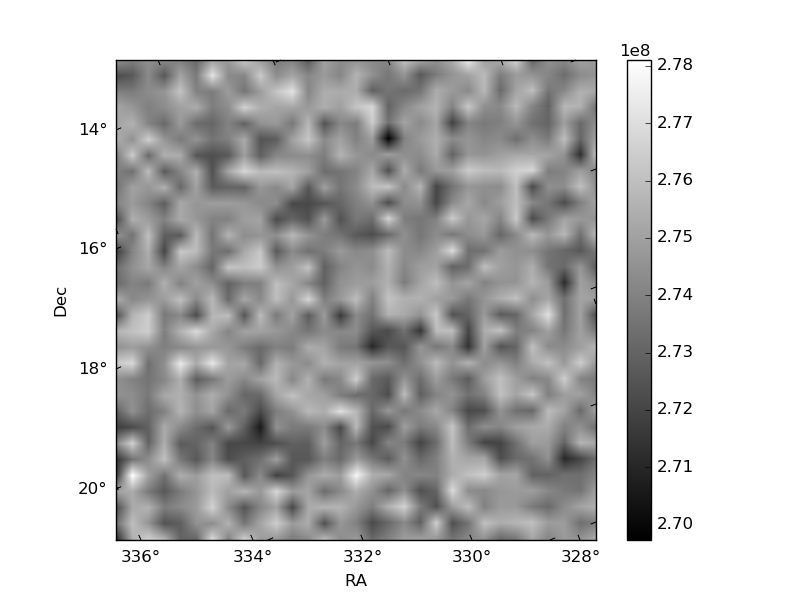
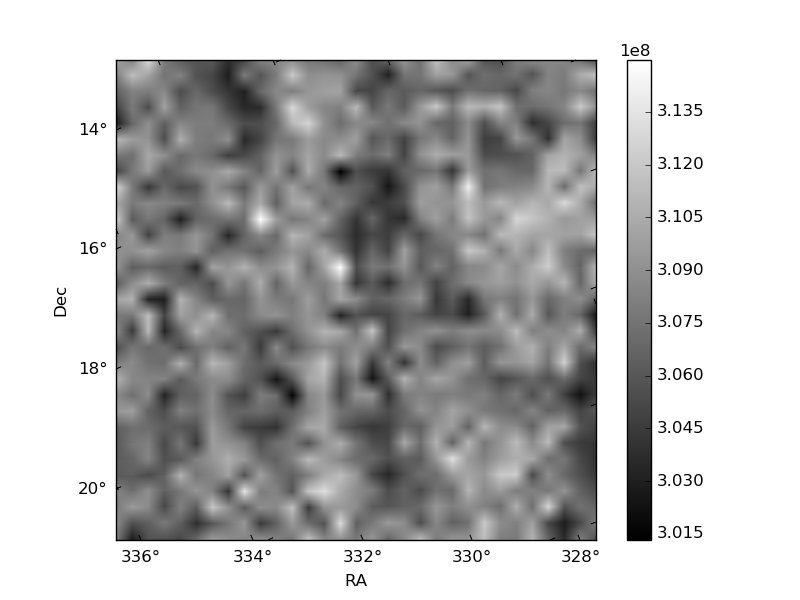
Histogram calculated using DETX and DETY for each event in the final _common_clean file
| Quadrant A | 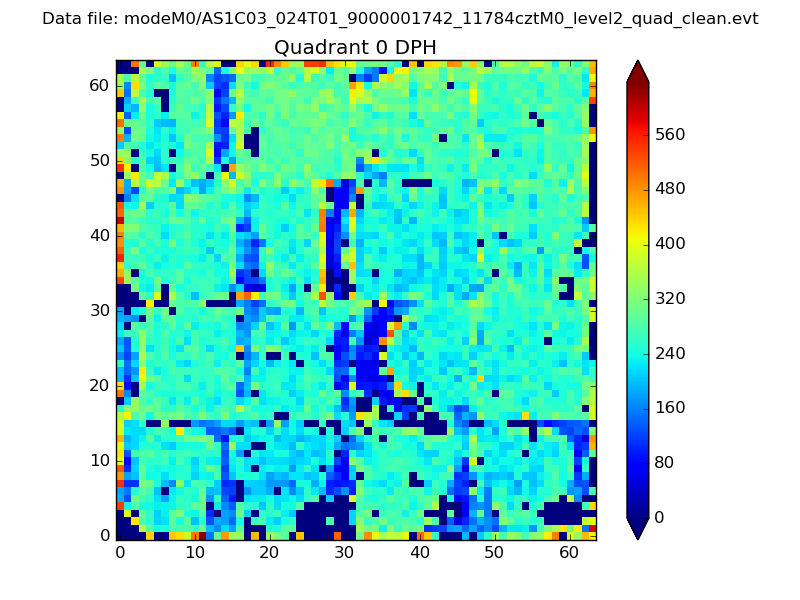 |
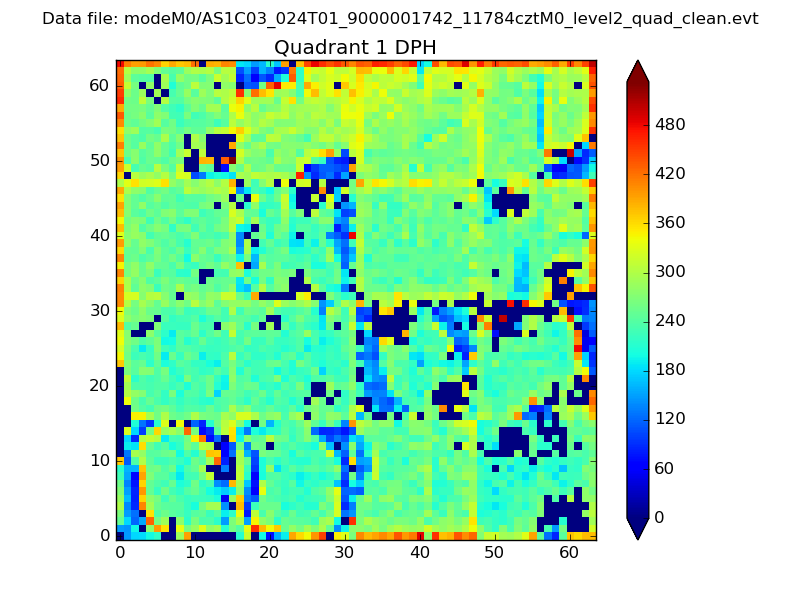 |
Quadrant B |
|---|---|---|---|
| Quadrant D | 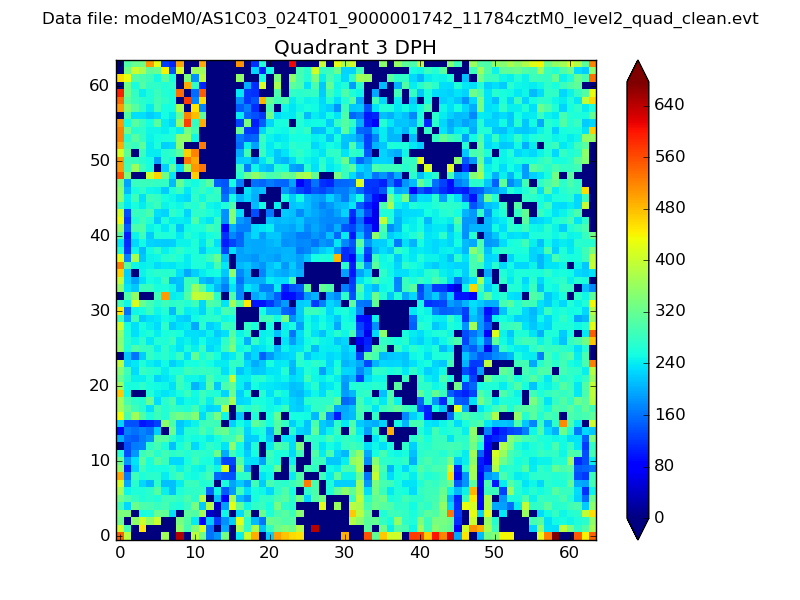 |
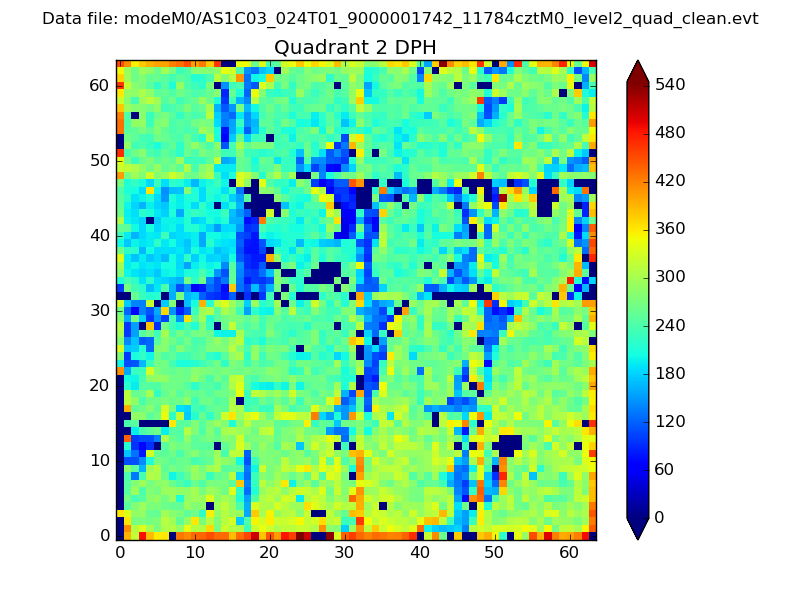 |
Quadrant C |
| Plot type | Count rate plots | Images |
|---|---|---|
| Comparison with Poisson distribution Blue bars denote a histogram of data divided into 1 sec bins. Red curve is a Poisson curve with rate = median count rate of data. |
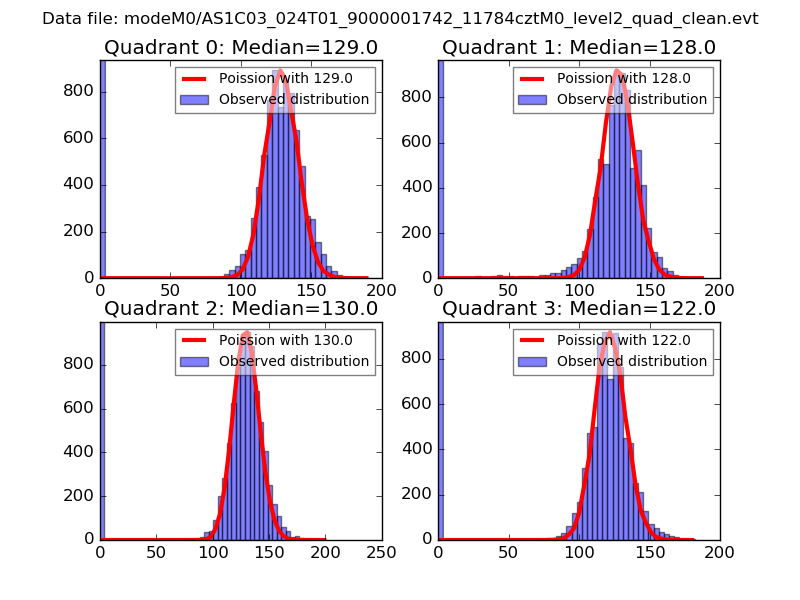 |
 |
| Quadrant-wise count rates Data is divided into 100 sec bins |
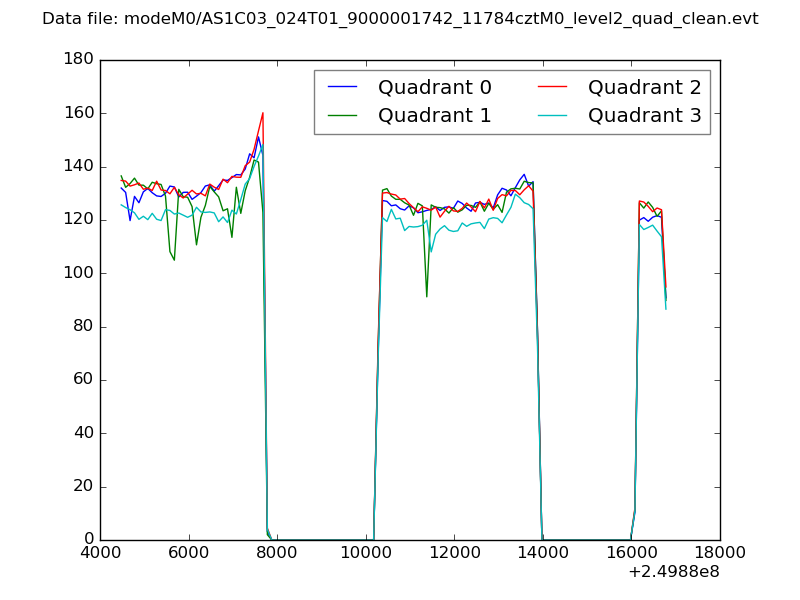 |
|
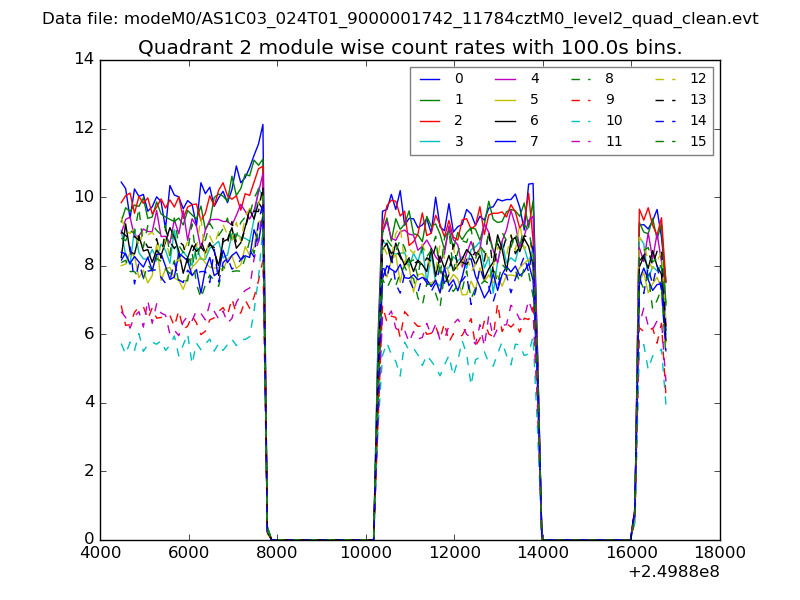
| Module-wise count rates for Quadrant A Data is divided into 100 sec bins |
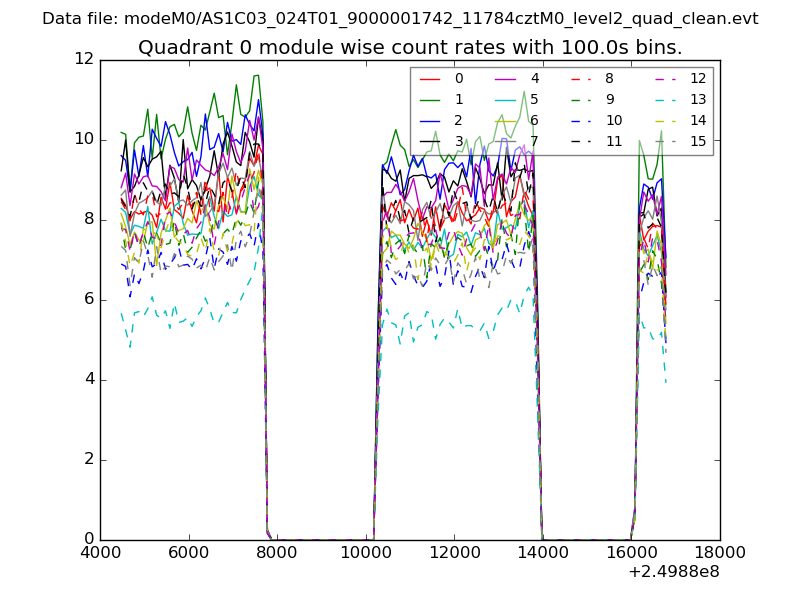 |
 |
| Module-wise count rates for Quadrant B Data is divided into 100 sec bins |
 |
 |
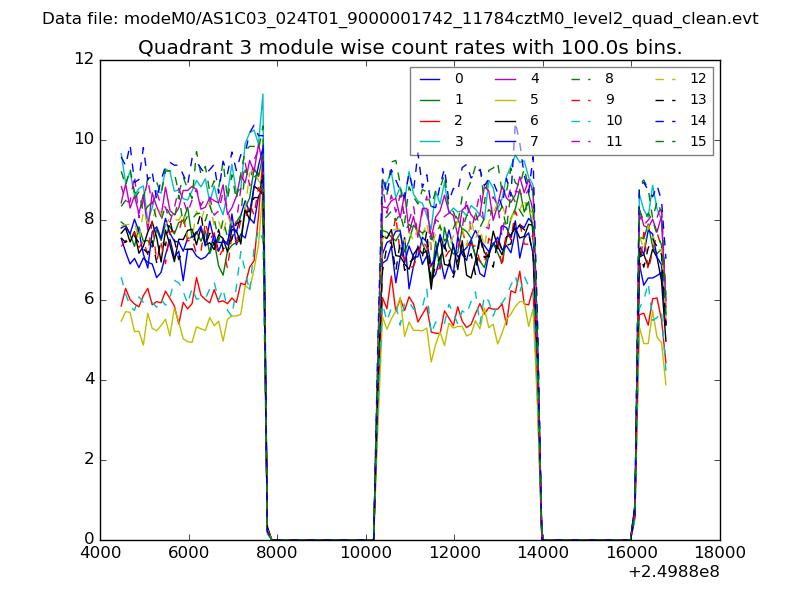
| Module-wise count rates for Quadrant C Data is divided into 100 sec bins |
 |
 |
| Module-wise count rates for Quadrant D Data is divided into 100 sec bins |
 |
 |
| Parameter | Plot |
|---|---|
| CZT HV Monitor | 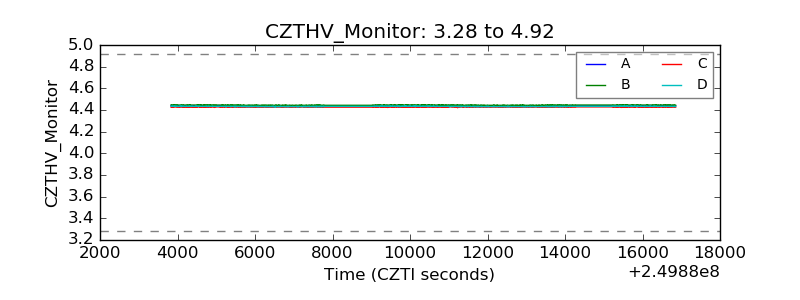 |
| D_VDD | 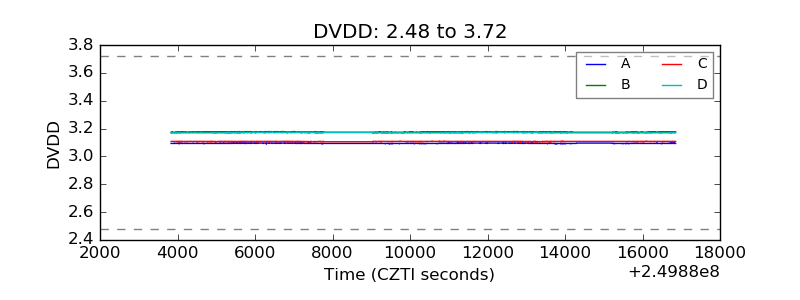 |
| Temperature 1 |  |
| Veto HV Monitor | 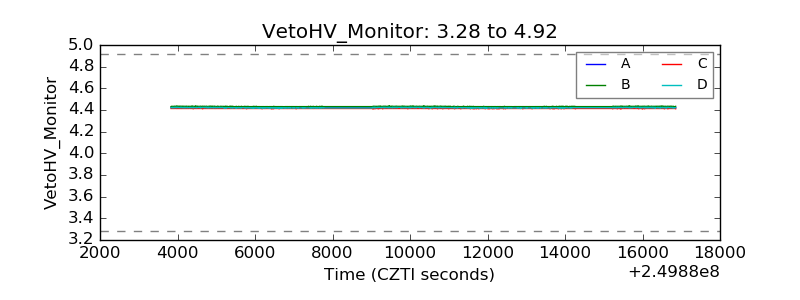 |
| Veto LLD | 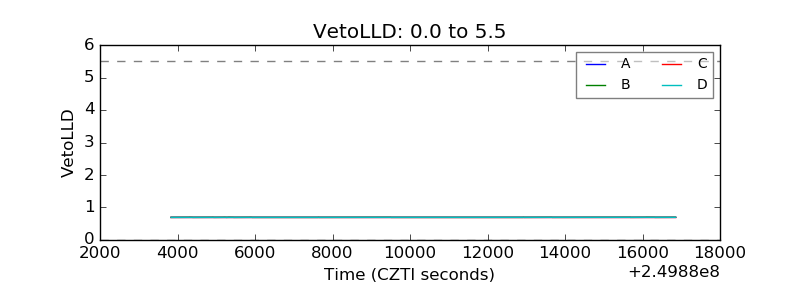 |
| Alpha Counter | 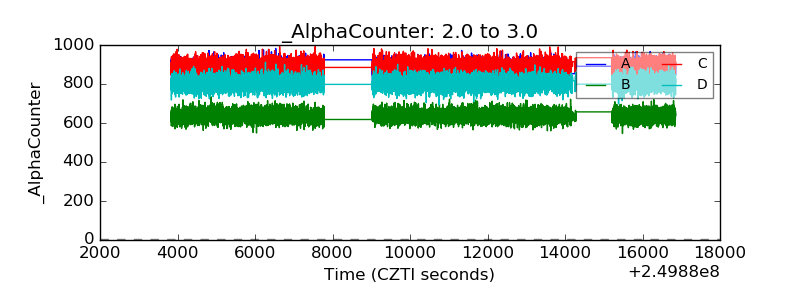 |
| _CPM_Rate | 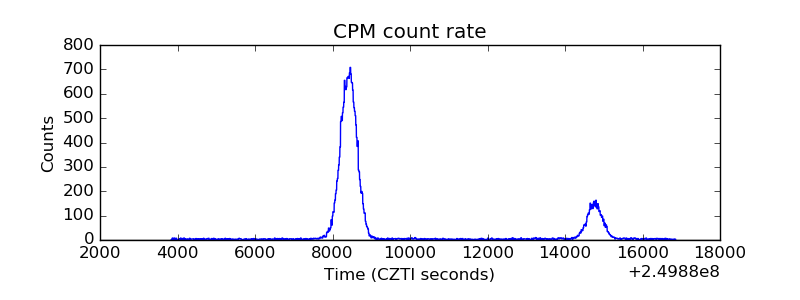 |
| CZT Counter | 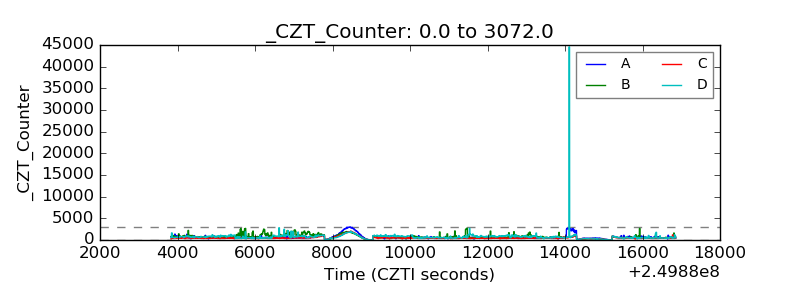 |
| +2.5 Volts monitor |  |
| +5 Volts monitor |  |
| _ROLL_ROT | 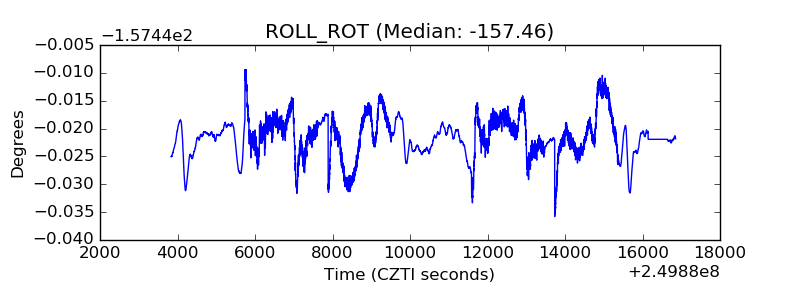 |
| _Roll_DEC |  |
| _Roll_RA | 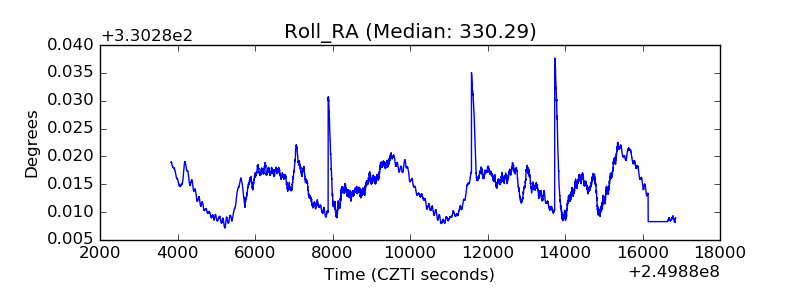 |
| Veto Counter |  |