| Param | Original file | Final file |
|---|---|---|
| Filename | modeM0/AS1C03_024T01_9000001742_11785cztM0_level2.evt | modeM0/AS1C03_024T01_9000001742_11785cztM0_level2_quad_clean.evt |
| Size (bytes) | 1,399,559,040 | 226,684,800 |
| Size | 1.3 GB | 216.2 MB |
| Events in quadrant A | 9,666,465 | 1,454,559 |
| Events in quadrant B | 12,756,484 | 1,427,254 |
| Events in quadrant C | 7,763,873 | 1,463,527 |
| Events in quadrant D | 11,080,170 | 1,376,437 |
| Mode M0 | |||
|---|---|---|---|
| Quadrant | BADHDUFLAG | Total packets | Discarded packets |
| A | 0 | 39304 | 4 |
| B | 0 | 48969 | 3 |
| C | 0 | 34339 | 3 |
| D | 0 | 44061 | 3 |
| Mode M9 | |||
|---|---|---|---|
| Quadrant | BADHDUFLAG | Total packets | Discarded packets |
| A | 0 | 26 | 0 |
| B | 0 | 26 | 0 |
| C | 0 | 26 | 0 |
| D | 0 | 26 | 0 |
| Mode SS | |||
|---|---|---|---|
| Quadrant | BADHDUFLAG | Total packets | Discarded packets |
| A | 0 | 336 | 0 |
| B | 0 | 336 | 0 |
| C | 0 | 336 | 0 |
| D | 0 | 336 | 0 |
| Quadrant | Total seconds | Saturated seconds | Saturation percentage |
|---|---|---|---|
| A | 16595 | 666 | 4.013257% |
| B | 16595 | 1193 | 7.188912% |
| C | 16595 | 243 | 1.464296% |
| D | 16595 | 381 | 2.295872% |
Noise dominated data is calculated using 1-second bins in cleaned event files. If a bin has >2000 counts, and if more than 50% of those come from <1% of pixels, then it is considered to be noise-dominated and hence unusable.
| Quadrant | # 1 sec bins | Bins with >0 counts | Bins with >2000 counts | High rate bins dominated by noise | Noise dominated (total time) | Noise dominated (detector-on time) | Marked lightcurve |
|---|---|---|---|---|---|---|---|
| A | 19161 | 16599 | 196 | 196 | 1.02% | 1.18% | 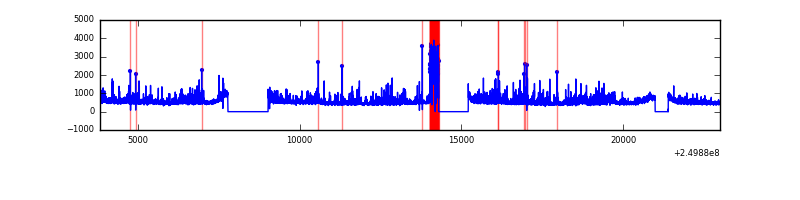 |
| B | 19161 | 16599 | 471 | 471 | 2.46% | 2.84% | 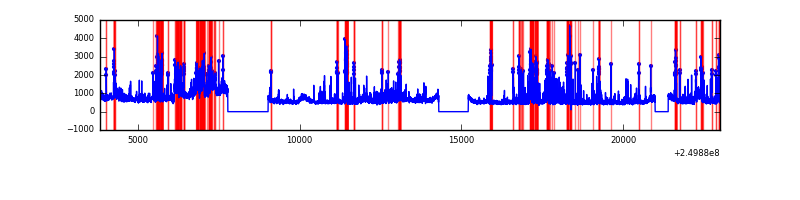 |
| C | 19161 | 16599 | 0 | 0 | 0.00% | 0.00% | 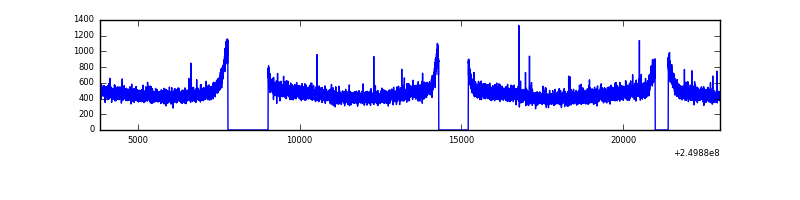 |
| D | 19161 | 16598 | 110 | 110 | 0.57% | 0.66% | 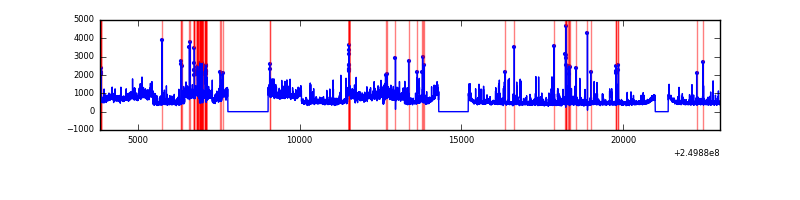 |
Top three noisy pixels from each quadrant. If the there are fewer than three noisy pixels in the level2.evt file, extra rows are filled as -1
| Pixel properties | Quadrant properties | ||||||
|---|---|---|---|---|---|---|---|
| Quadrant | DetID | PixID | Counts | Sigma | Mean | Median | Sigma |
| A | 15 | 174 | 551221 | 1355.01 | 2016 | 1978 | 405.3 |
| A | 8 | 15 | 394370 | 968.05 | 2016 | 1978 | 405.3 |
| A | 1 | 162 | 330398 | 810.23 | 2016 | 1978 | 405.3 |
| B | 4 | 239 | 1935981 | 5069.28 | 2018 | 1973 | 381.5 |
| B | 10 | 16 | 1668129 | 4367.21 | 2018 | 1973 | 381.5 |
| B | 3 | 64 | 444032 | 1158.69 | 2018 | 1973 | 381.5 |
| C | 13 | 61 | 14435 | 27.21 | 1988 | 2000 | 456.9 |
| C | 14 | 234 | 7425 | 11.87 | 1988 | 2000 | 456.9 |
| C | 1 | 3 | 6214 | 9.22 | 1988 | 2000 | 456.9 |
| D | 1 | 52 | 2599174 | 5516.56 | 1974 | 1923 | 470.8 |
| D | 8 | 195 | 589693 | 1248.42 | 1974 | 1923 | 470.8 |
| D | 13 | 104 | 84823 | 176.08 | 1974 | 1923 | 470.8 |
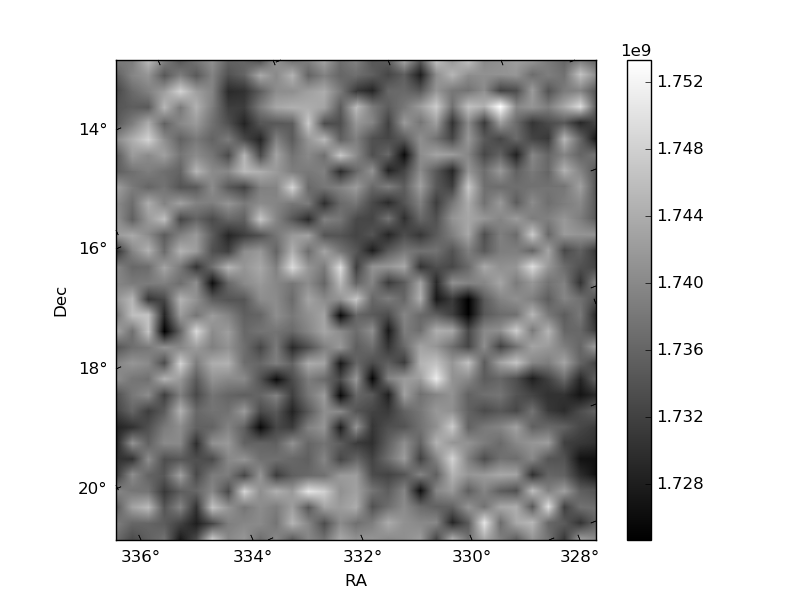
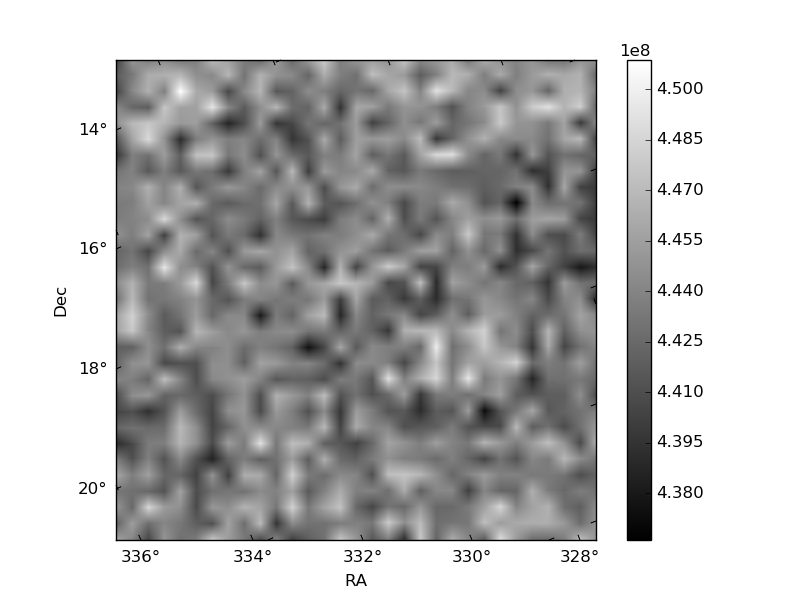
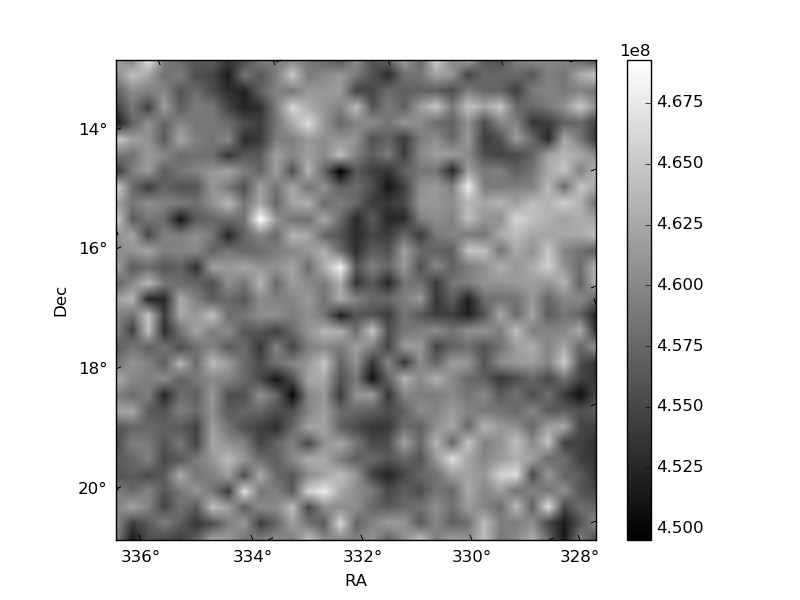
Histogram calculated using DETX and DETY for each event in the final _common_clean file
| Quadrant A | 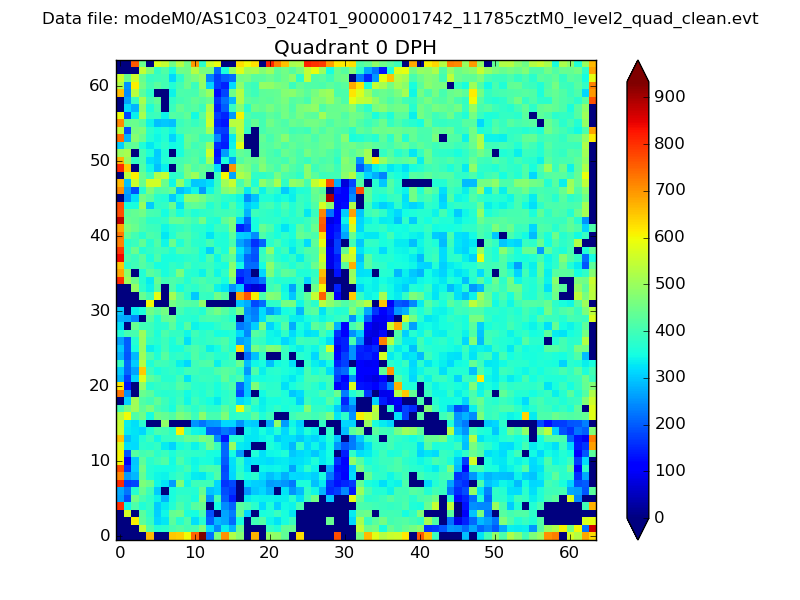 |
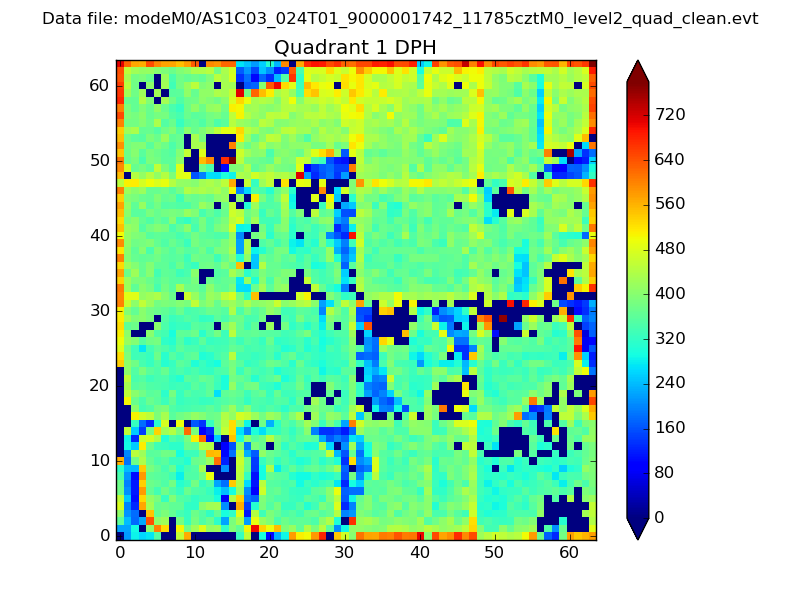 |
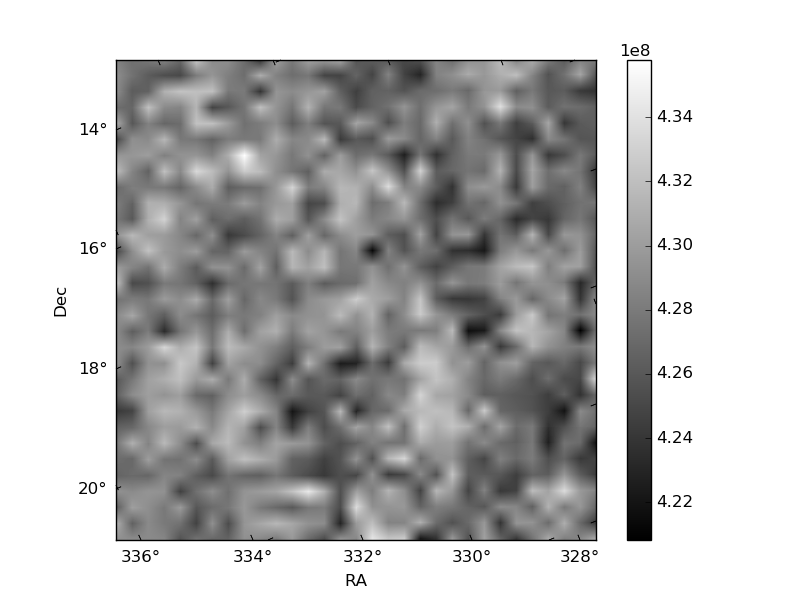
Quadrant B |
|---|---|---|---|
| Quadrant D | 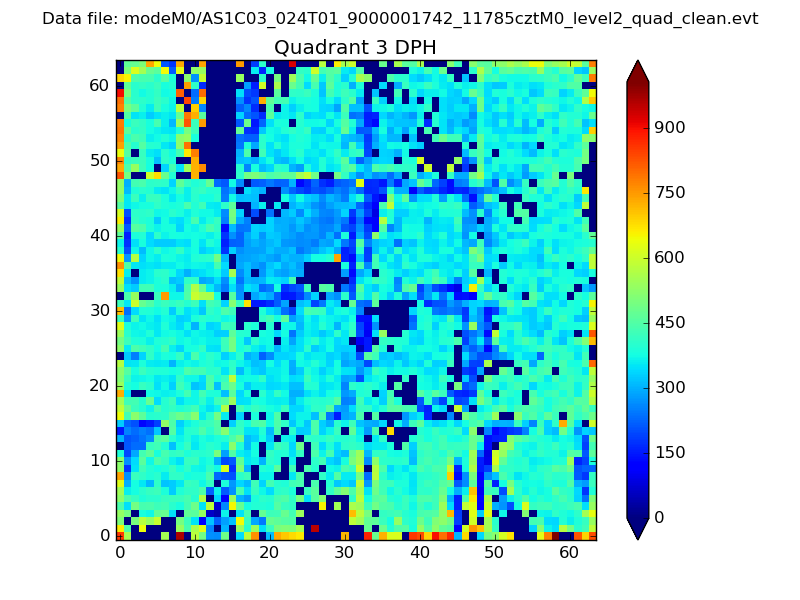 |
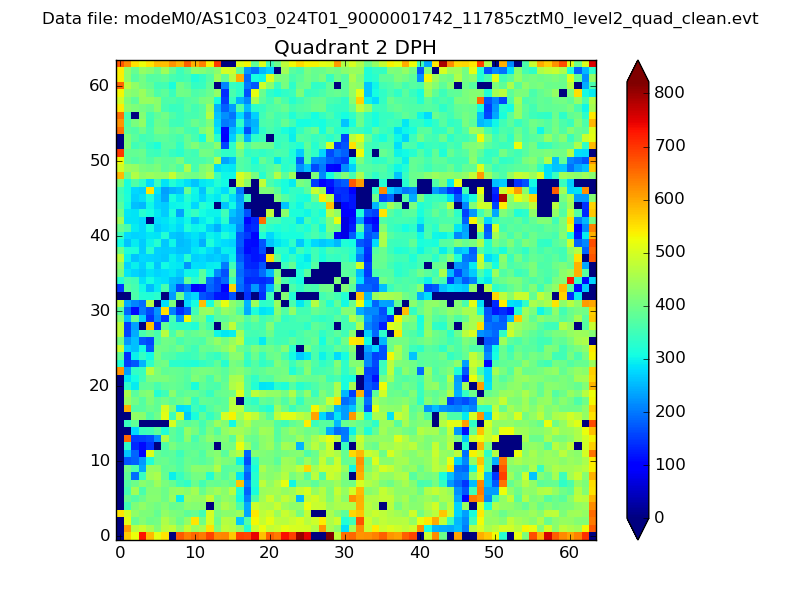 |
Quadrant C |
| Plot type | Count rate plots | Images |
|---|---|---|
| Comparison with Poisson distribution Blue bars denote a histogram of data divided into 1 sec bins. Red curve is a Poisson curve with rate = median count rate of data. |
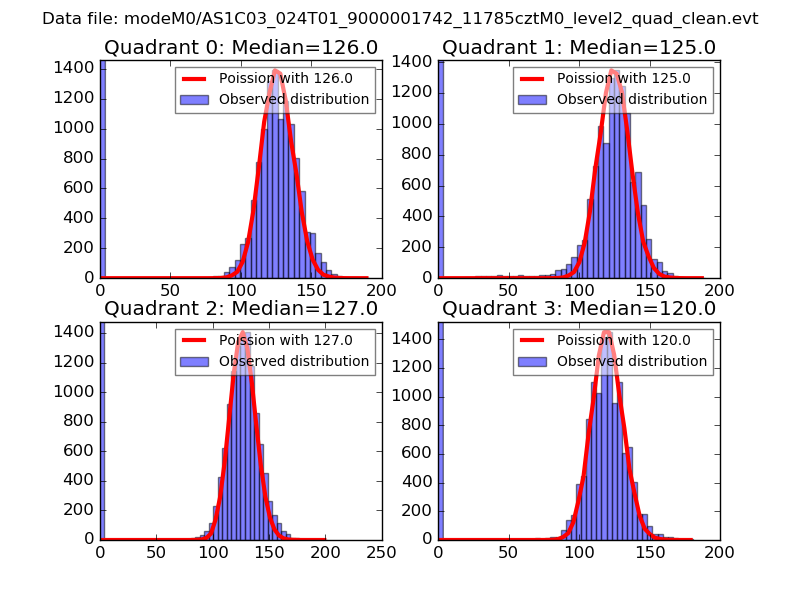 |
 |
| Quadrant-wise count rates Data is divided into 100 sec bins |
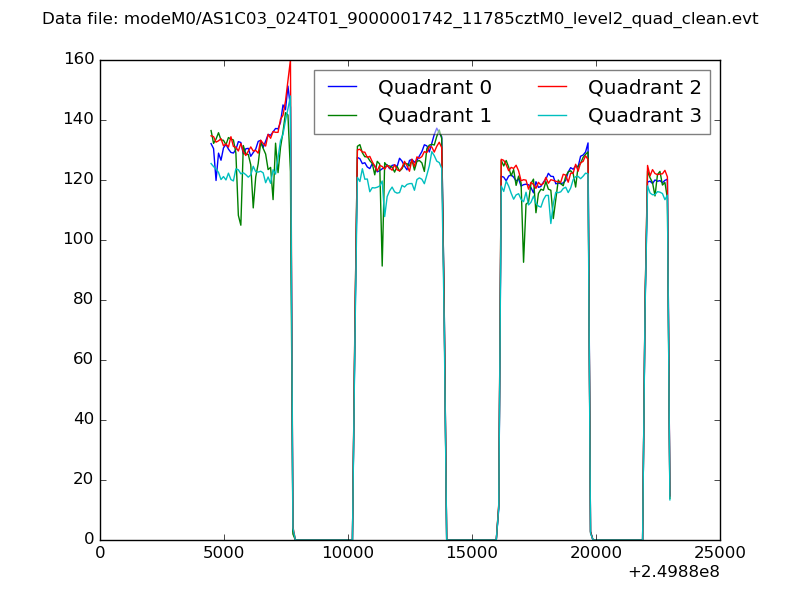 |
|
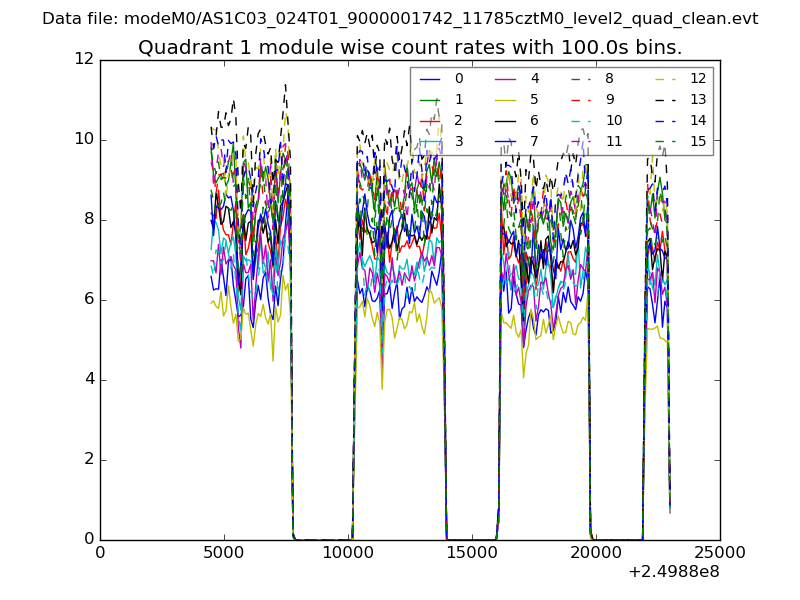
| Module-wise count rates for Quadrant A Data is divided into 100 sec bins |
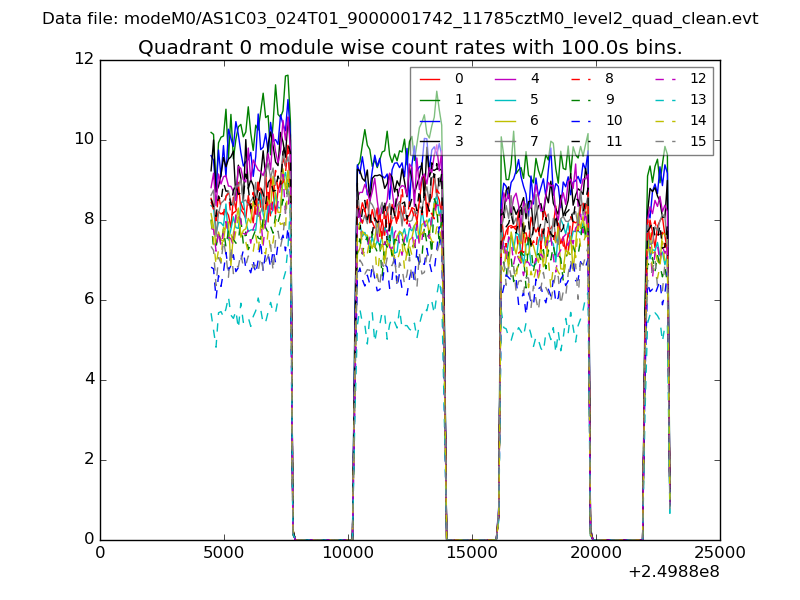 |
 |
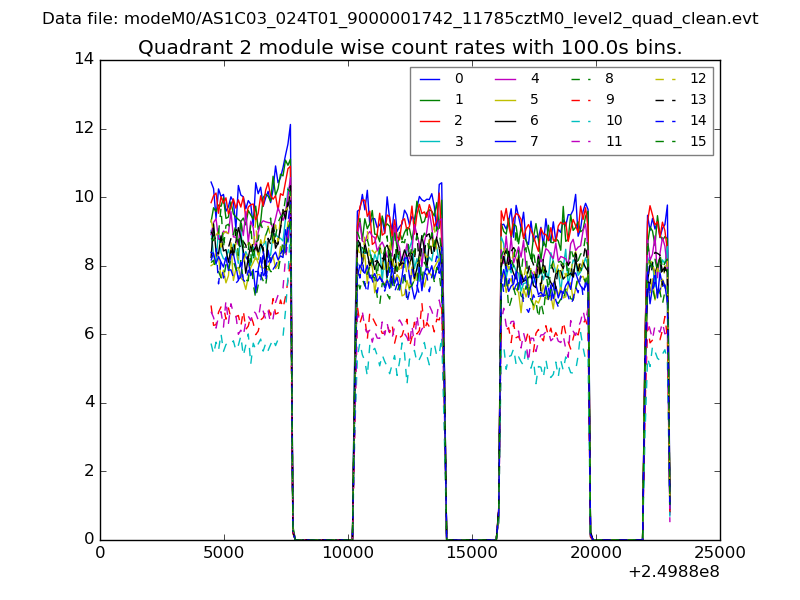
| Module-wise count rates for Quadrant B Data is divided into 100 sec bins |
 |
 |
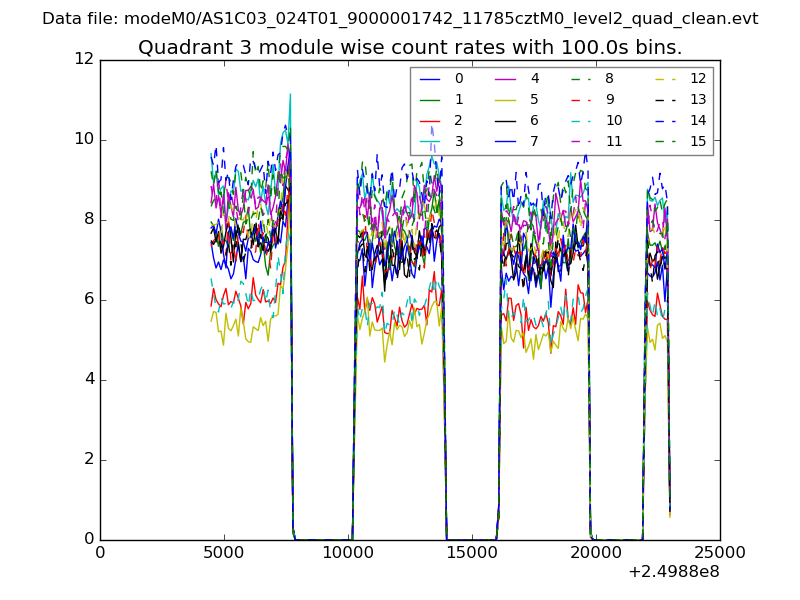
| Module-wise count rates for Quadrant C Data is divided into 100 sec bins |
 |
 |
| Module-wise count rates for Quadrant D Data is divided into 100 sec bins |
 |
 |
| Parameter | Plot |
|---|---|
| CZT HV Monitor | 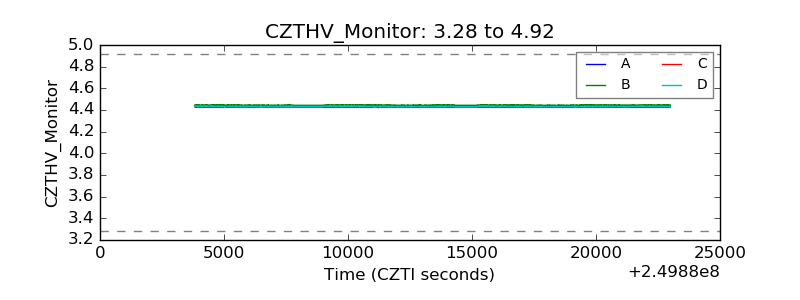 |
| D_VDD | 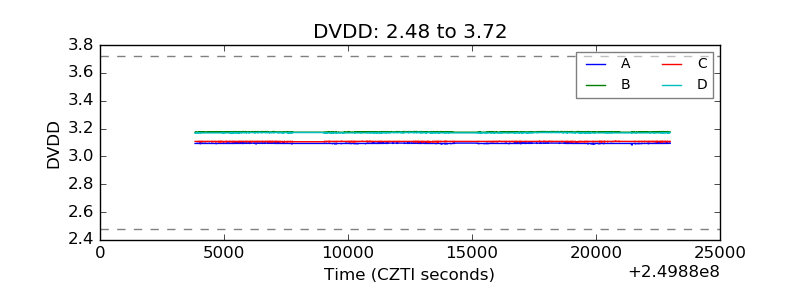 |
| Temperature 1 | 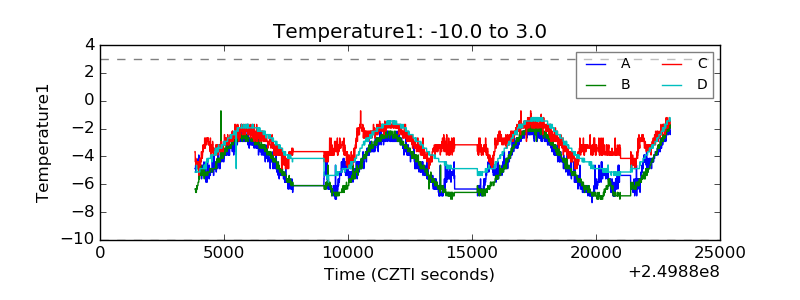 |
| Veto HV Monitor |  |
| Veto LLD | 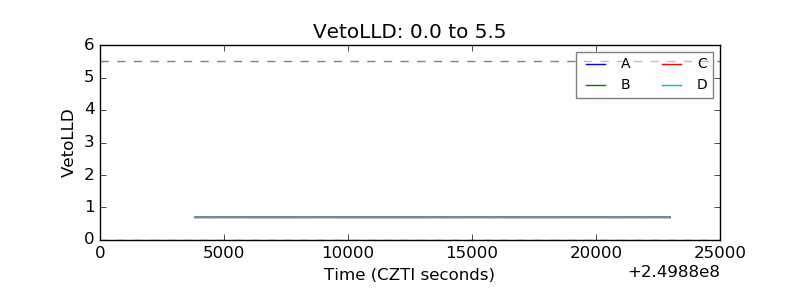 |
| Alpha Counter | 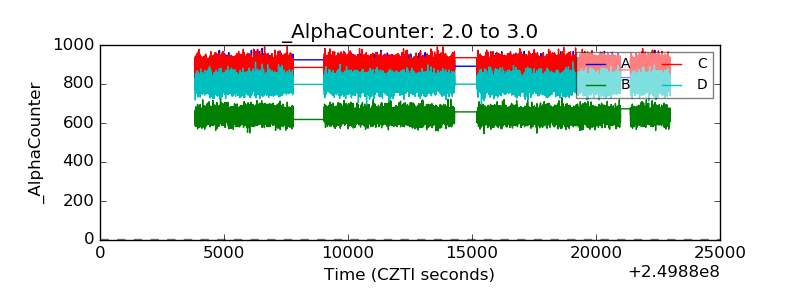 |
| _CPM_Rate | 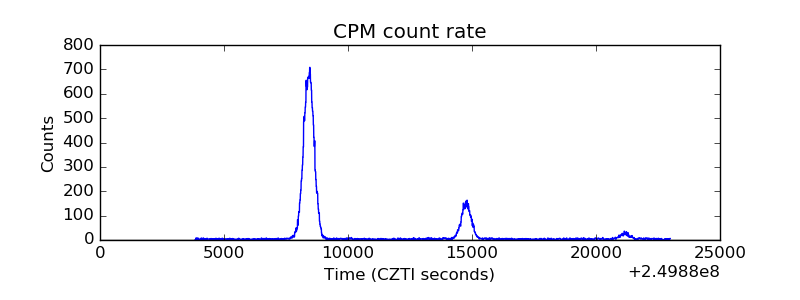 |
| CZT Counter | 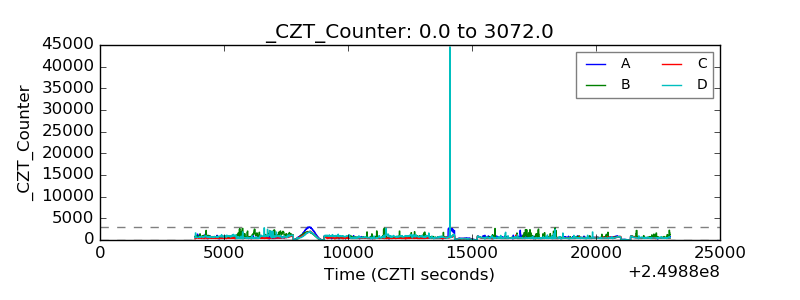 |
| +2.5 Volts monitor |  |
| +5 Volts monitor |  |
| _ROLL_ROT | 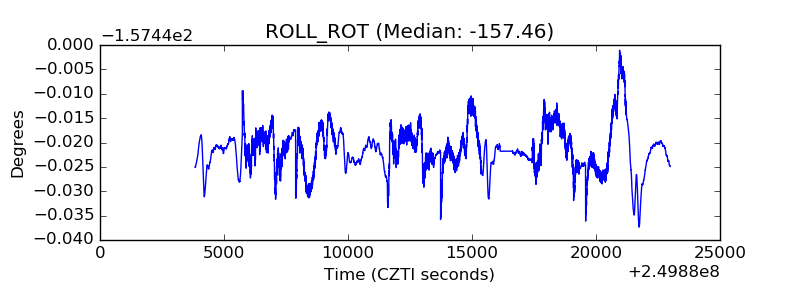 |
| _Roll_DEC |  |
| _Roll_RA | 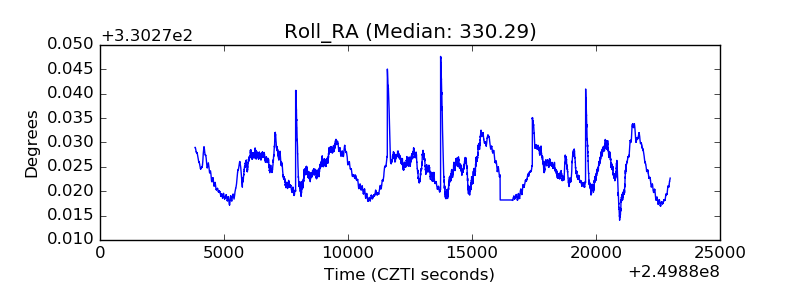 |
| Veto Counter | 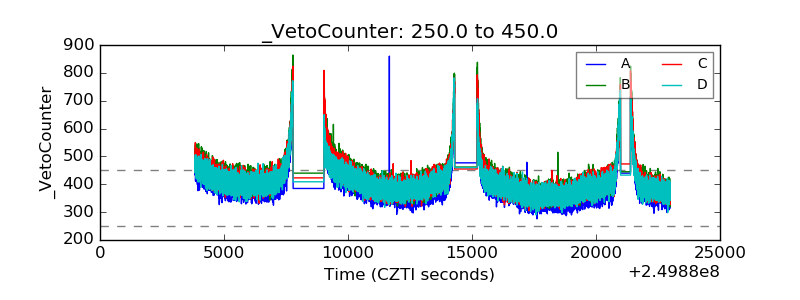 |