| Param | Original file | Final file |
|---|---|---|
| Filename | modeM0/AS1C03_024T01_9000001742_11786cztM0_level2.evt | modeM0/AS1C03_024T01_9000001742_11786cztM0_level2_quad_clean.evt |
| Size (bytes) | 569,574,720 | 94,285,440 |
| Size | 543.2 MB | 89.9 MB |
| Events in quadrant A | 3,786,224 | 596,302 |
| Events in quadrant B | 5,693,008 | 573,769 |
| Events in quadrant C | 3,357,925 | 601,789 |
| Events in quadrant D | 3,916,479 | 574,235 |
| Mode M0 | |||
|---|---|---|---|
| Quadrant | BADHDUFLAG | Total packets | Discarded packets |
| A | 0 | 15875 | 2 |
| B | 0 | 21697 | 1 |
| C | 0 | 15122 | 1 |
| D | 0 | 16442 | 1 |
| Mode SS | |||
|---|---|---|---|
| Quadrant | BADHDUFLAG | Total packets | Discarded packets |
| A | 0 | 146 | 0 |
| B | 0 | 146 | 0 |
| C | 0 | 146 | 0 |
| D | 0 | 146 | 0 |
| Quadrant | Total seconds | Saturated seconds | Saturation percentage |
|---|---|---|---|
| A | 7313 | 188 | 2.570764% |
| B | 7313 | 558 | 7.630248% |
| C | 7313 | 42 | 0.574320% |
| D | 7313 | 84 | 1.148639% |
Noise dominated data is calculated using 1-second bins in cleaned event files. If a bin has >2000 counts, and if more than 50% of those come from <1% of pixels, then it is considered to be noise-dominated and hence unusable.
| Quadrant | # 1 sec bins | Bins with >0 counts | Bins with >2000 counts | High rate bins dominated by noise | Noise dominated (total time) | Noise dominated (detector-on time) | Marked lightcurve |
|---|---|---|---|---|---|---|---|
| A | 7364 | 7315 | 4 | 4 | 0.05% | 0.05% |  |
| B | 7364 | 7315 | 239 | 239 | 3.25% | 3.27% | 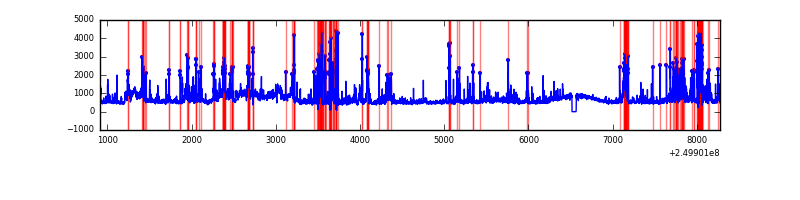 |
| C | 7364 | 7315 | 0 | 0 | 0.00% | 0.00% | 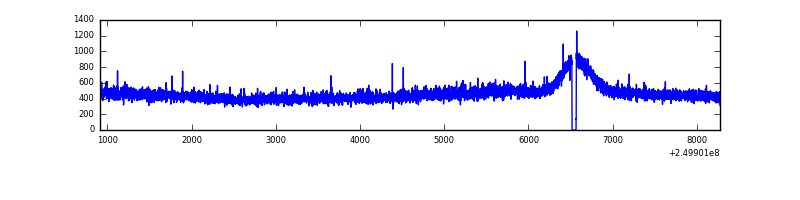 |
| D | 7364 | 7315 | 27 | 27 | 0.37% | 0.37% | 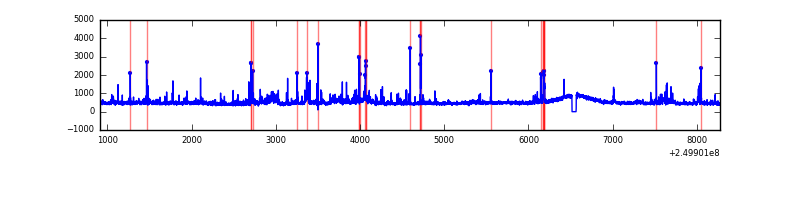 |
Top three noisy pixels from each quadrant. If the there are fewer than three noisy pixels in the level2.evt file, extra rows are filled as -1
| Pixel properties | Quadrant properties | ||||||
|---|---|---|---|---|---|---|---|
| Quadrant | DetID | PixID | Counts | Sigma | Mean | Median | Sigma |
| A | 8 | 15 | 117283 | 638.19 | 886 | 869 | 182.4 |
| A | 1 | 162 | 95277 | 517.55 | 886 | 869 | 182.4 |
| A | 1 | 178 | 46204 | 248.53 | 886 | 869 | 182.4 |
| B | 4 | 239 | 849635 | 5076.66 | 864 | 843 | 167.2 |
| B | 10 | 16 | 504609 | 3013.05 | 864 | 843 | 167.2 |
| B | 3 | 64 | 499778 | 2984.15 | 864 | 843 | 167.2 |
| C | 13 | 61 | 6358 | 27.52 | 859 | 863 | 199.6 |
| C | 8 | 128 | 3919 | 15.31 | 859 | 863 | 199.6 |
| C | 8 | 112 | 2527 | 8.33 | 859 | 863 | 199.6 |
| D | 1 | 52 | 248243 | 1183.61 | 860 | 835 | 209.0 |
| D | 10 | 199 | 105570 | 501.06 | 860 | 835 | 209.0 |
| D | 5 | 222 | 93653 | 444.05 | 860 | 835 | 209.0 |
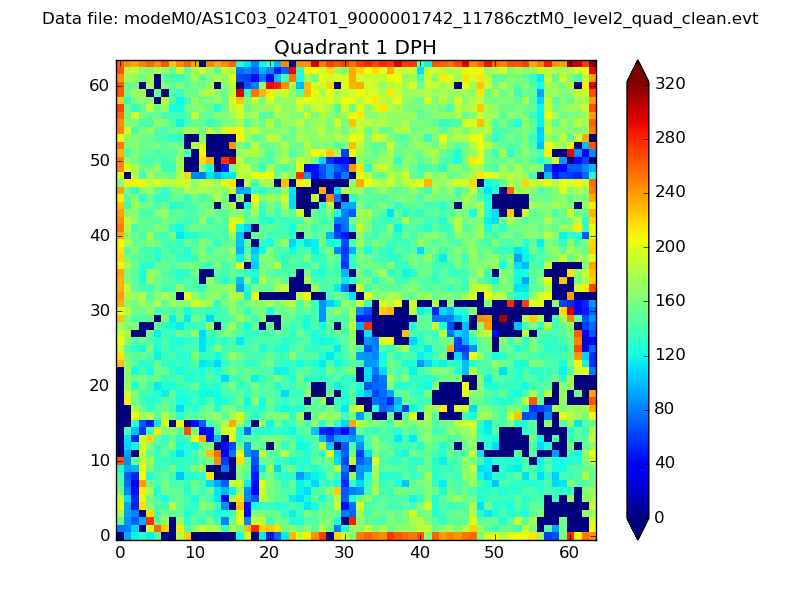
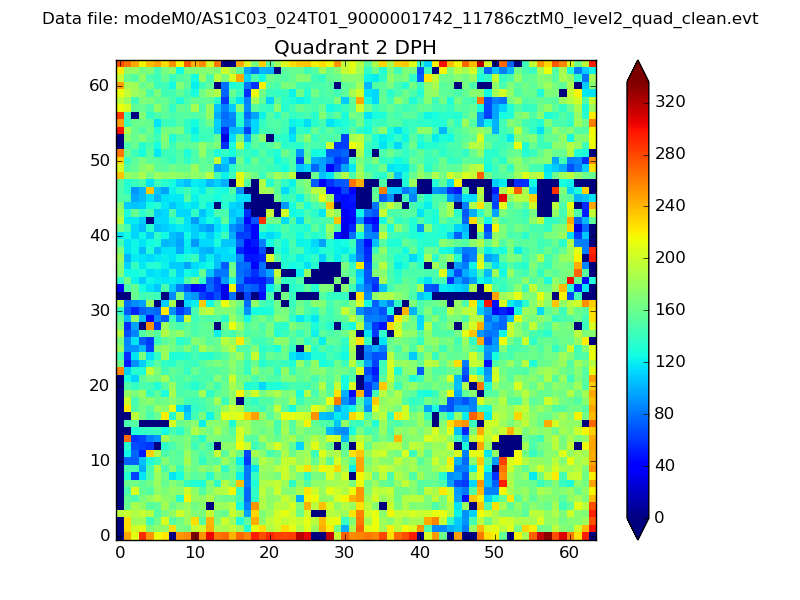
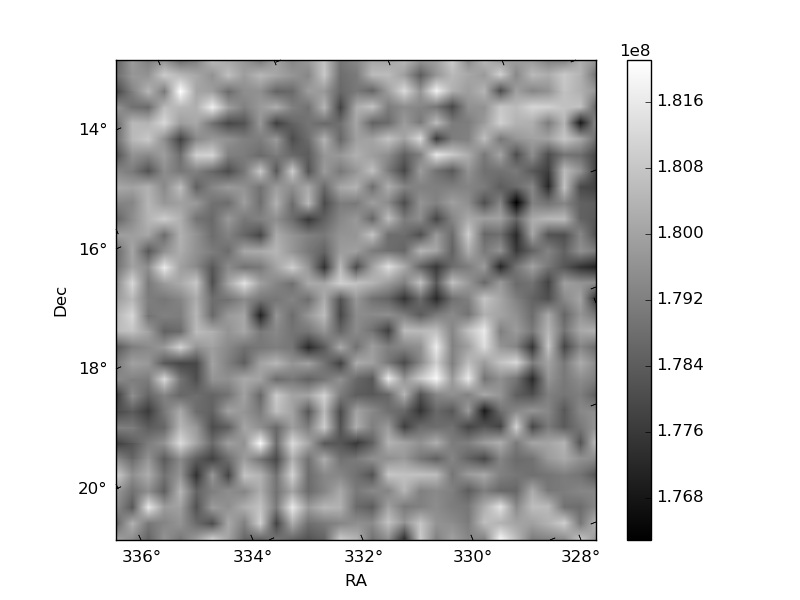
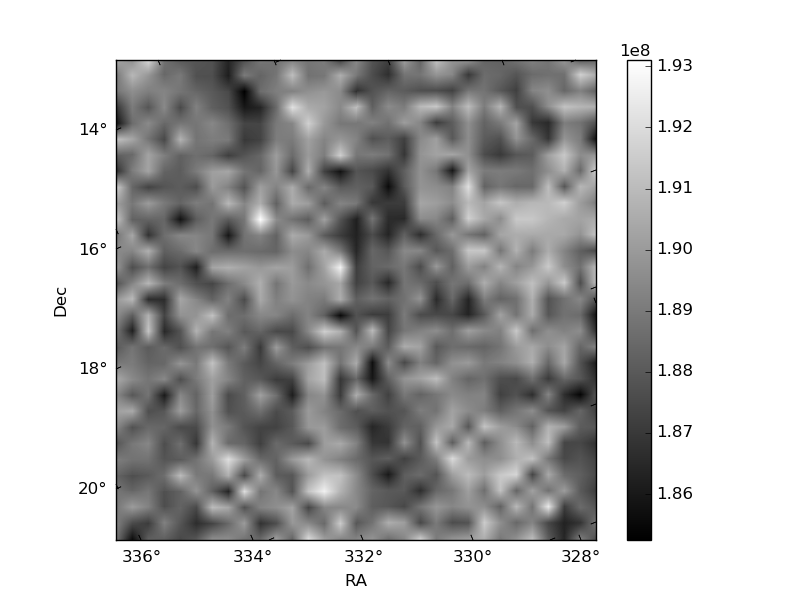
Histogram calculated using DETX and DETY for each event in the final _common_clean file
| Quadrant A | 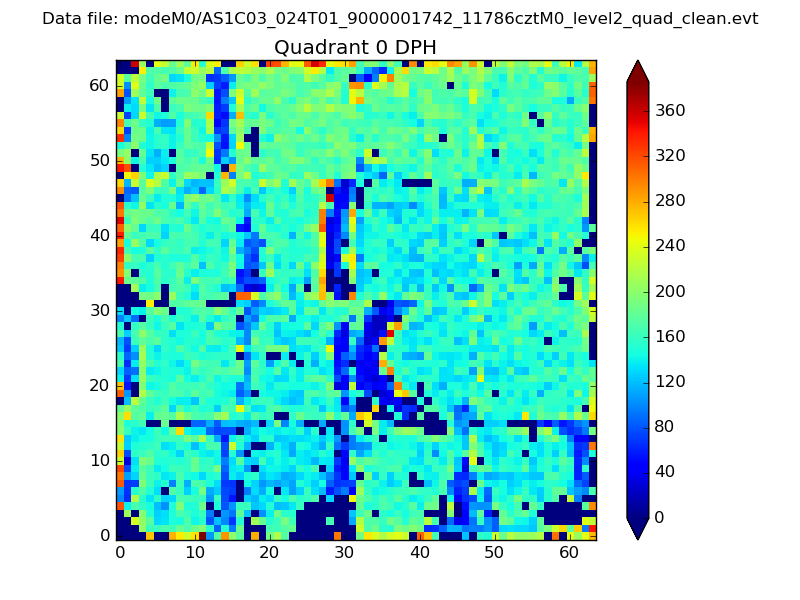 |
 |
Quadrant B |
|---|---|---|---|
| Quadrant D |  |
 |
Quadrant C |
| Plot type | Count rate plots | Images |
|---|---|---|
| Comparison with Poisson distribution Blue bars denote a histogram of data divided into 1 sec bins. Red curve is a Poisson curve with rate = median count rate of data. |
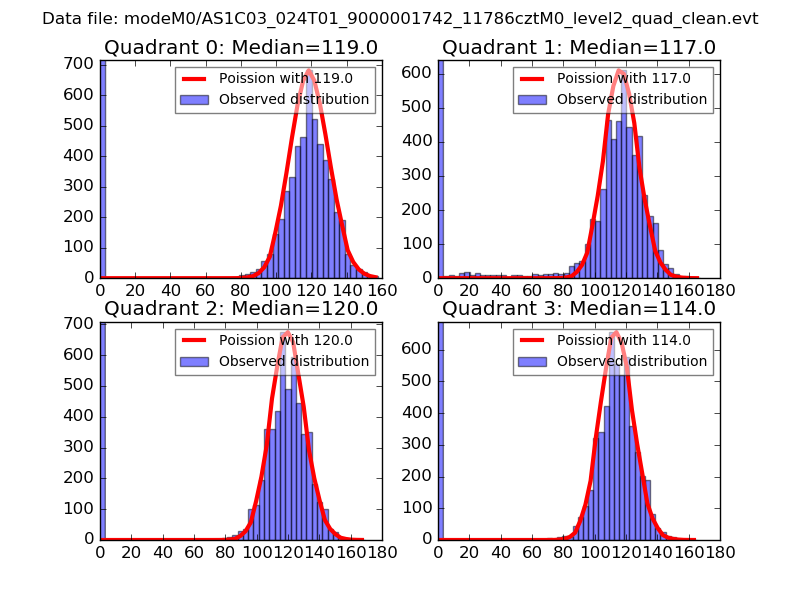 |
 |
| Quadrant-wise count rates Data is divided into 100 sec bins |
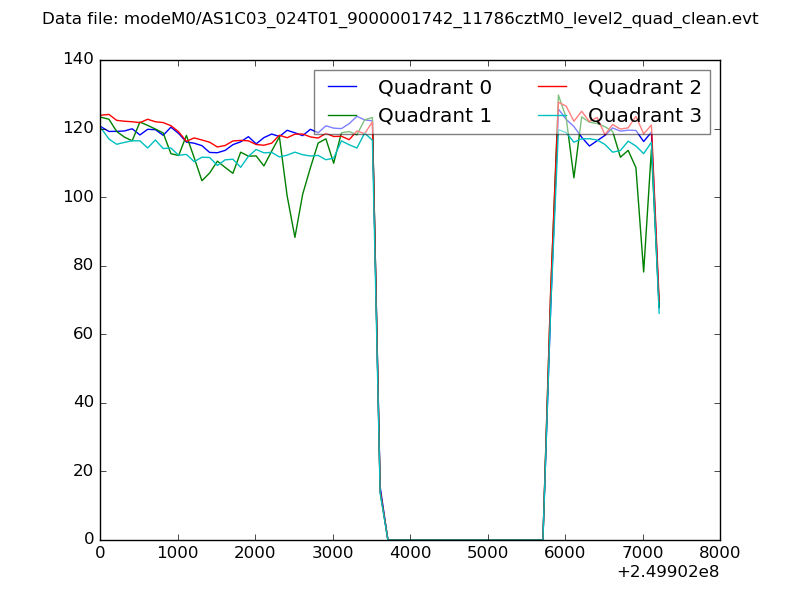 |
|
| Module-wise count rates for Quadrant A Data is divided into 100 sec bins |
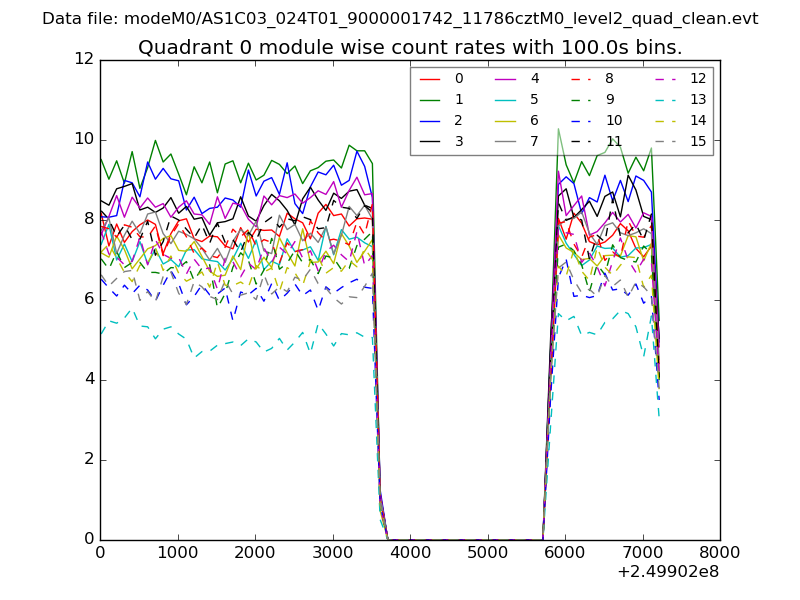 |
 |
| Module-wise count rates for Quadrant B Data is divided into 100 sec bins |
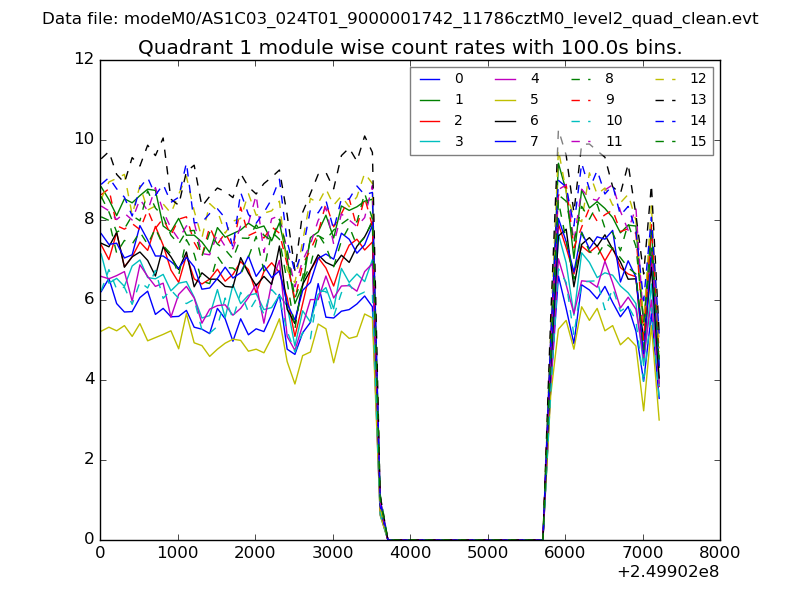 |
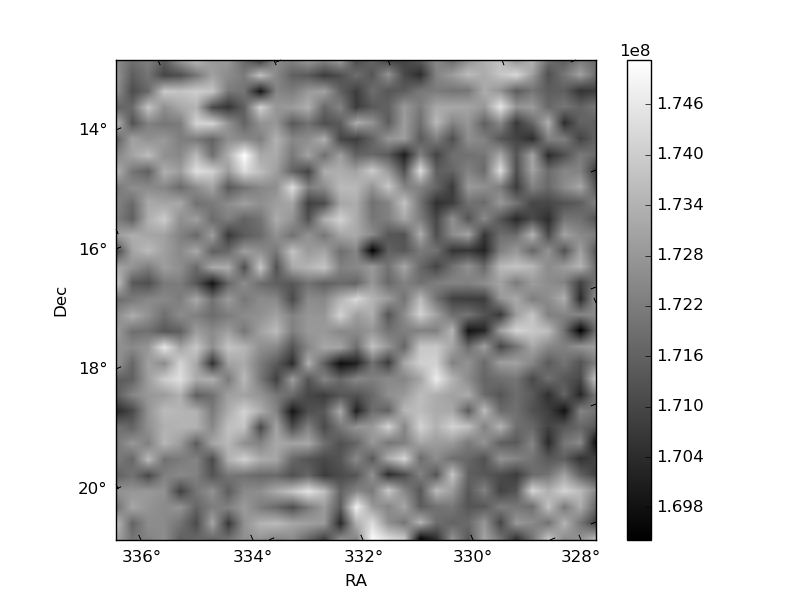 |
| Module-wise count rates for Quadrant C Data is divided into 100 sec bins |
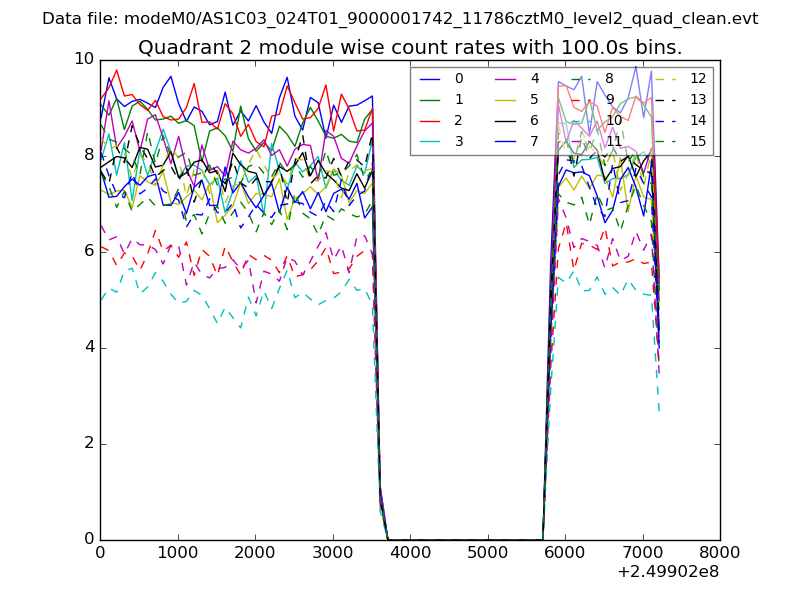 |
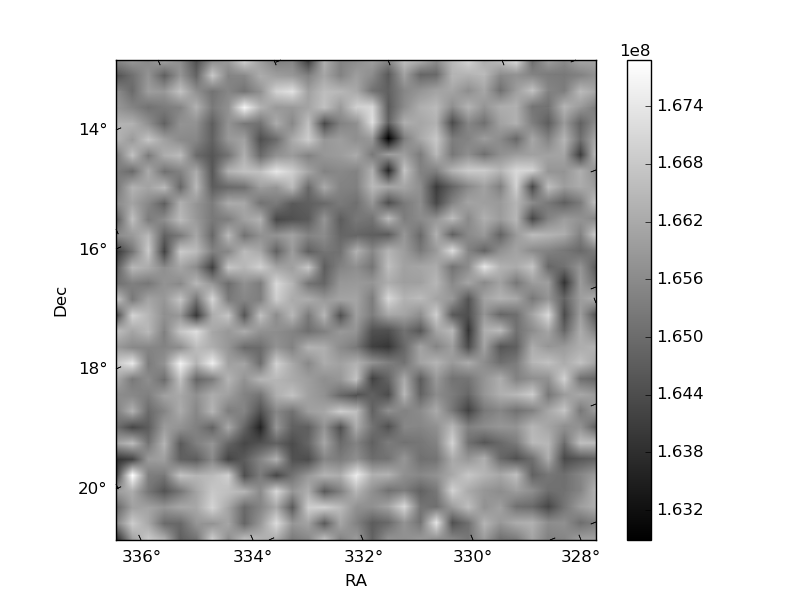 |
| Module-wise count rates for Quadrant D Data is divided into 100 sec bins |
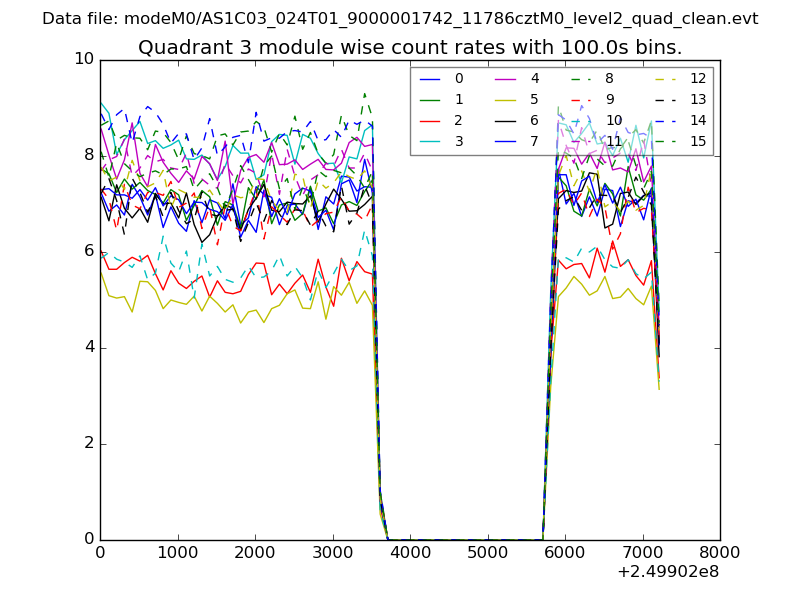 |
 |
| Parameter | Plot |
|---|---|
| CZT HV Monitor | 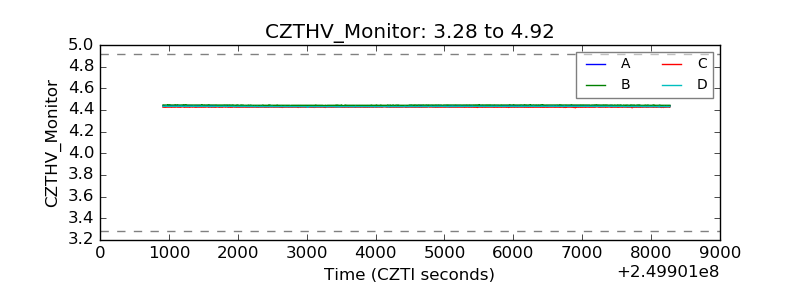 |
| D_VDD | 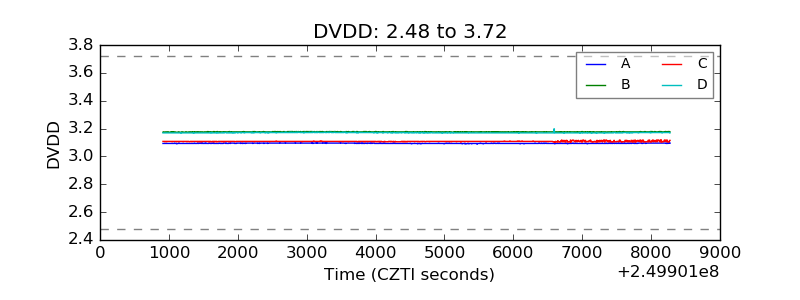 |
| Temperature 1 | 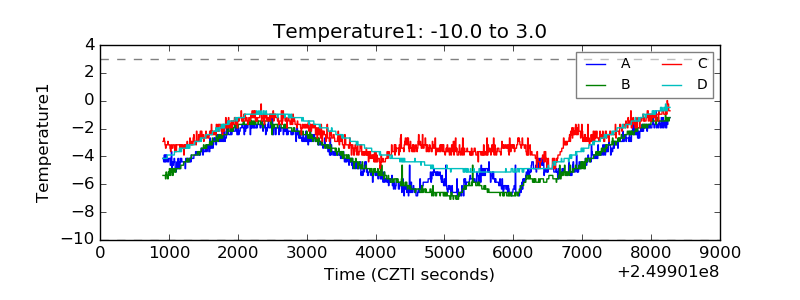 |
| Veto HV Monitor | 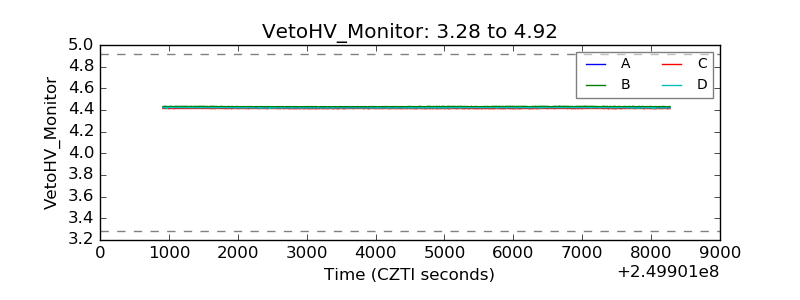 |
| Veto LLD | 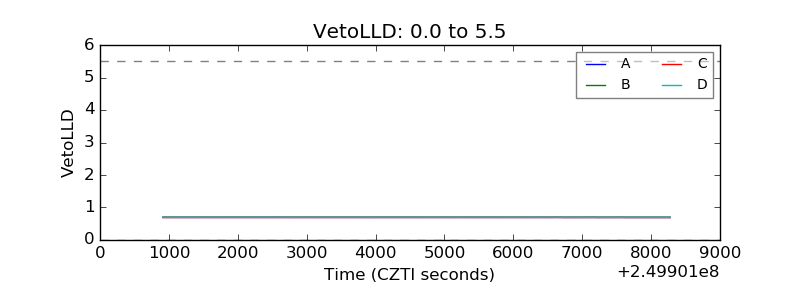 |
| Alpha Counter | 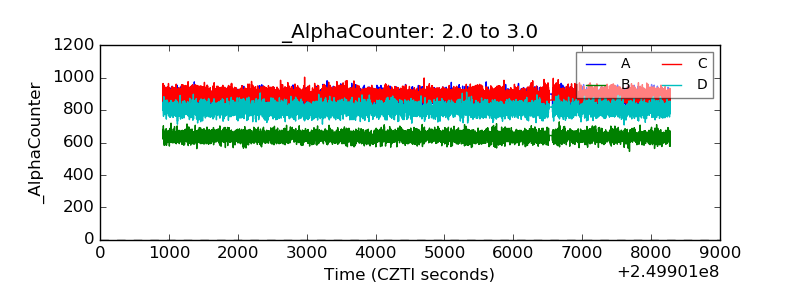 |
| _CPM_Rate | 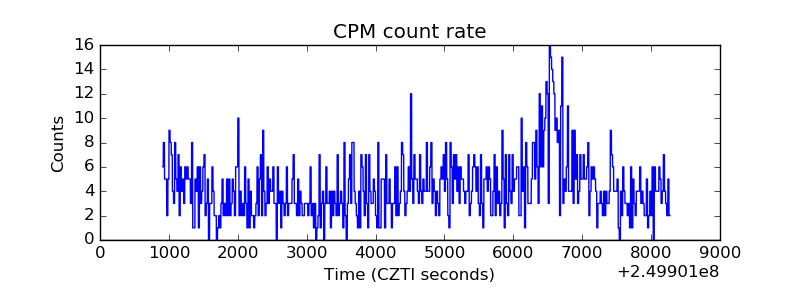 |
| CZT Counter | 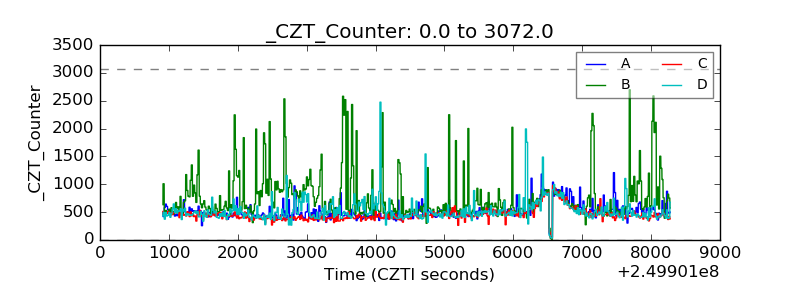 |
| +2.5 Volts monitor |  |
| +5 Volts monitor |  |
| _ROLL_ROT | 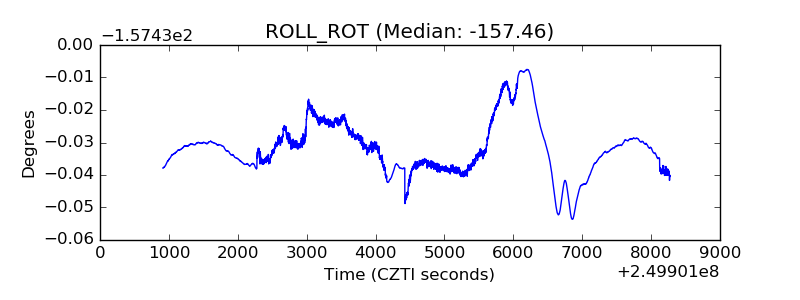 |
| _Roll_DEC | 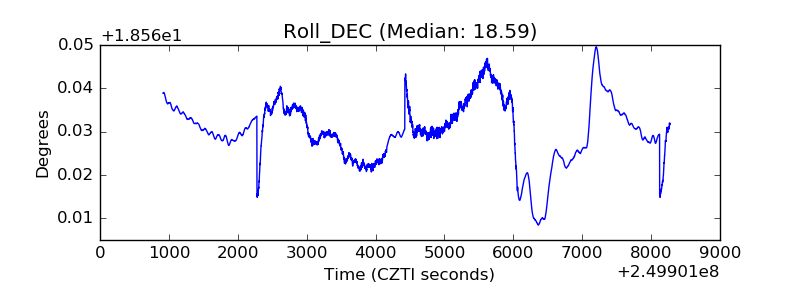 |
| _Roll_RA | 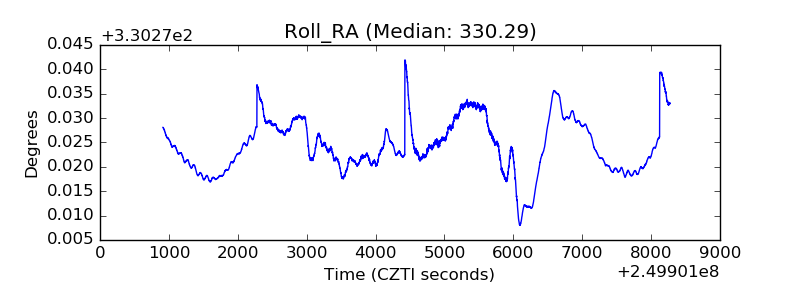 |
| Veto Counter | 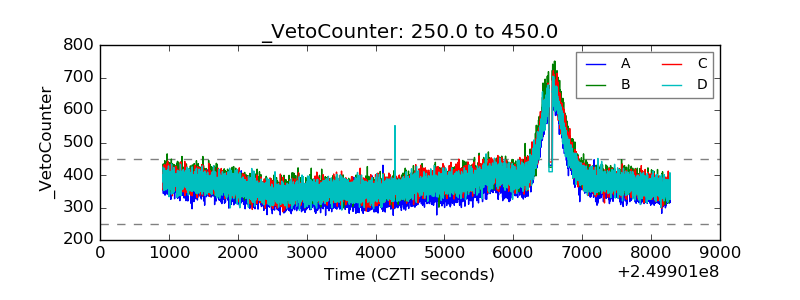 |