| Param | Original file | Final file |
|---|---|---|
| Filename | modeM0/AS1C03_024T01_9000001742_11790cztM0_level2.evt | modeM0/AS1C03_024T01_9000001742_11790cztM0_level2_quad_clean.evt |
| Size (bytes) | 593,231,040 | 98,311,680 |
| Size | 565.7 MB | 93.8 MB |
| Events in quadrant A | 4,213,606 | 620,307 |
| Events in quadrant B | 5,759,915 | 604,988 |
| Events in quadrant C | 3,450,905 | 631,122 |
| Events in quadrant D | 4,037,630 | 603,178 |
| Mode M0 | |||
|---|---|---|---|
| Quadrant | BADHDUFLAG | Total packets | Discarded packets |
| A | 0 | 17290 | 0 |
| B | 0 | 22054 | 0 |
| C | 0 | 15593 | 0 |
| D | 0 | 16975 | 0 |
| Mode SS | |||
|---|---|---|---|
| Quadrant | BADHDUFLAG | Total packets | Discarded packets |
| A | 0 | 148 | 0 |
| B | 0 | 148 | 0 |
| C | 0 | 148 | 0 |
| D | 0 | 148 | 0 |
| Quadrant | Total seconds | Saturated seconds | Saturation percentage |
|---|---|---|---|
| A | 7435 | 317 | 4.263618% |
| B | 7435 | 615 | 8.271688% |
| C | 7435 | 130 | 1.748487% |
| D | 7435 | 183 | 2.461332% |
Noise dominated data is calculated using 1-second bins in cleaned event files. If a bin has >2000 counts, and if more than 50% of those come from <1% of pixels, then it is considered to be noise-dominated and hence unusable.
| Quadrant | # 1 sec bins | Bins with >0 counts | Bins with >2000 counts | High rate bins dominated by noise | Noise dominated (total time) | Noise dominated (detector-on time) | Marked lightcurve |
|---|---|---|---|---|---|---|---|
| A | 7436 | 7436 | 5 | 5 | 0.07% | 0.07% | 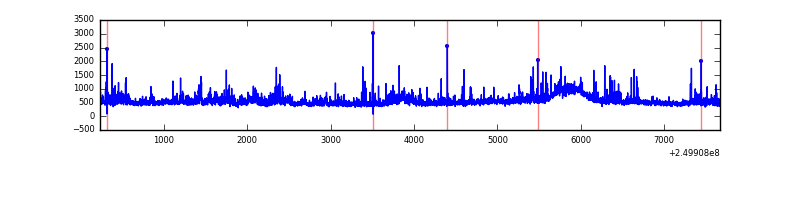 |
| B | 7436 | 7436 | 220 | 220 | 2.96% | 2.96% | 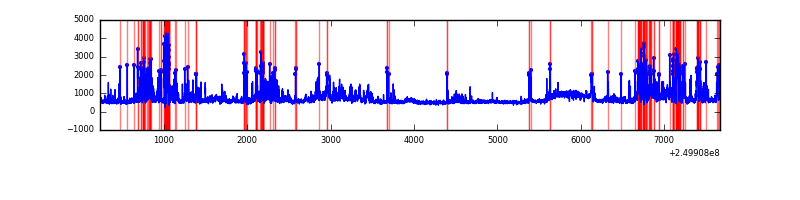 |
| C | 7436 | 7436 | 0 | 0 | 0.00% | 0.00% | 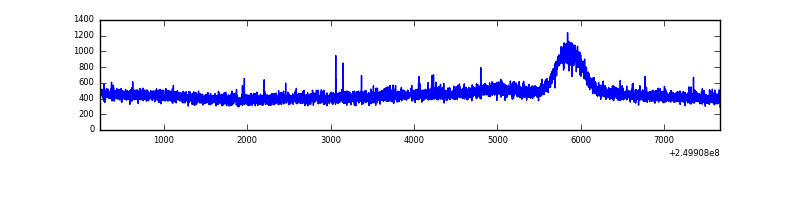 |
| D | 7436 | 7436 | 42 | 42 | 0.56% | 0.56% | 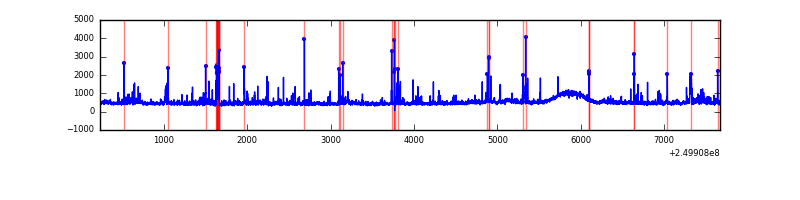 |
Top three noisy pixels from each quadrant. If the there are fewer than three noisy pixels in the level2.evt file, extra rows are filled as -1
| Pixel properties | Quadrant properties | ||||||
|---|---|---|---|---|---|---|---|
| Quadrant | DetID | PixID | Counts | Sigma | Mean | Median | Sigma |
| A | 8 | 15 | 305347 | 1618.6 | 904 | 883 | 188.1 |
| A | 1 | 162 | 129970 | 686.26 | 904 | 883 | 188.1 |
| A | 9 | 143 | 68781 | 360.96 | 904 | 883 | 188.1 |
| B | 10 | 16 | 709481 | 4094.17 | 886 | 864 | 173.1 |
| B | 4 | 239 | 648497 | 3741.83 | 886 | 864 | 173.1 |
| B | 15 | 204 | 387911 | 2236.24 | 886 | 864 | 173.1 |
| C | 8 | 128 | 8024 | 34.34 | 881 | 886 | 207.8 |
| C | 13 | 61 | 6432 | 26.68 | 881 | 886 | 207.8 |
| C | 8 | 112 | 5271 | 21.09 | 881 | 886 | 207.8 |
| D | 8 | 195 | 172413 | 802.62 | 881 | 855 | 213.7 |
| D | 10 | 199 | 111321 | 516.81 | 881 | 855 | 213.7 |
| D | 13 | 249 | 89738 | 415.83 | 881 | 855 | 213.7 |
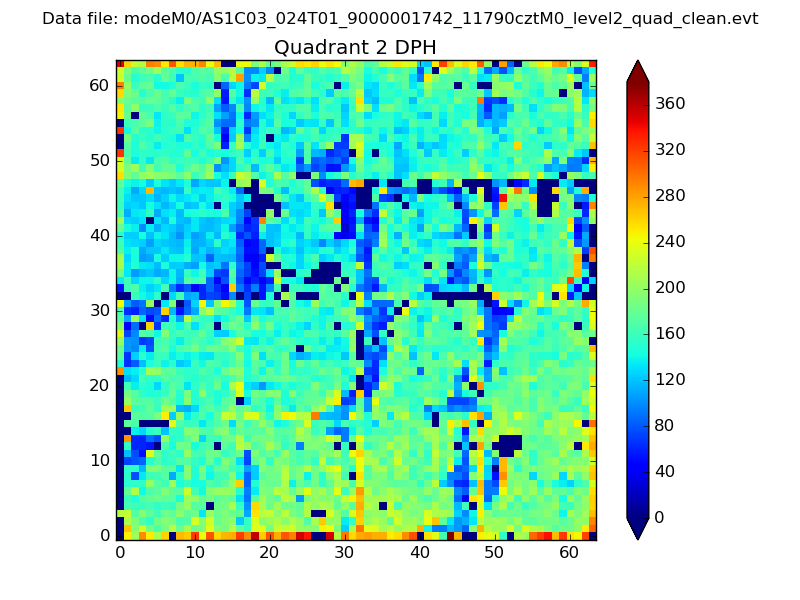
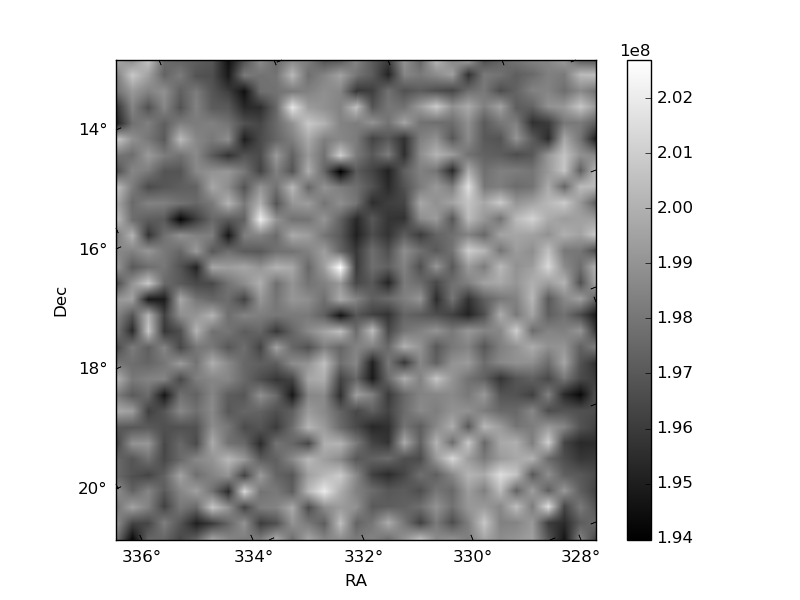
Histogram calculated using DETX and DETY for each event in the final _common_clean file
| Quadrant A | 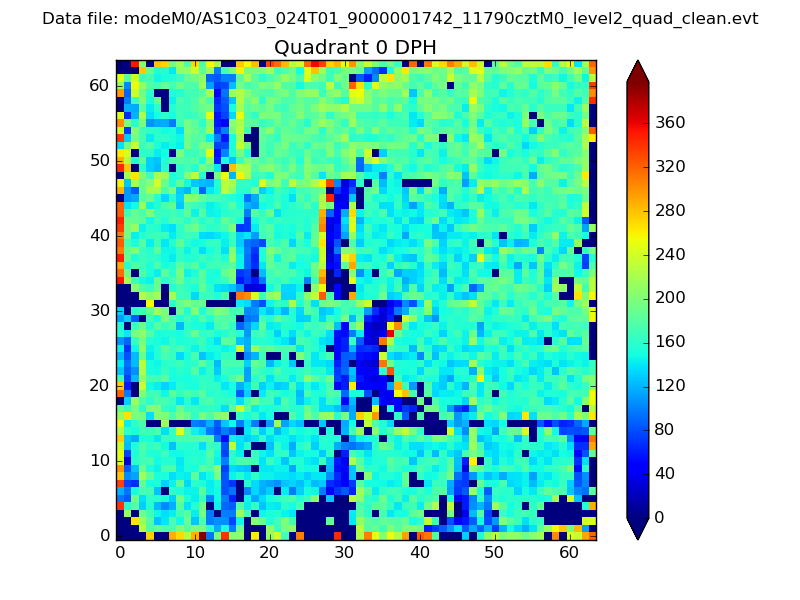 |
 |
Quadrant B |
|---|---|---|---|
| Quadrant D |  |
 |
Quadrant C |
| Plot type | Count rate plots | Images |
|---|---|---|
| Comparison with Poisson distribution Blue bars denote a histogram of data divided into 1 sec bins. Red curve is a Poisson curve with rate = median count rate of data. |
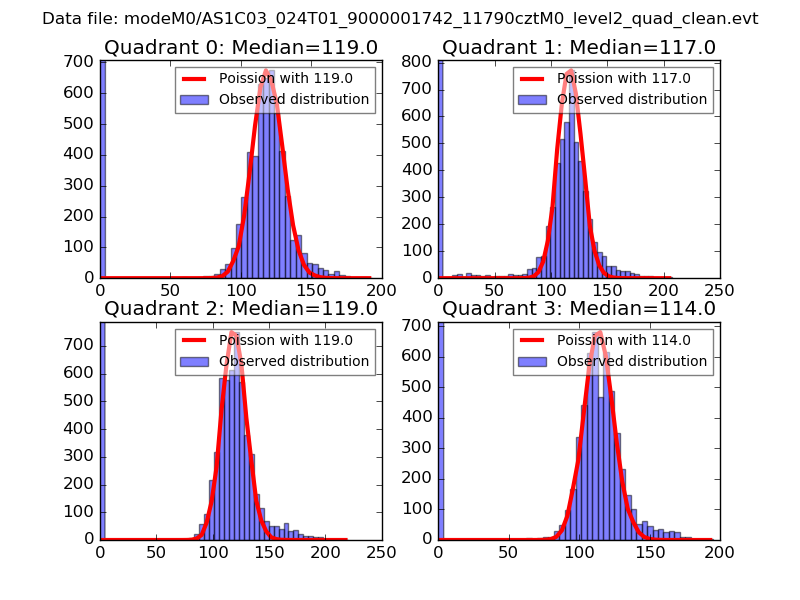 |
 |
| Quadrant-wise count rates Data is divided into 100 sec bins |
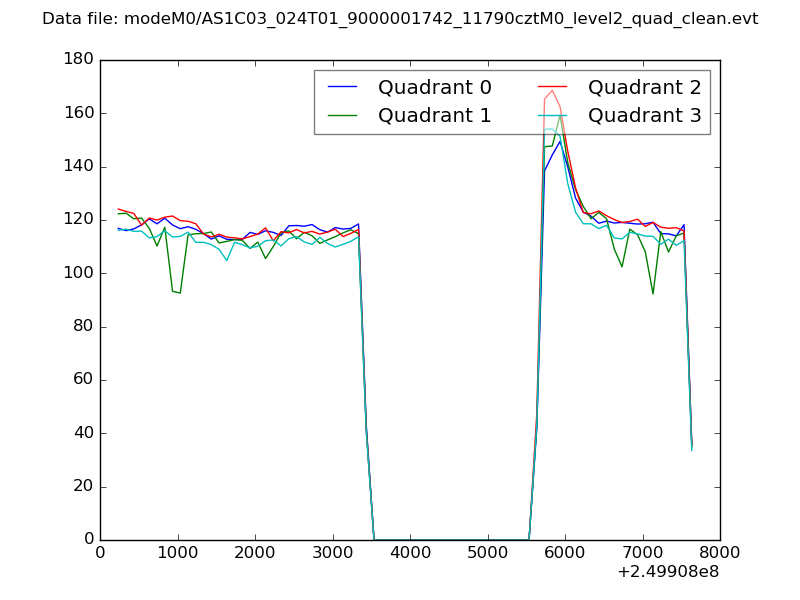 |
|
| Module-wise count rates for Quadrant A Data is divided into 100 sec bins |
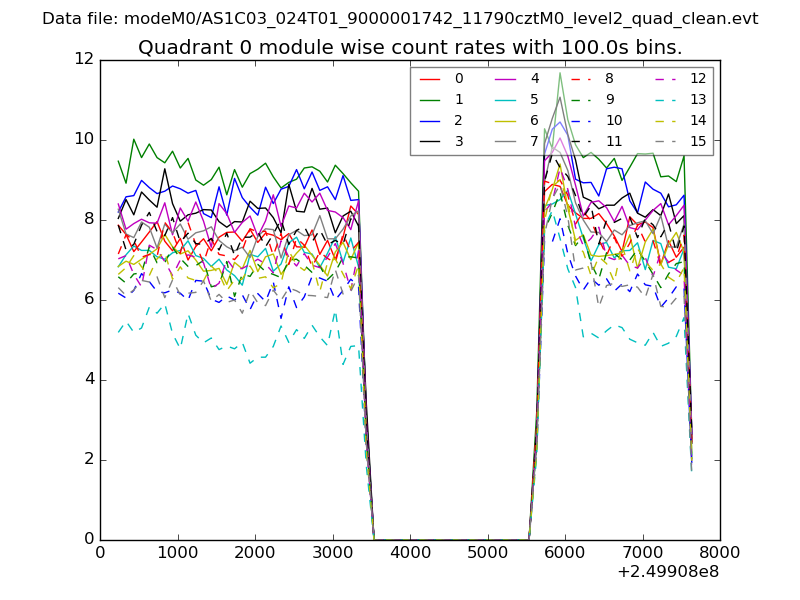 |
 |
| Module-wise count rates for Quadrant B Data is divided into 100 sec bins |
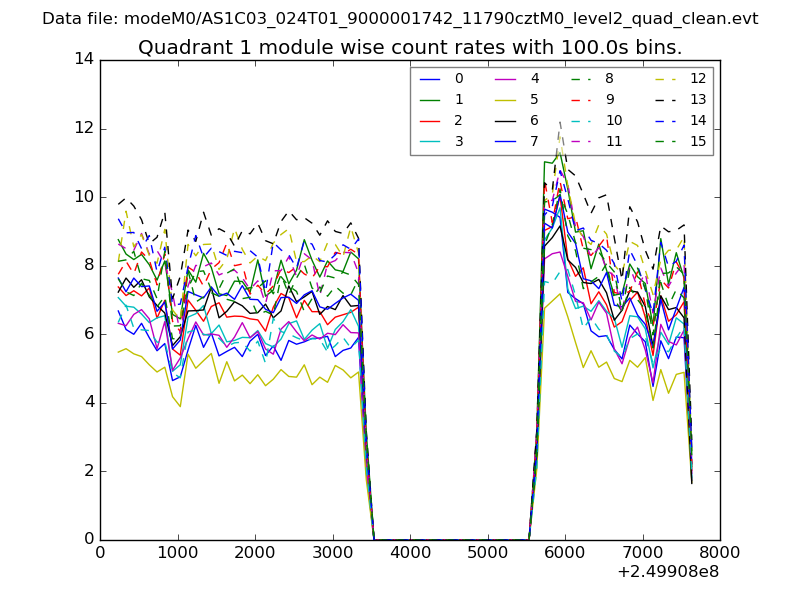 |
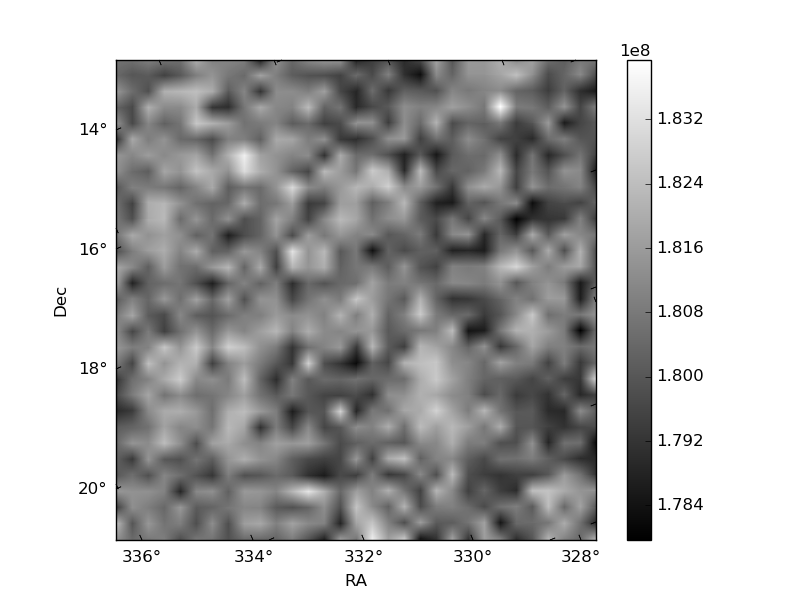 |
| Module-wise count rates for Quadrant C Data is divided into 100 sec bins |
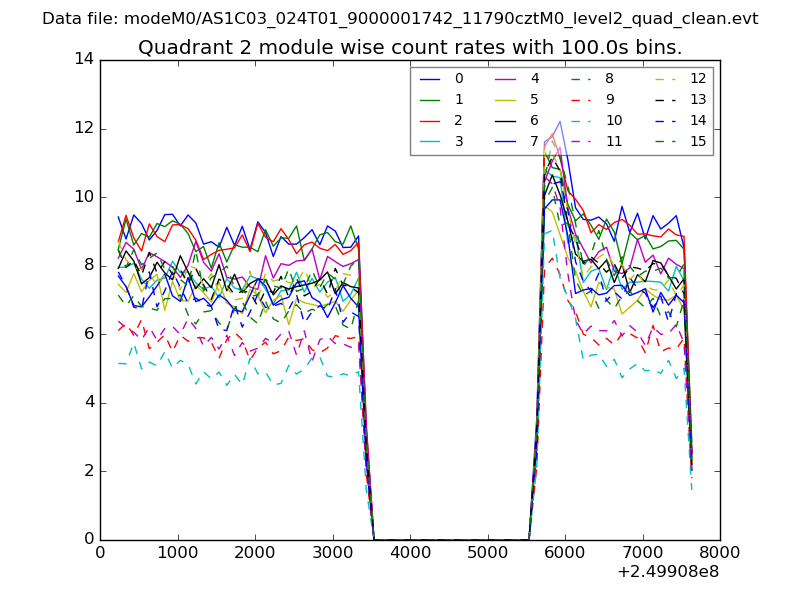 |
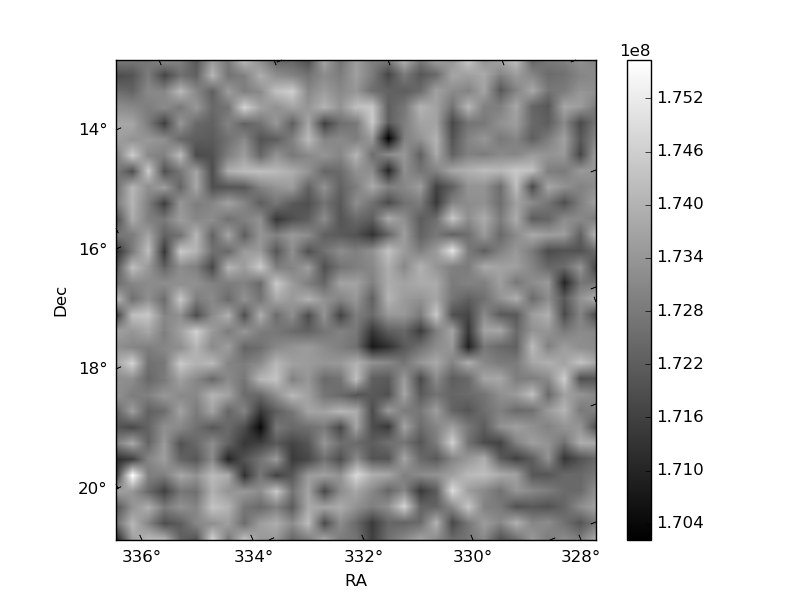 |
| Module-wise count rates for Quadrant D Data is divided into 100 sec bins |
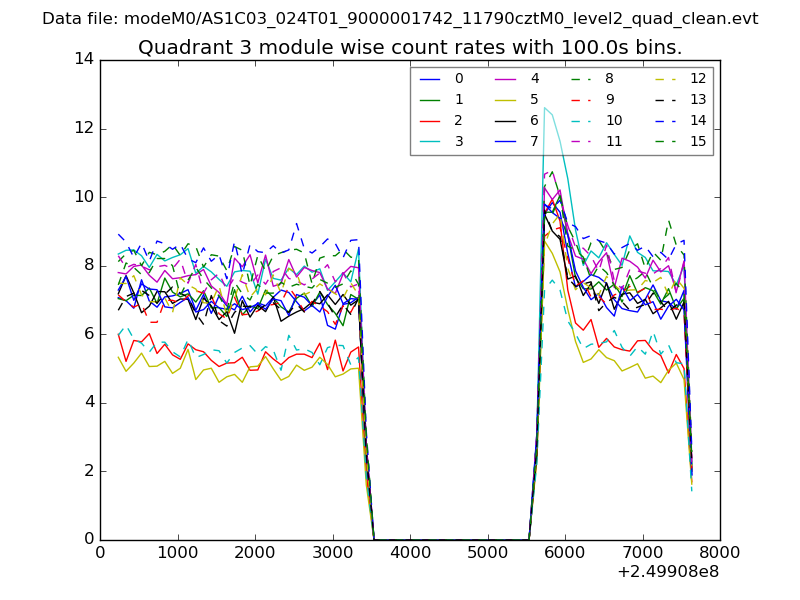 |
 |
| Parameter | Plot |
|---|---|
| CZT HV Monitor |  |
| D_VDD | 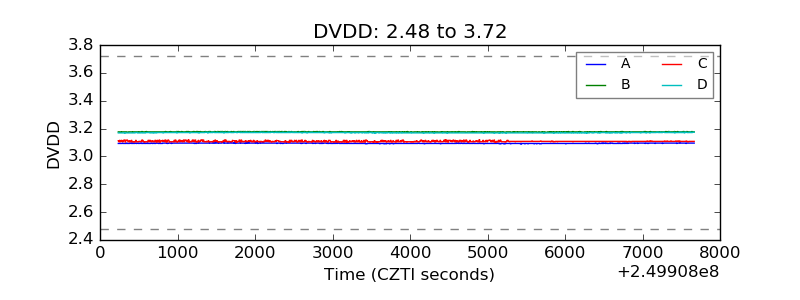 |
| Temperature 1 | 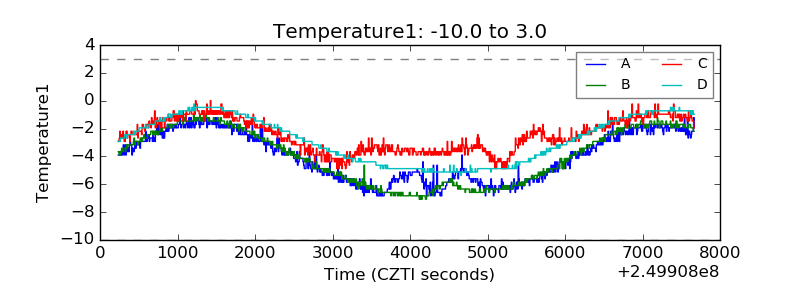 |
| Veto HV Monitor | 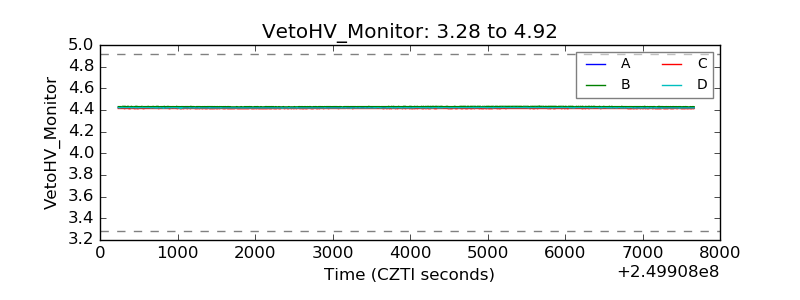 |
| Veto LLD | 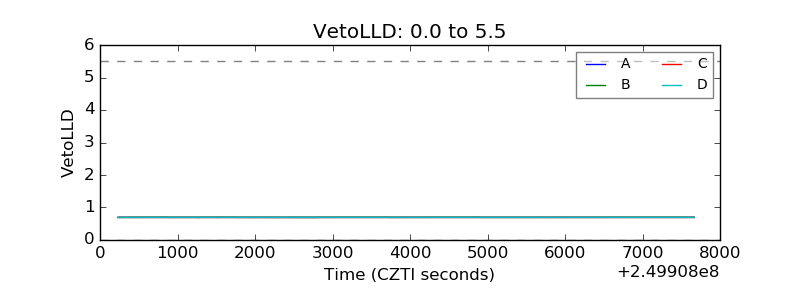 |
| Alpha Counter | 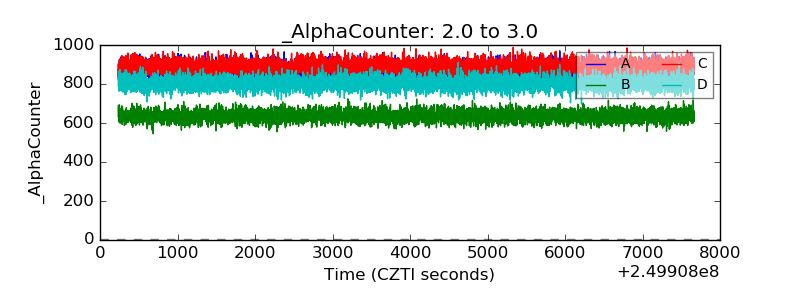 |
| _CPM_Rate | 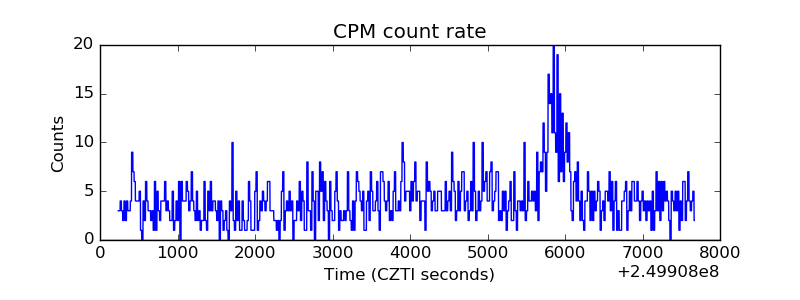 |
| CZT Counter | 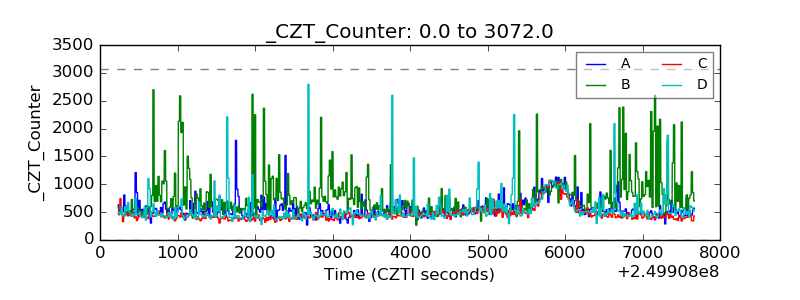 |
| +2.5 Volts monitor |  |
| +5 Volts monitor |  |
| _ROLL_ROT | 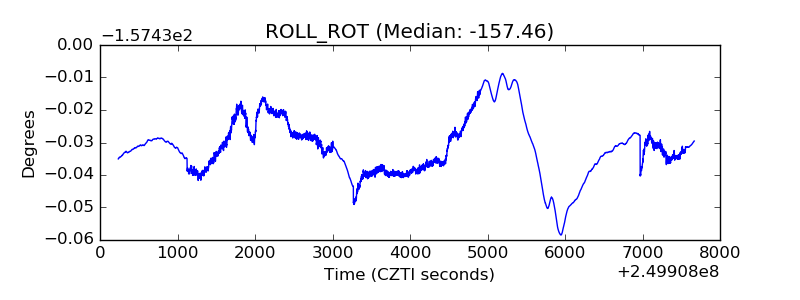 |
| _Roll_DEC | 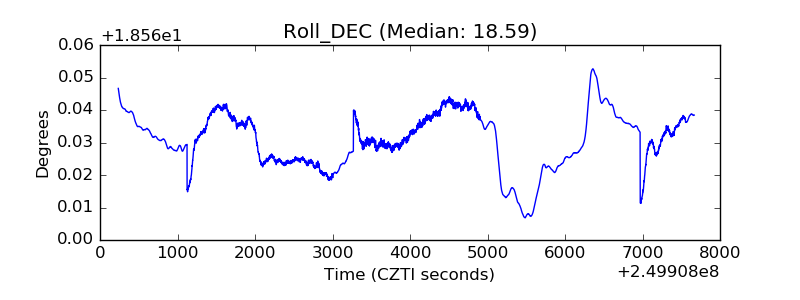 |
| _Roll_RA | 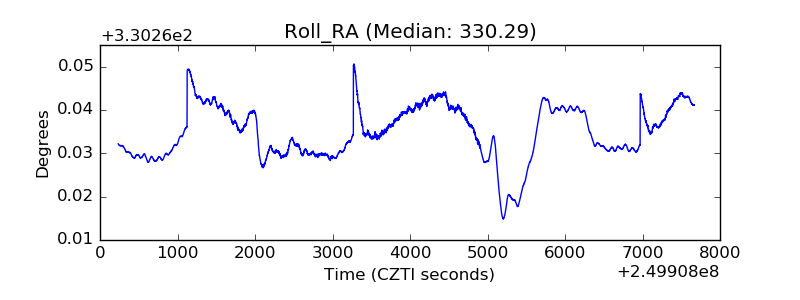 |
| Veto Counter | 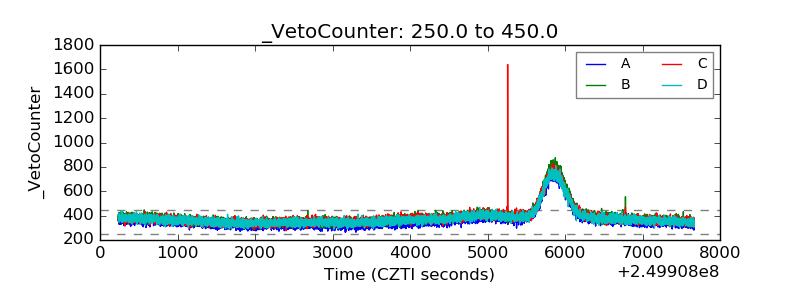 |