| Param | Original file | Final file |
|---|---|---|
| Filename | modeM0/AS1G08_058T09_9000001744_11791cztM0_level2.evt | modeM0/AS1G08_058T09_9000001744_11791cztM0_level2_quad_clean.evt |
| Size (bytes) | 536,342,400 | 87,580,800 |
| Size | 511.5 MB | 83.5 MB |
| Events in quadrant A | 4,215,476 | 547,844 |
| Events in quadrant B | 4,827,019 | 552,812 |
| Events in quadrant C | 2,992,167 | 557,235 |
| Events in quadrant D | 3,756,990 | 529,710 |
| Mode M9 | |||
|---|---|---|---|
| Quadrant | BADHDUFLAG | Total packets | Discarded packets |
| A | 0 | 13 | 0 |
| B | 0 | 13 | 0 |
| C | 0 | 13 | 0 |
| D | 0 | 14 | 0 |
| Mode M0 | |||
|---|---|---|---|
| Quadrant | BADHDUFLAG | Total packets | Discarded packets |
| A | 0 | 17034 | 3 |
| B | 0 | 18824 | 2 |
| C | 0 | 13546 | 2 |
| D | 0 | 15827 | 2 |
| Mode SS | |||
|---|---|---|---|
| Quadrant | BADHDUFLAG | Total packets | Discarded packets |
| A | 0 | 136 | 0 |
| B | 0 | 136 | 0 |
| C | 0 | 136 | 0 |
| D | 0 | 136 | 0 |
| Quadrant | Total seconds | Saturated seconds | Saturation percentage |
|---|---|---|---|
| A | 6659 | 70 | 1.051209% |
| B | 6659 | 279 | 4.189818% |
| C | 6659 | 19 | 0.285328% |
| D | 6659 | 160 | 2.402763% |
Noise dominated data is calculated using 1-second bins in cleaned event files. If a bin has >2000 counts, and if more than 50% of those come from <1% of pixels, then it is considered to be noise-dominated and hence unusable.
| Quadrant | # 1 sec bins | Bins with >0 counts | Bins with >2000 counts | High rate bins dominated by noise | Noise dominated (total time) | Noise dominated (detector-on time) | Marked lightcurve |
|---|---|---|---|---|---|---|---|
| A | 7625 | 6661 | 2 | 2 | 0.03% | 0.03% | 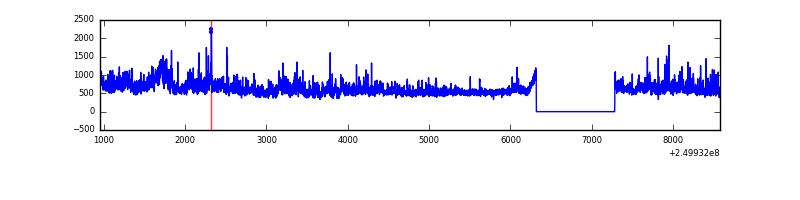 |
| B | 7625 | 6661 | 155 | 155 | 2.03% | 2.33% | 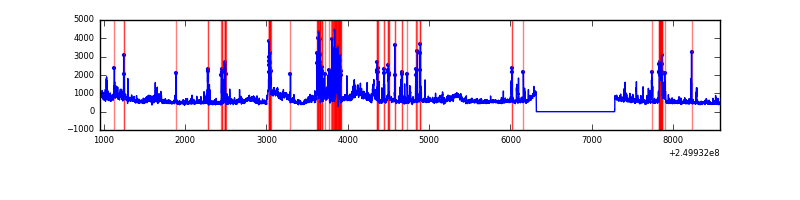 |
| C | 7625 | 6661 | 0 | 0 | 0.00% | 0.00% | 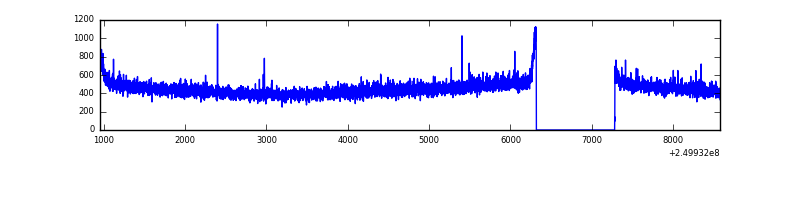 |
| D | 7625 | 6661 | 112 | 112 | 1.47% | 1.68% | 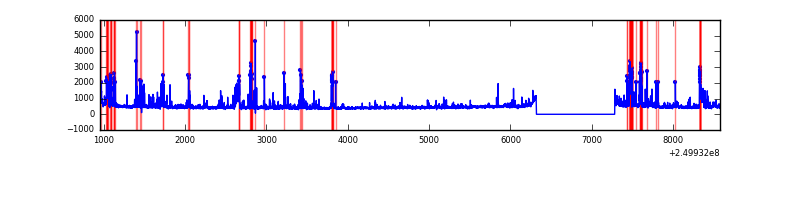 |
Top three noisy pixels from each quadrant. If the there are fewer than three noisy pixels in the level2.evt file, extra rows are filled as -1
| Pixel properties | Quadrant properties | ||||||
|---|---|---|---|---|---|---|---|
| Quadrant | DetID | PixID | Counts | Sigma | Mean | Median | Sigma |
| A | 8 | 15 | 869332 | 5389.24 | 784 | 768 | 161.2 |
| A | 1 | 162 | 122582 | 755.83 | 784 | 768 | 161.2 |
| A | 1 | 178 | 67047 | 411.25 | 784 | 768 | 161.2 |
| B | 10 | 16 | 819391 | 5423.04 | 781 | 761 | 151.0 |
| B | 3 | 64 | 520445 | 3442.66 | 781 | 761 | 151.0 |
| B | 4 | 239 | 257537 | 1701.02 | 781 | 761 | 151.0 |
| C | 13 | 61 | 5719 | 27.85 | 766 | 771 | 177.6 |
| C | 1 | 3 | 2777 | 11.29 | 766 | 771 | 177.6 |
| C | 3 | 202 | 1919 | 6.46 | 766 | 771 | 177.6 |
| D | 9 | 85 | 270061 | 1468.93 | 759 | 737 | 183.3 |
| D | 1 | 52 | 190359 | 1034.23 | 759 | 737 | 183.3 |
| D | 10 | 199 | 139288 | 755.68 | 759 | 737 | 183.3 |
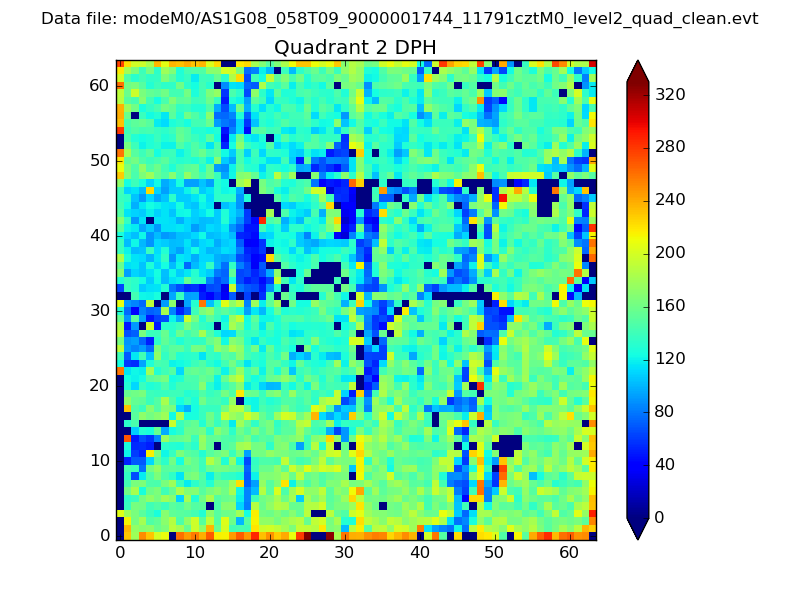
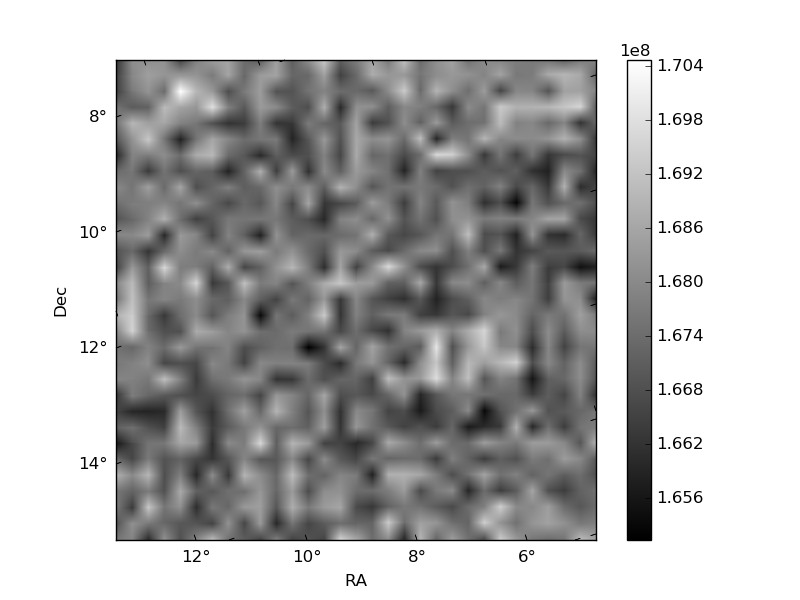
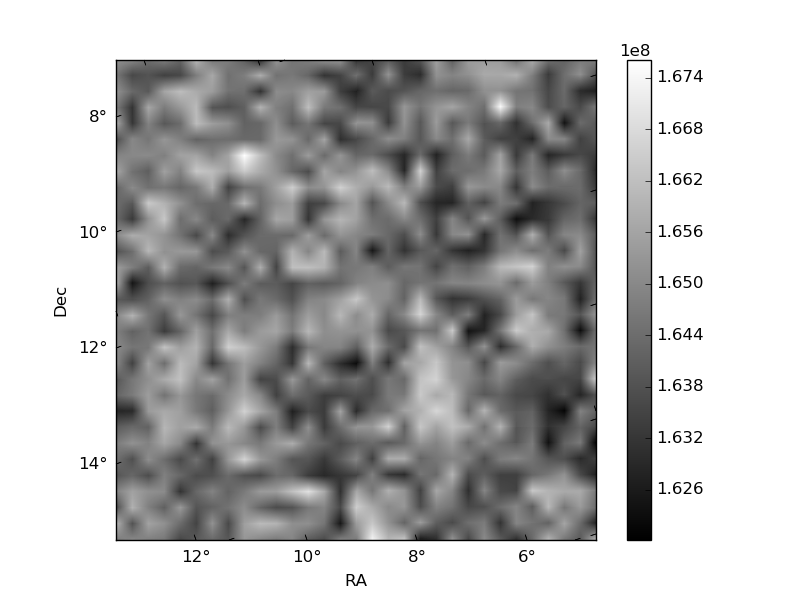
Histogram calculated using DETX and DETY for each event in the final _common_clean file
| Quadrant A | 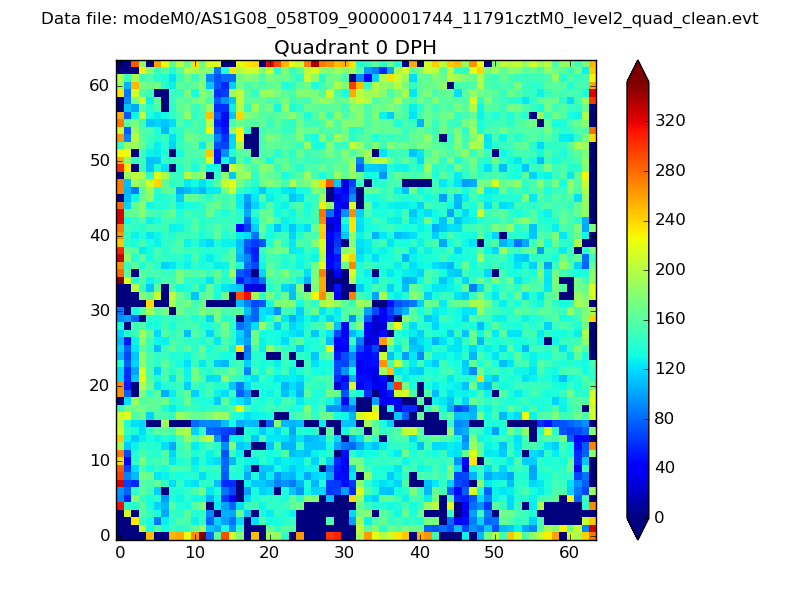 |
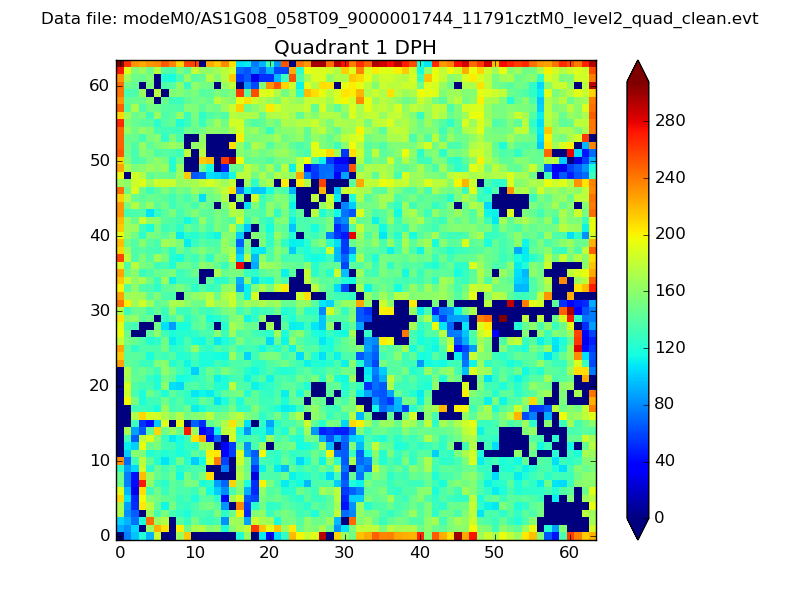 |
Quadrant B |
|---|---|---|---|
| Quadrant D | 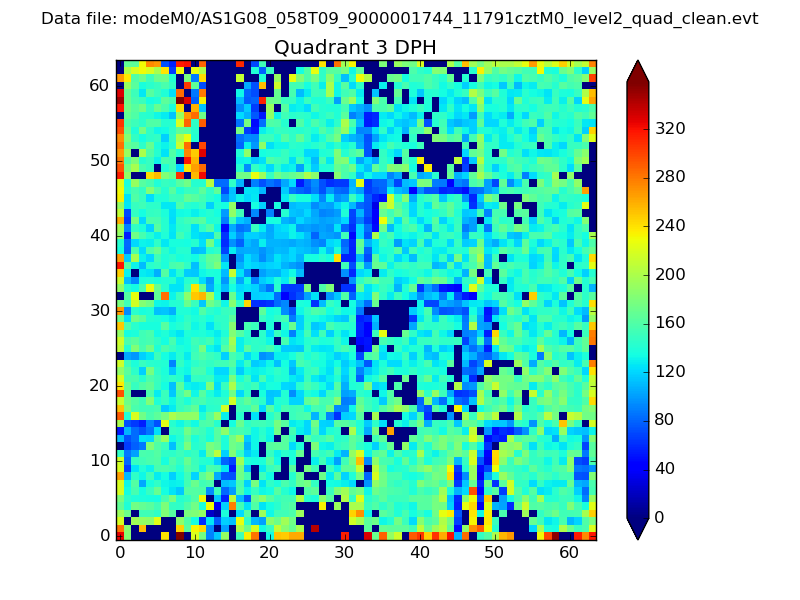 |
 |
Quadrant C |
| Plot type | Count rate plots | Images |
|---|---|---|
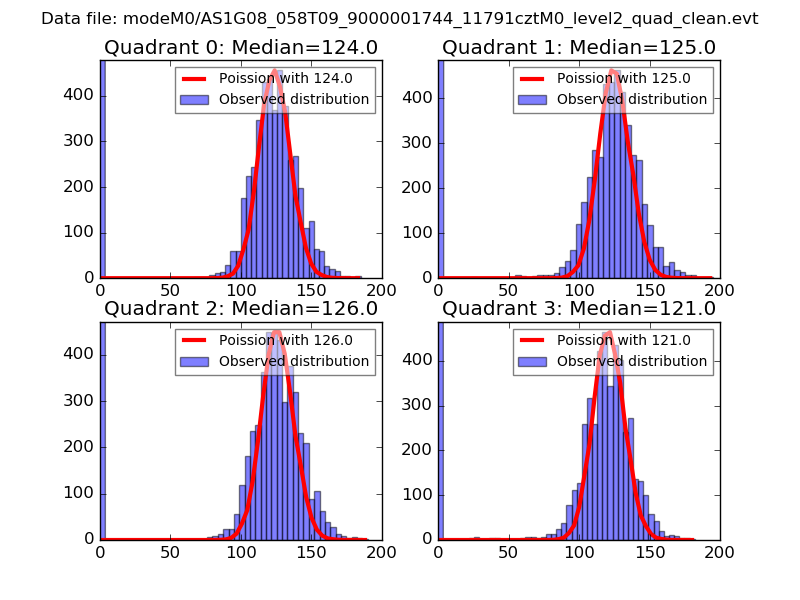
| Comparison with Poisson distribution Blue bars denote a histogram of data divided into 1 sec bins. Red curve is a Poisson curve with rate = median count rate of data. |
 |
 |
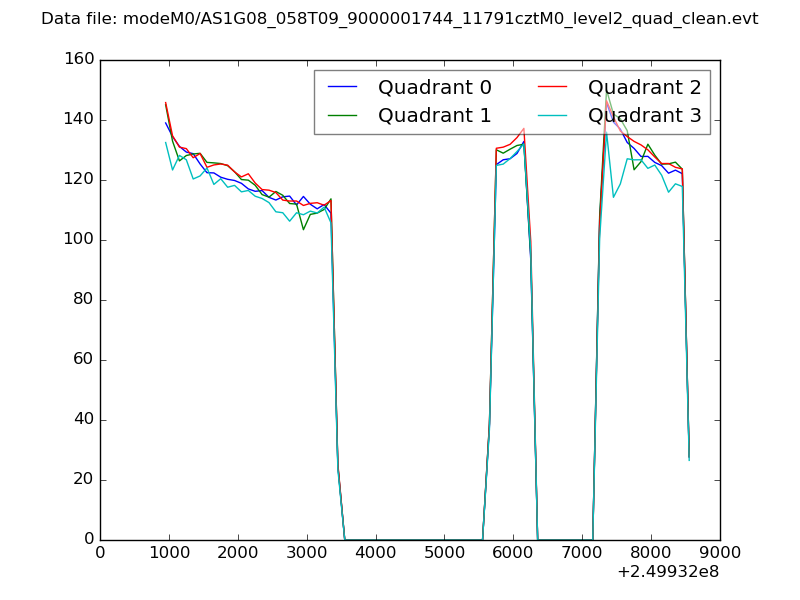
| Quadrant-wise count rates Data is divided into 100 sec bins |
 |
|
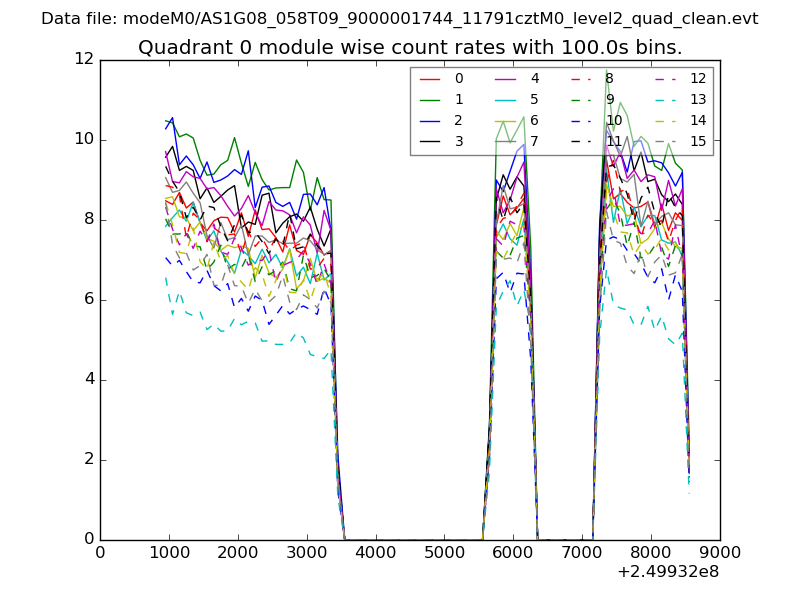
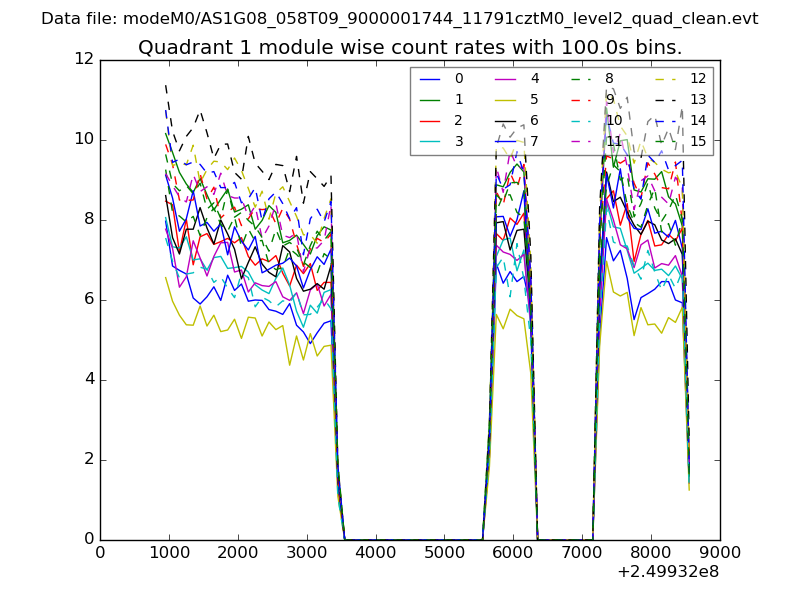
| Module-wise count rates for Quadrant A Data is divided into 100 sec bins |
 |
 |
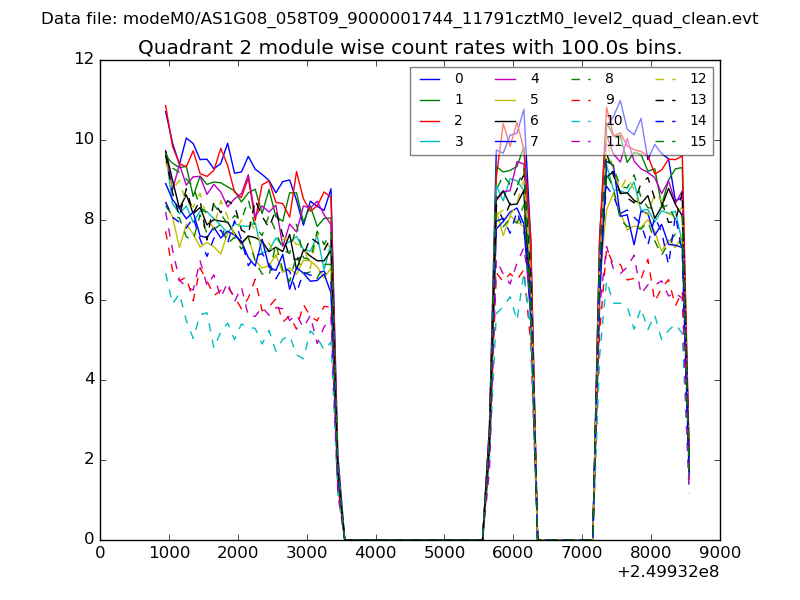
| Module-wise count rates for Quadrant B Data is divided into 100 sec bins |
 |
 |
| Module-wise count rates for Quadrant C Data is divided into 100 sec bins |
 |
 |
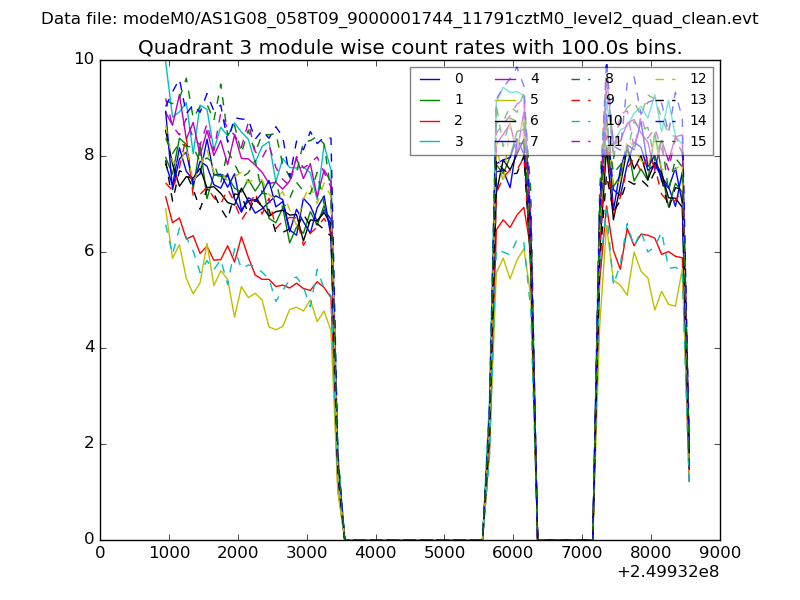
| Module-wise count rates for Quadrant D Data is divided into 100 sec bins |
 |
 |
| Parameter | Plot |
|---|---|
| CZT HV Monitor | 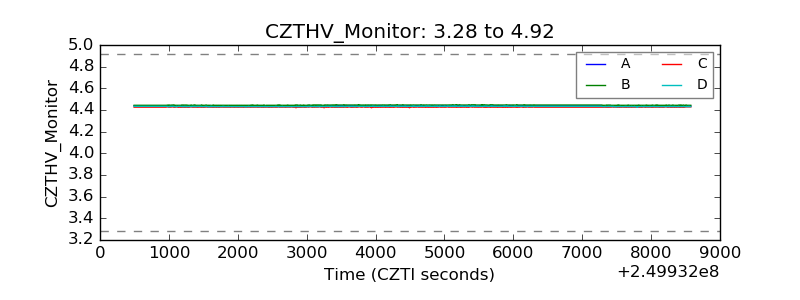 |
| D_VDD | 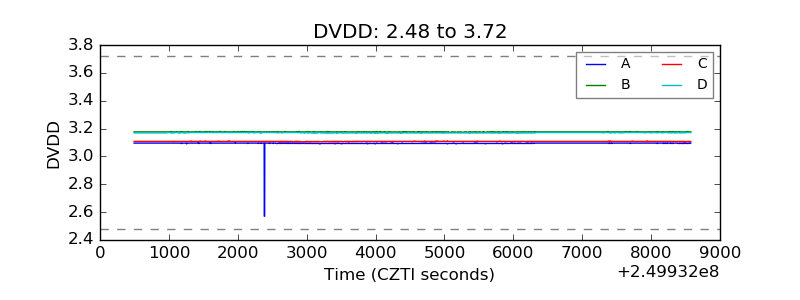 |
| Temperature 1 | 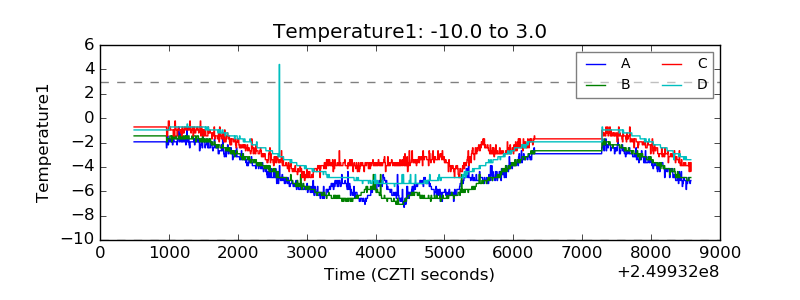 |
| Veto HV Monitor | 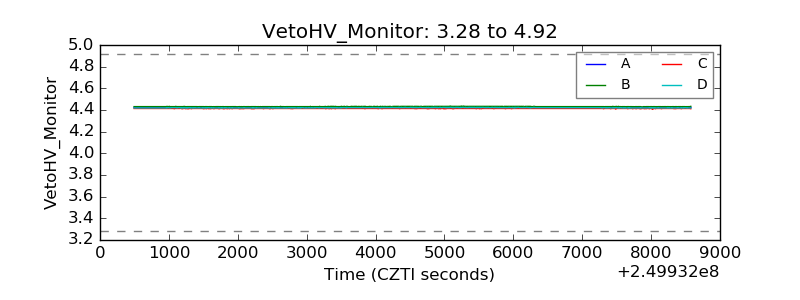 |
| Veto LLD | 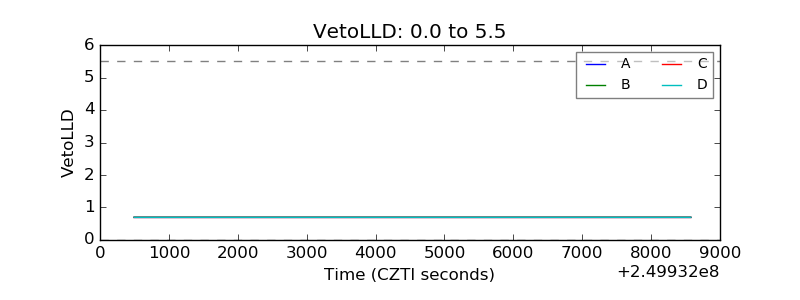 |
| Alpha Counter | 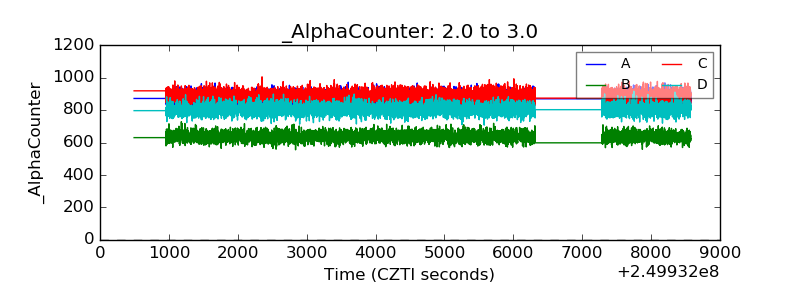 |
| _CPM_Rate | 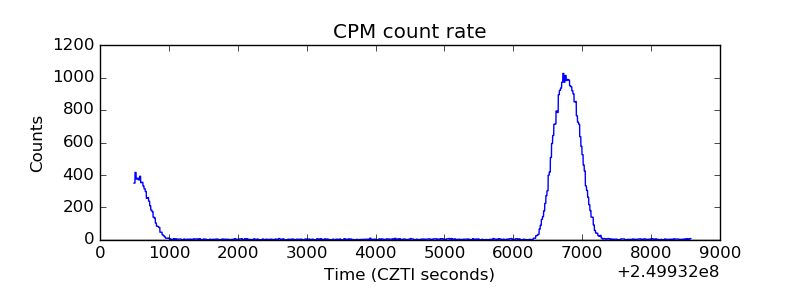 |
| CZT Counter | 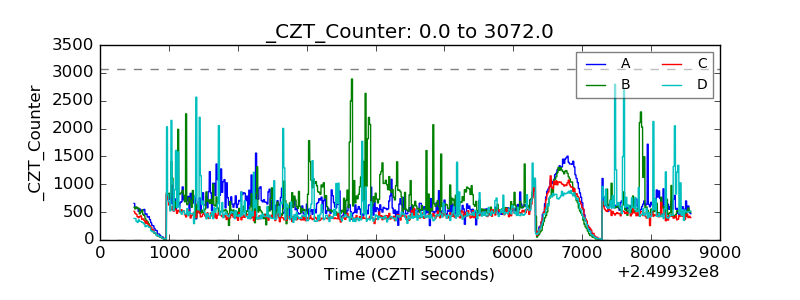 |
| +2.5 Volts monitor |  |
| +5 Volts monitor |  |
| _ROLL_ROT | 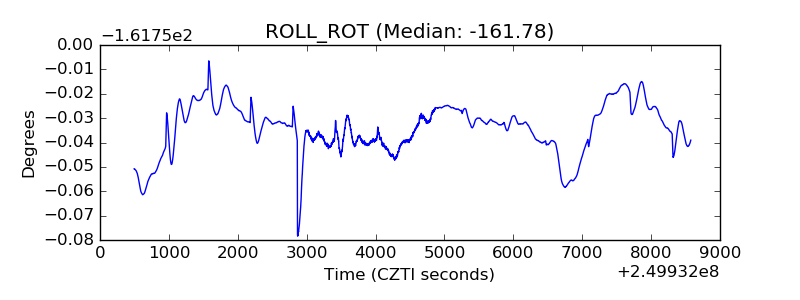 |
| _Roll_DEC | 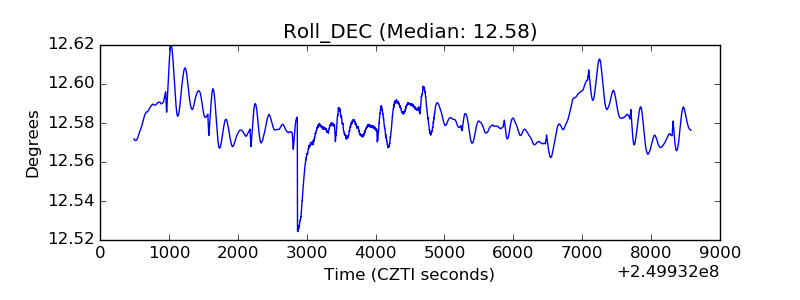 |
| _Roll_RA | 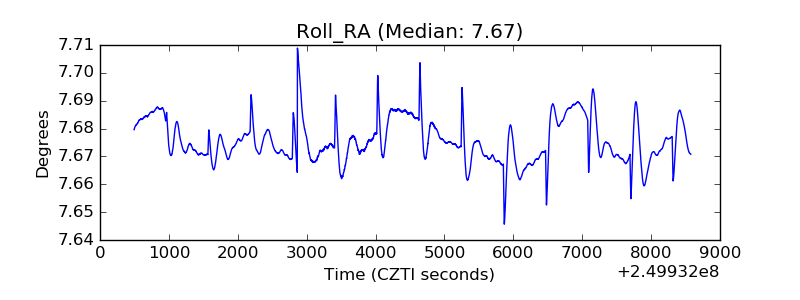 |
| Veto Counter | 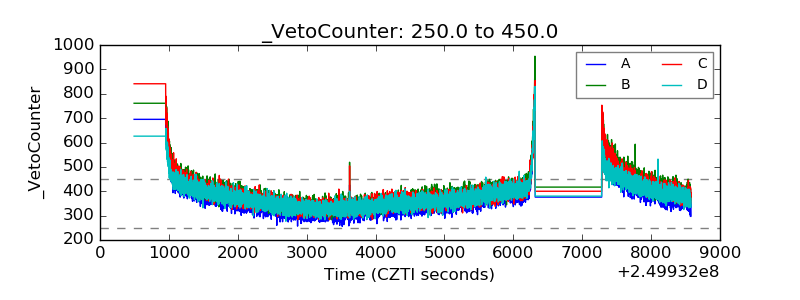 |