| Param | Original file | Final file |
|---|---|---|
| Filename | modeM0/AS1G08_058T09_9000001744_11793cztM0_level2.evt | modeM0/AS1G08_058T09_9000001744_11793cztM0_level2_quad_clean.evt |
| Size (bytes) | 524,108,160 | 86,529,600 |
| Size | 499.8 MB | 82.5 MB |
| Events in quadrant A | 4,594,811 | 540,510 |
| Events in quadrant B | 4,106,411 | 551,992 |
| Events in quadrant C | 2,957,881 | 554,690 |
| Events in quadrant D | 3,775,907 | 522,761 |
| Mode M9 | |||
|---|---|---|---|
| Quadrant | BADHDUFLAG | Total packets | Discarded packets |
| A | 0 | 16 | 0 |
| B | 0 | 16 | 0 |
| C | 0 | 16 | 0 |
| D | 0 | 17 | 0 |
| Mode M0 | |||
|---|---|---|---|
| Quadrant | BADHDUFLAG | Total packets | Discarded packets |
| A | 0 | 17864 | 3 |
| B | 0 | 16297 | 2 |
| C | 0 | 13165 | 2 |
| D | 0 | 15612 | 2 |
| Mode SS | |||
|---|---|---|---|
| Quadrant | BADHDUFLAG | Total packets | Discarded packets |
| A | 0 | 132 | 0 |
| B | 0 | 132 | 0 |
| C | 0 | 132 | 0 |
| D | 0 | 132 | 0 |
| Quadrant | Total seconds | Saturated seconds | Saturation percentage |
|---|---|---|---|
| A | 6452 | 200 | 3.099814% |
| B | 6452 | 171 | 2.650341% |
| C | 6452 | 17 | 0.263484% |
| D | 6452 | 119 | 1.844389% |
Noise dominated data is calculated using 1-second bins in cleaned event files. If a bin has >2000 counts, and if more than 50% of those come from <1% of pixels, then it is considered to be noise-dominated and hence unusable.
| Quadrant | # 1 sec bins | Bins with >0 counts | Bins with >2000 counts | High rate bins dominated by noise | Noise dominated (total time) | Noise dominated (detector-on time) | Marked lightcurve |
|---|---|---|---|---|---|---|---|
| A | 7588 | 6454 | 129 | 129 | 1.70% | 2.00% | 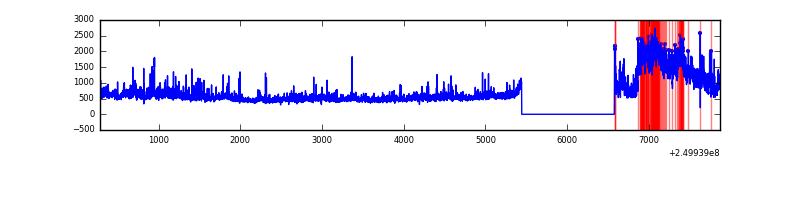 |
| B | 7588 | 6454 | 88 | 88 | 1.16% | 1.36% | 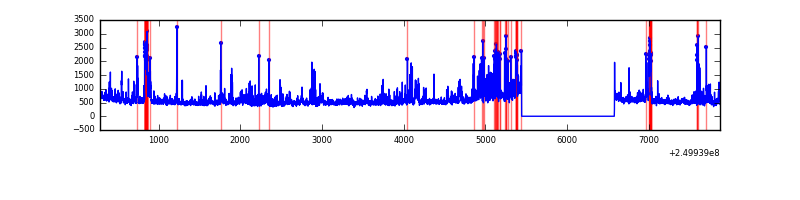 |
| C | 7588 | 6454 | 8 | 8 | 0.11% | 0.12% | 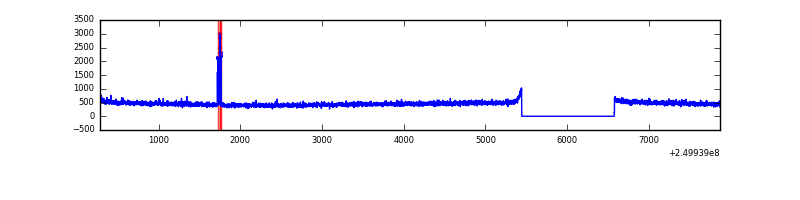 |
| D | 7588 | 6454 | 97 | 97 | 1.28% | 1.50% | 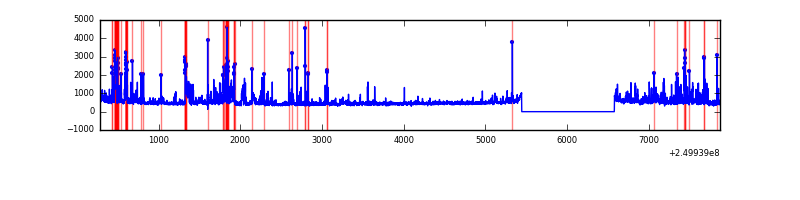 |
Top three noisy pixels from each quadrant. If the there are fewer than three noisy pixels in the level2.evt file, extra rows are filled as -1
| Pixel properties | Quadrant properties | ||||||
|---|---|---|---|---|---|---|---|
| Quadrant | DetID | PixID | Counts | Sigma | Mean | Median | Sigma |
| A | 8 | 15 | 1342418 | 8654.54 | 761 | 746 | 155.0 |
| A | 1 | 162 | 122110 | 782.87 | 761 | 746 | 155.0 |
| A | 1 | 178 | 64772 | 413.0 | 761 | 746 | 155.0 |
| B | 10 | 16 | 637941 | 4383.87 | 767 | 748 | 145.3 |
| B | 4 | 239 | 250210 | 1716.29 | 767 | 748 | 145.3 |
| B | 3 | 64 | 91075 | 621.45 | 767 | 748 | 145.3 |
| C | 7 | 238 | 36590 | 205.57 | 749 | 754 | 174.3 |
| C | 13 | 61 | 5537 | 27.44 | 749 | 754 | 174.3 |
| C | 12 | 4 | 1968 | 6.96 | 749 | 754 | 174.3 |
| D | 1 | 52 | 316666 | 1756.38 | 739 | 718 | 179.9 |
| D | 9 | 85 | 293500 | 1627.6 | 739 | 718 | 179.9 |
| D | 13 | 104 | 129703 | 717.04 | 739 | 718 | 179.9 |
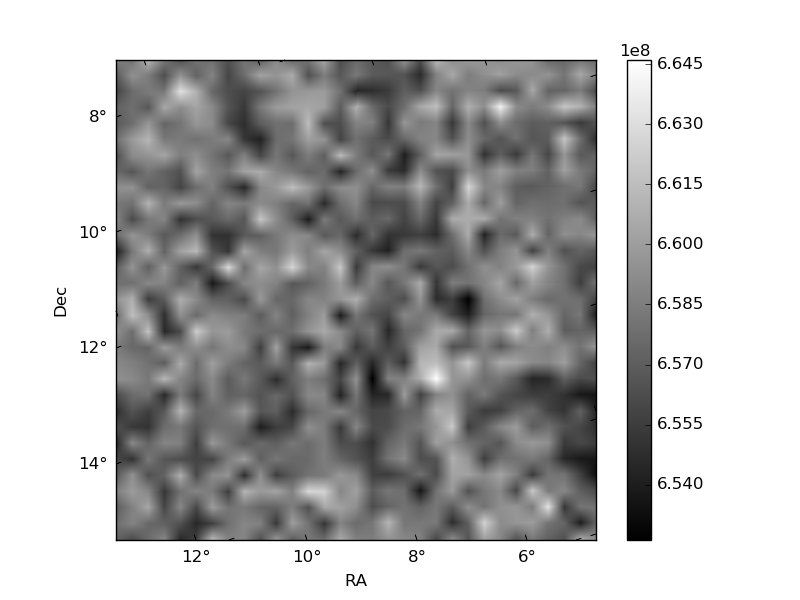
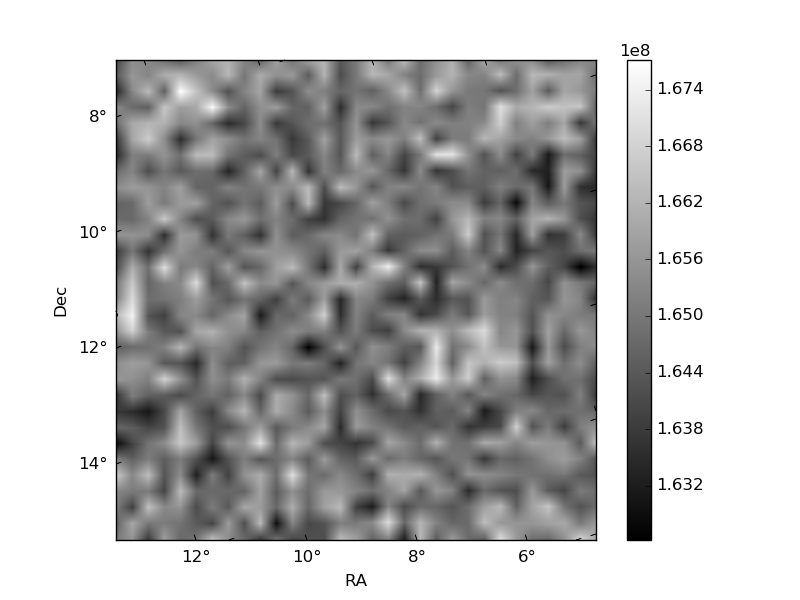
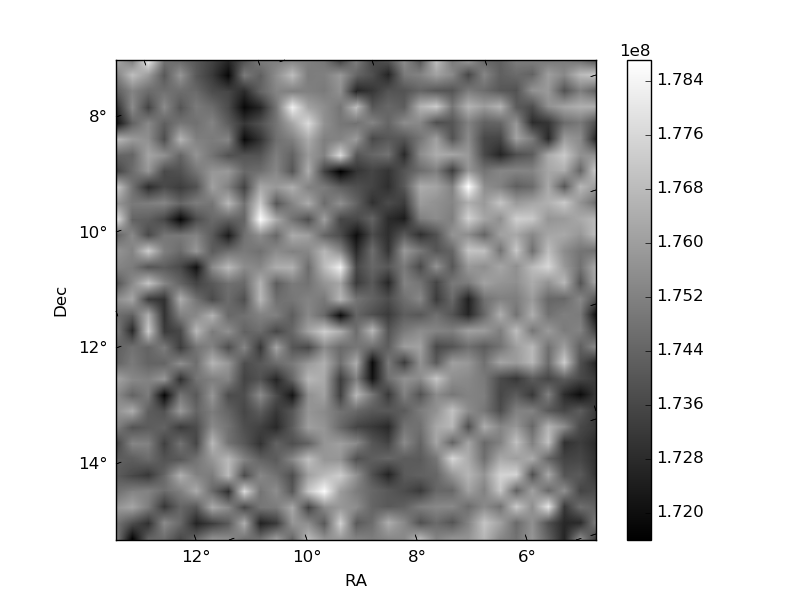
Histogram calculated using DETX and DETY for each event in the final _common_clean file
| Quadrant A | 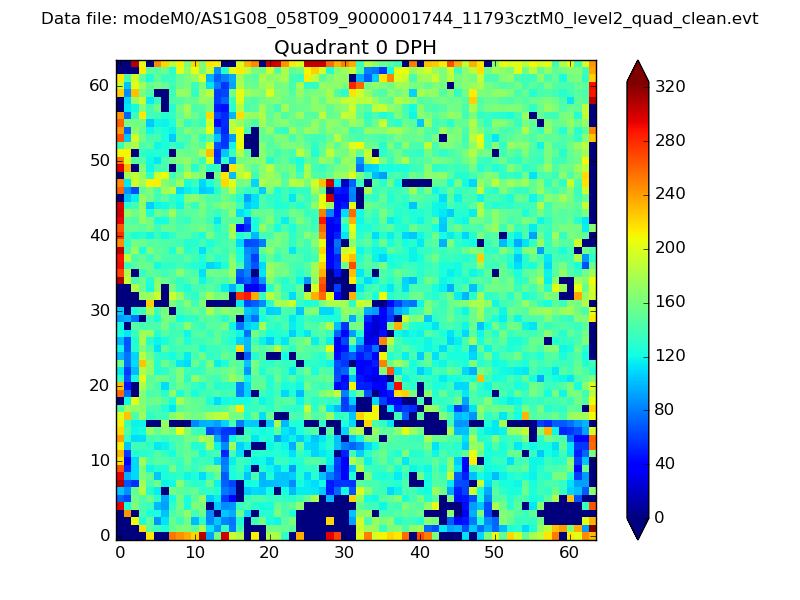 |
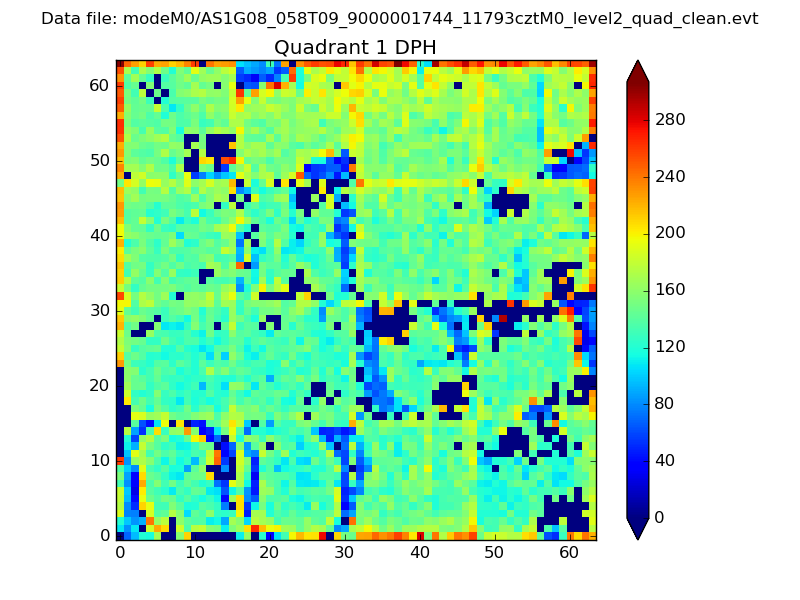 |
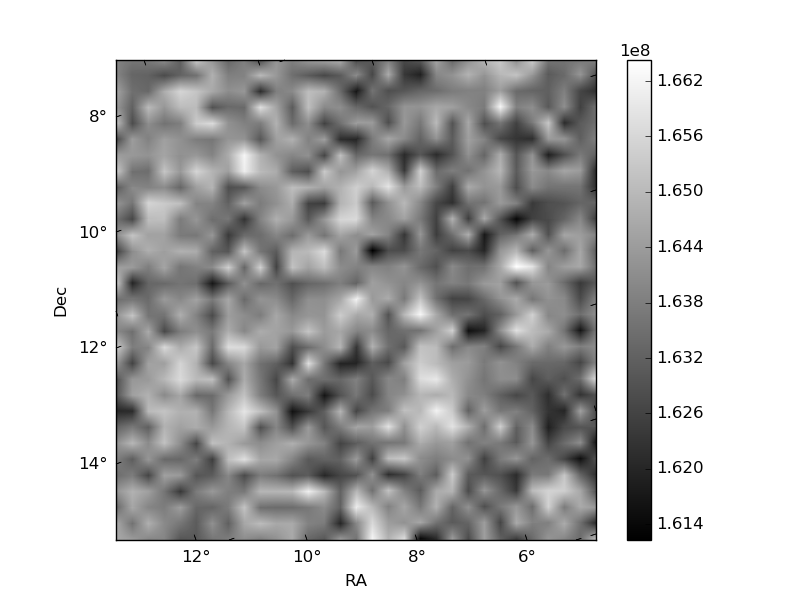
Quadrant B |
|---|---|---|---|
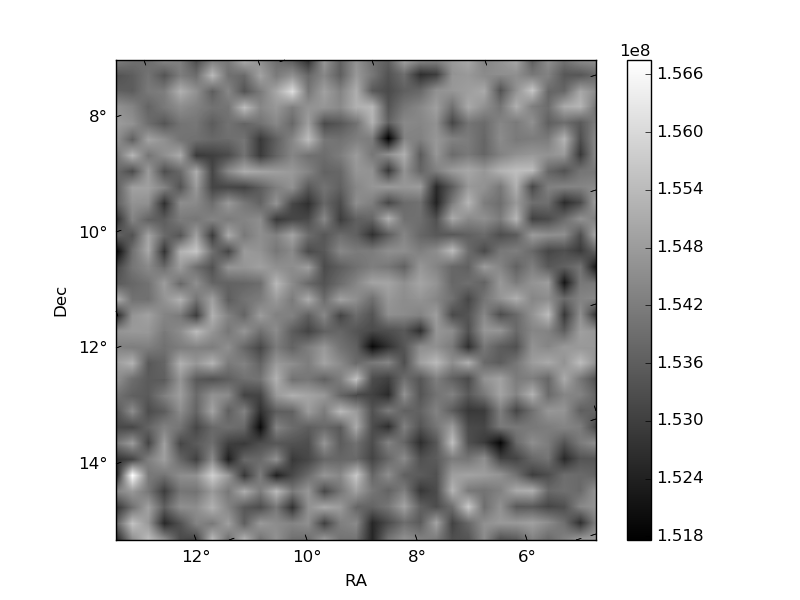
| Quadrant D | 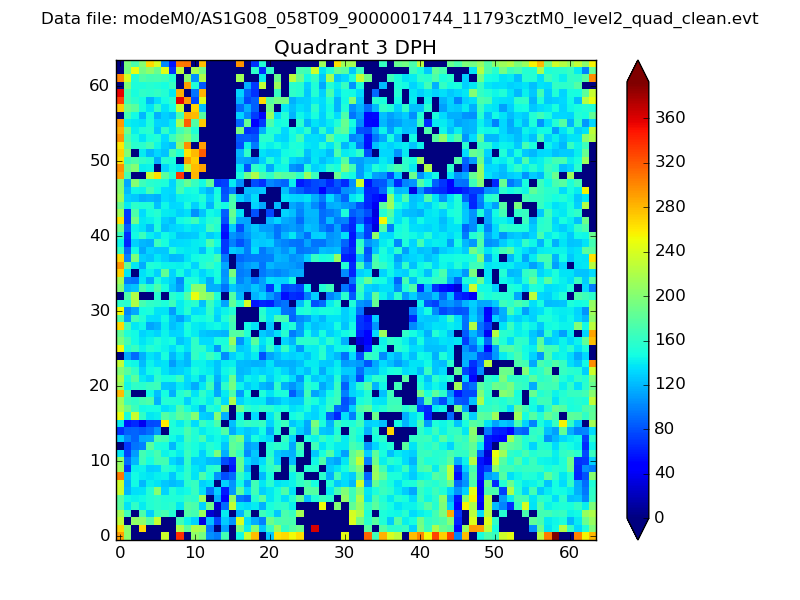 |
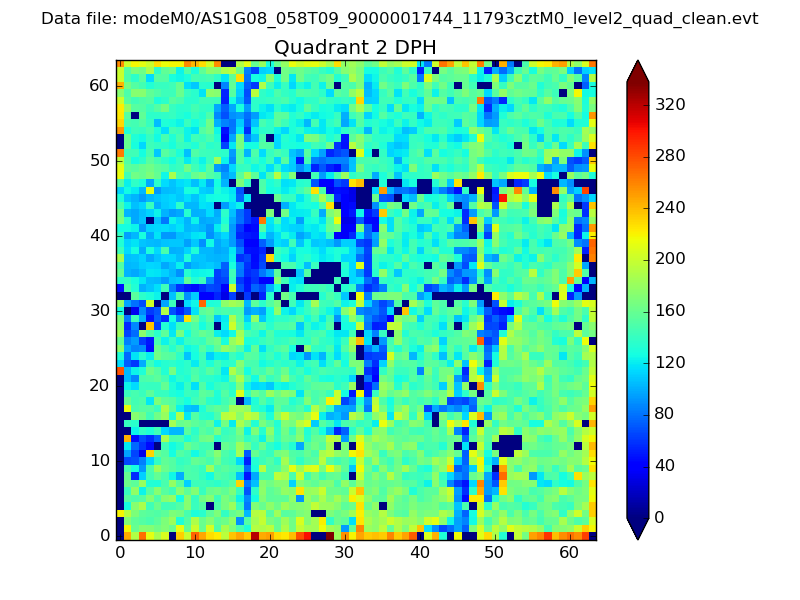 |
Quadrant C |
| Plot type | Count rate plots | Images |
|---|---|---|
| Comparison with Poisson distribution Blue bars denote a histogram of data divided into 1 sec bins. Red curve is a Poisson curve with rate = median count rate of data. |
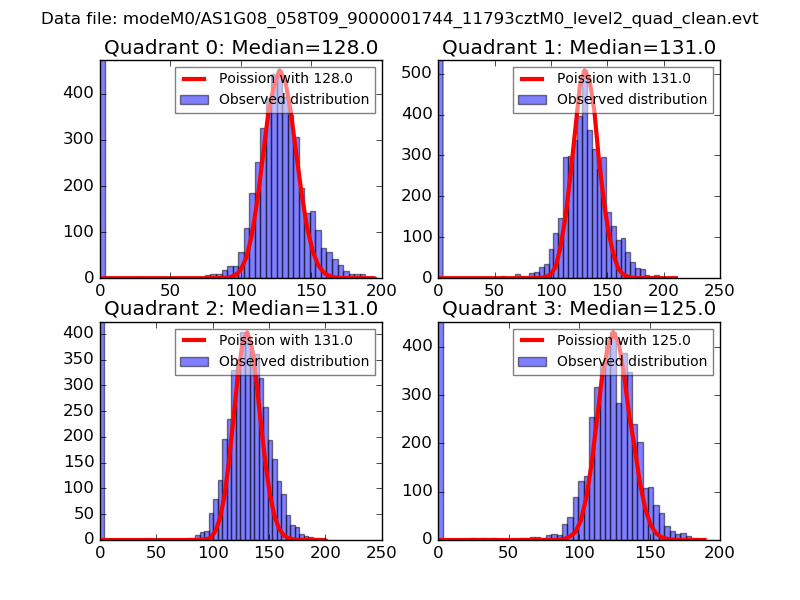 |
 |
| Quadrant-wise count rates Data is divided into 100 sec bins |
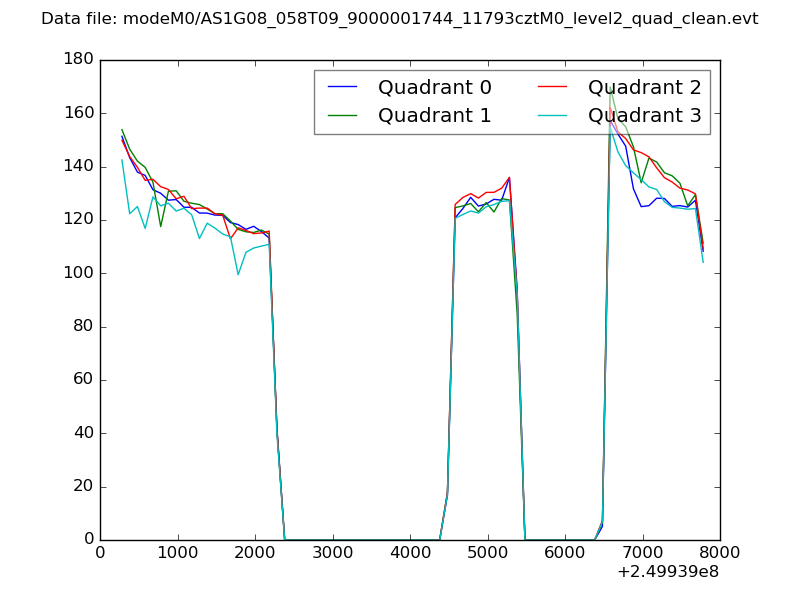 |
|
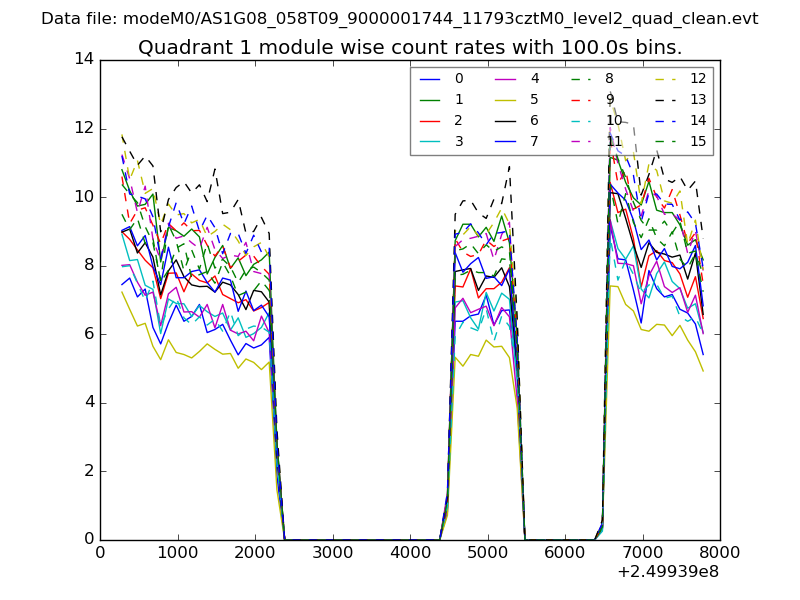
| Module-wise count rates for Quadrant A Data is divided into 100 sec bins |
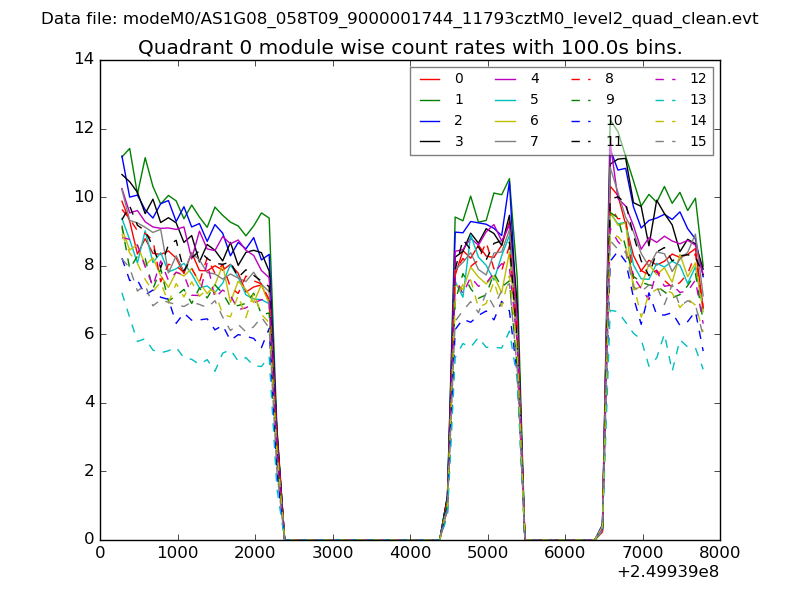 |
 |
| Module-wise count rates for Quadrant B Data is divided into 100 sec bins |
 |
 |
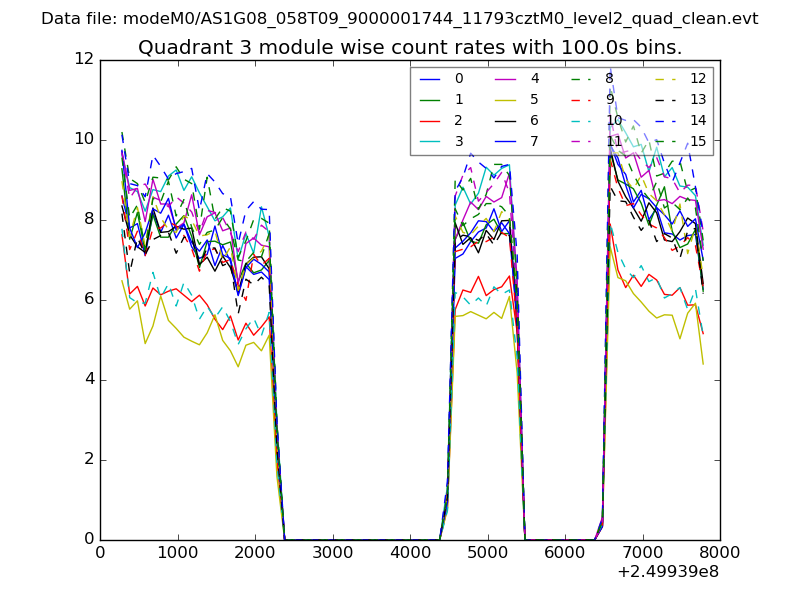
| Module-wise count rates for Quadrant C Data is divided into 100 sec bins |
 |
 |
| Module-wise count rates for Quadrant D Data is divided into 100 sec bins |
 |
 |
| Parameter | Plot |
|---|---|
| CZT HV Monitor | 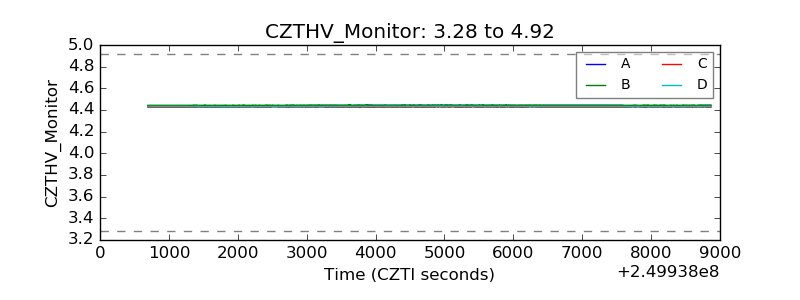 |
| D_VDD | 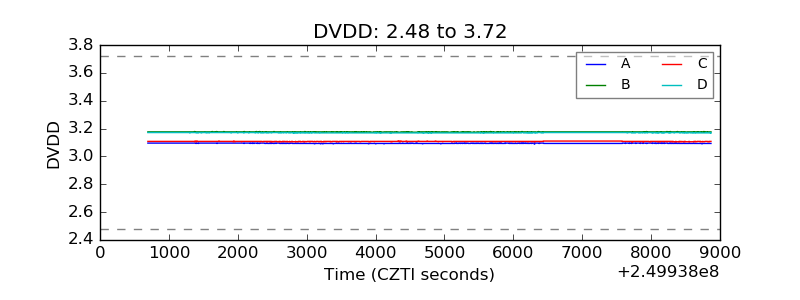 |
| Temperature 1 | 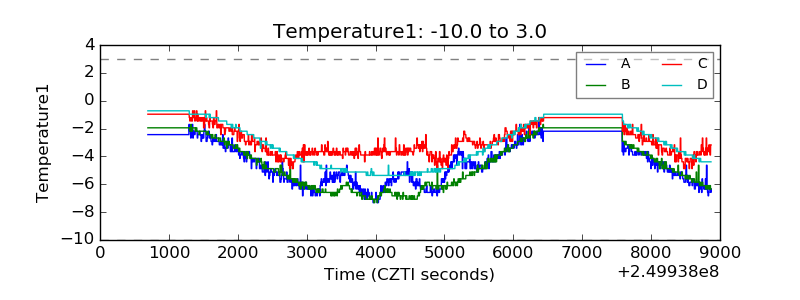 |
| Veto HV Monitor | 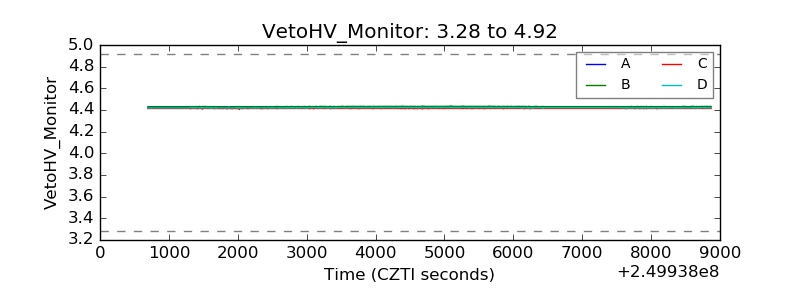 |
| Veto LLD | 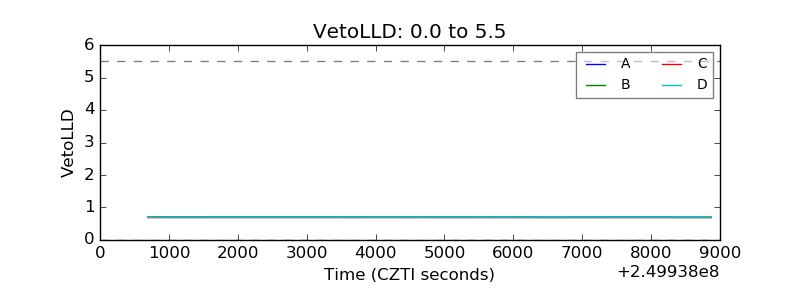 |
| Alpha Counter | 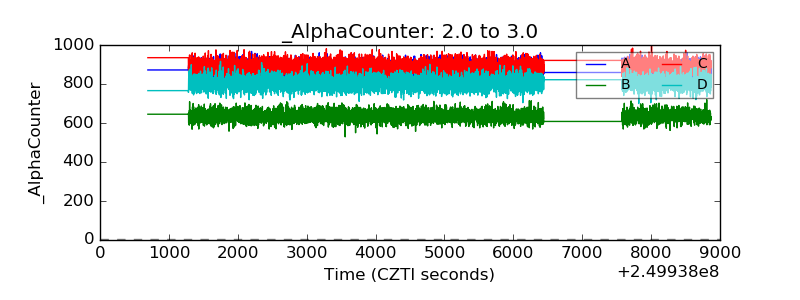 |
| _CPM_Rate | 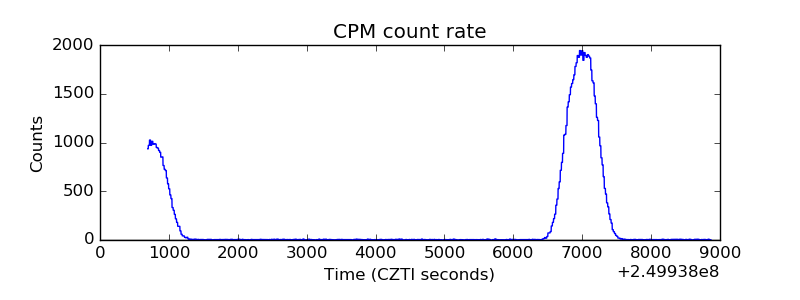 |
| CZT Counter | 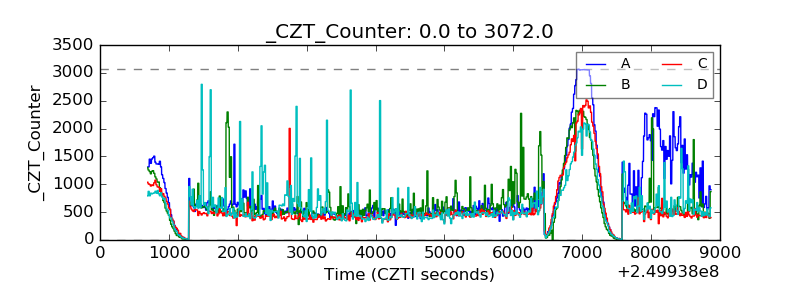 |
| +2.5 Volts monitor | 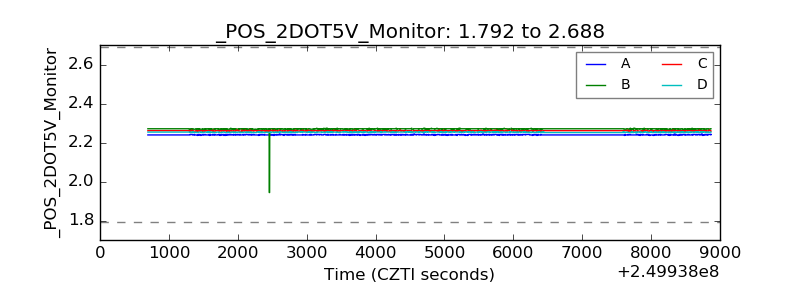 |
| +5 Volts monitor | 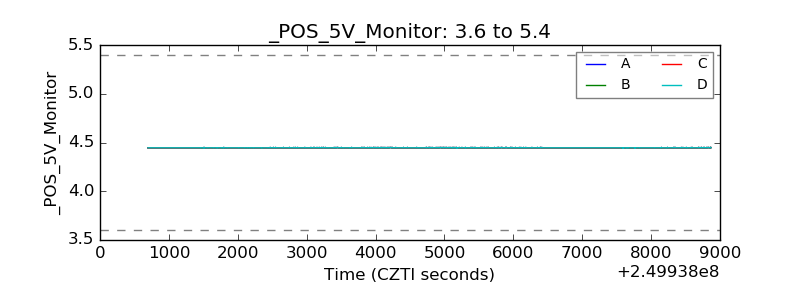 |
| _ROLL_ROT |  |
| _Roll_DEC | 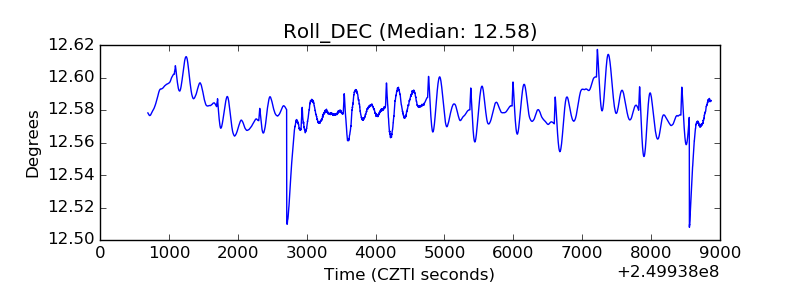 |
| _Roll_RA | 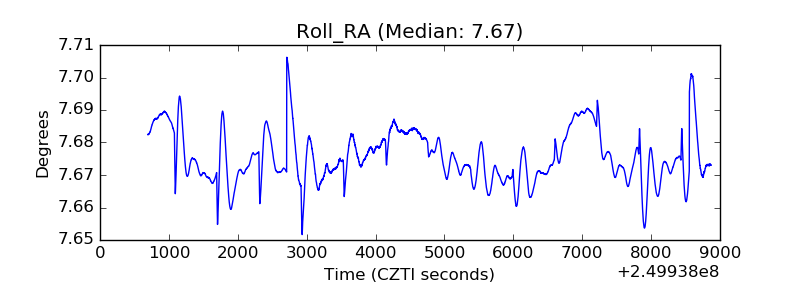 |
| Veto Counter |  |