| Param | Original file | Final file |
|---|---|---|
| Filename | modeM0/AS1G08_058T09_9000001744_11794cztM0_level2.evt | modeM0/AS1G08_058T09_9000001744_11794cztM0_level2_quad_clean.evt |
| Size (bytes) | 529,185,600 | 85,610,880 |
| Size | 504.7 MB | 81.6 MB |
| Events in quadrant A | 4,948,659 | 535,086 |
| Events in quadrant B | 3,765,576 | 555,619 |
| Events in quadrant C | 2,947,876 | 553,637 |
| Events in quadrant D | 3,937,527 | 508,493 |
| Mode M9 | |||
|---|---|---|---|
| Quadrant | BADHDUFLAG | Total packets | Discarded packets |
| A | 0 | 19 | 0 |
| B | 0 | 19 | 0 |
| C | 0 | 19 | 0 |
| D | 0 | 20 | 0 |
| Mode M0 | |||
|---|---|---|---|
| Quadrant | BADHDUFLAG | Total packets | Discarded packets |
| A | 0 | 18975 | 3 |
| B | 0 | 15097 | 2 |
| C | 0 | 12844 | 2 |
| D | 0 | 16032 | 2 |
| Mode SS | |||
|---|---|---|---|
| Quadrant | BADHDUFLAG | Total packets | Discarded packets |
| A | 0 | 128 | 0 |
| B | 0 | 128 | 0 |
| C | 0 | 128 | 0 |
| D | 0 | 128 | 0 |
| Quadrant | Total seconds | Saturated seconds | Saturation percentage |
|---|---|---|---|
| A | 6296 | 219 | 3.478399% |
| B | 6296 | 178 | 2.827192% |
| C | 6296 | 5 | 0.079416% |
| D | 6296 | 237 | 3.764295% |
Noise dominated data is calculated using 1-second bins in cleaned event files. If a bin has >2000 counts, and if more than 50% of those come from <1% of pixels, then it is considered to be noise-dominated and hence unusable.
| Quadrant | # 1 sec bins | Bins with >0 counts | Bins with >2000 counts | High rate bins dominated by noise | Noise dominated (total time) | Noise dominated (detector-on time) | Marked lightcurve |
|---|---|---|---|---|---|---|---|
| A | 7542 | 6298 | 137 | 137 | 1.82% | 2.18% | 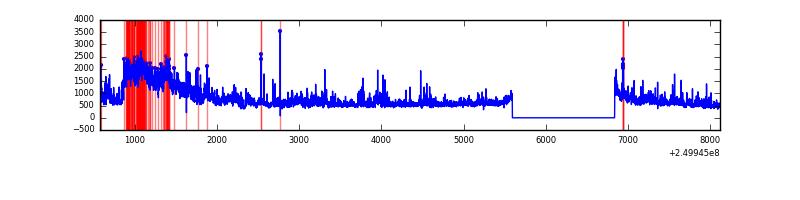 |
| B | 7542 | 6298 | 71 | 71 | 0.94% | 1.13% | 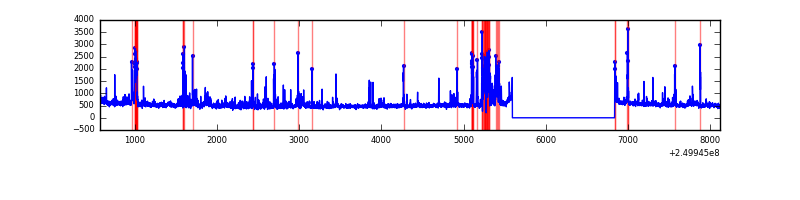 |
| C | 7542 | 6298 | 0 | 0 | 0.00% | 0.00% | 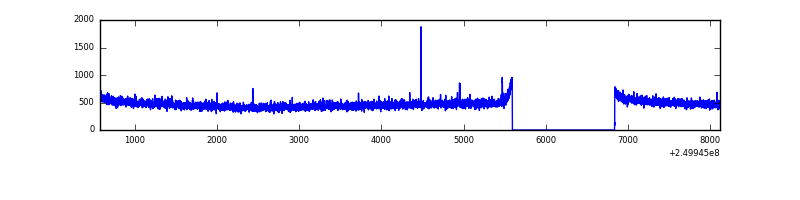 |
| D | 7542 | 6298 | 201 | 201 | 2.67% | 3.19% | 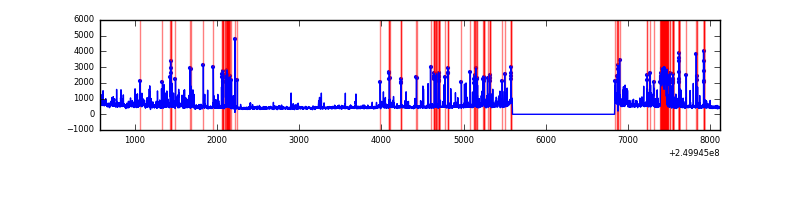 |
Top three noisy pixels from each quadrant. If the there are fewer than three noisy pixels in the level2.evt file, extra rows are filled as -1
| Pixel properties | Quadrant properties | ||||||
|---|---|---|---|---|---|---|---|
| Quadrant | DetID | PixID | Counts | Sigma | Mean | Median | Sigma |
| A | 8 | 15 | 1651104 | 10734.59 | 759 | 744 | 153.7 |
| A | 1 | 162 | 144252 | 933.43 | 759 | 744 | 153.7 |
| A | 1 | 178 | 78084 | 503.05 | 759 | 744 | 153.7 |
| B | 4 | 239 | 365158 | 2507.05 | 771 | 752 | 145.4 |
| B | 3 | 64 | 177846 | 1218.38 | 771 | 752 | 145.4 |
| B | 10 | 16 | 128845 | 881.26 | 771 | 752 | 145.4 |
| C | 13 | 61 | 5456 | 26.88 | 753 | 758 | 174.8 |
| C | 14 | 234 | 4332 | 20.45 | 753 | 758 | 174.8 |
| C | 8 | 128 | 4125 | 19.27 | 753 | 758 | 174.8 |
| D | 1 | 52 | 706269 | 3992.86 | 733 | 712 | 176.7 |
| D | 9 | 85 | 229713 | 1295.95 | 733 | 712 | 176.7 |
| D | 13 | 249 | 101181 | 568.57 | 733 | 712 | 176.7 |
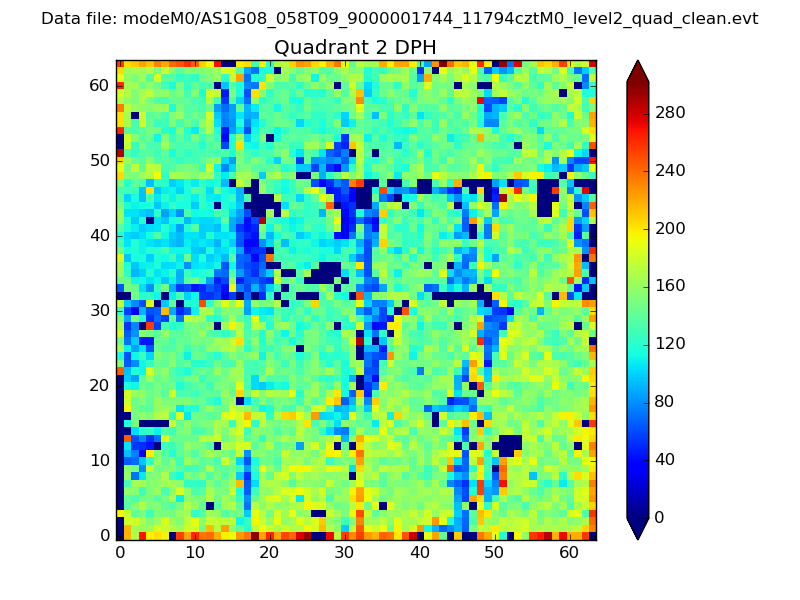
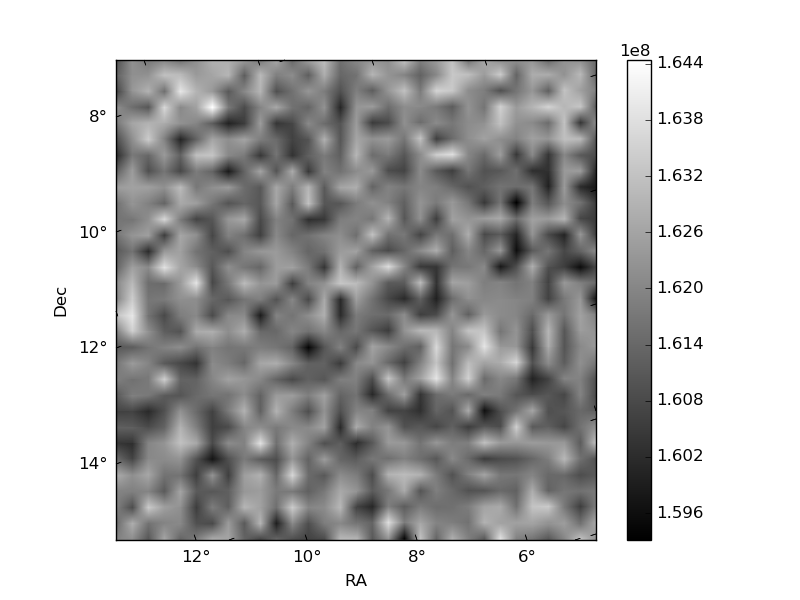
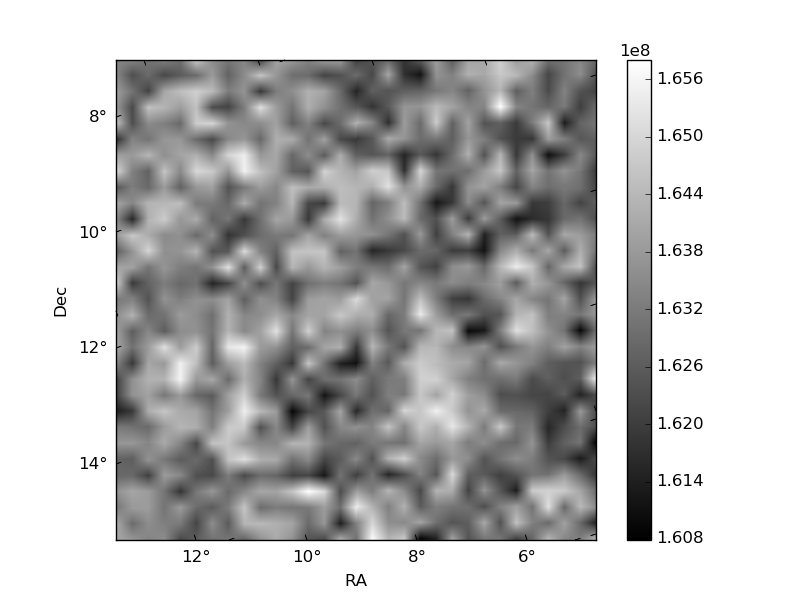
Histogram calculated using DETX and DETY for each event in the final _common_clean file
| Quadrant A | 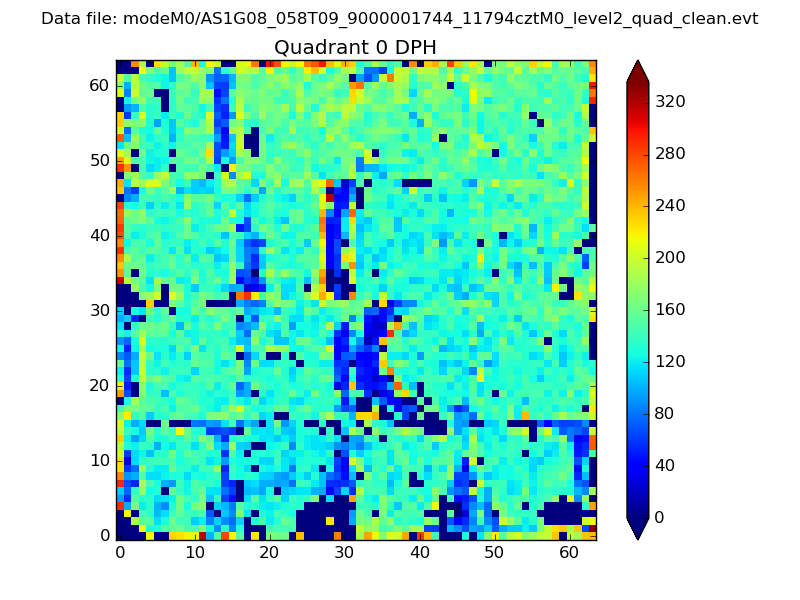 |
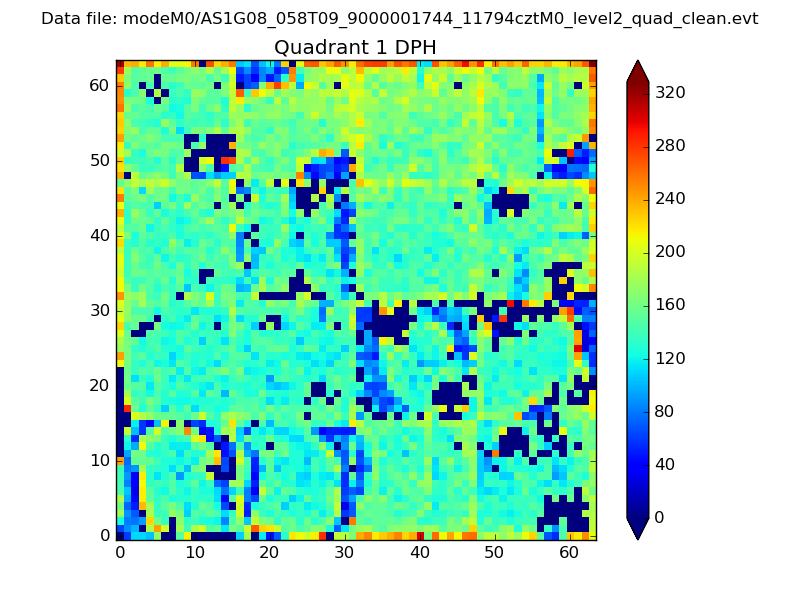 |
Quadrant B |
|---|---|---|---|
| Quadrant D | 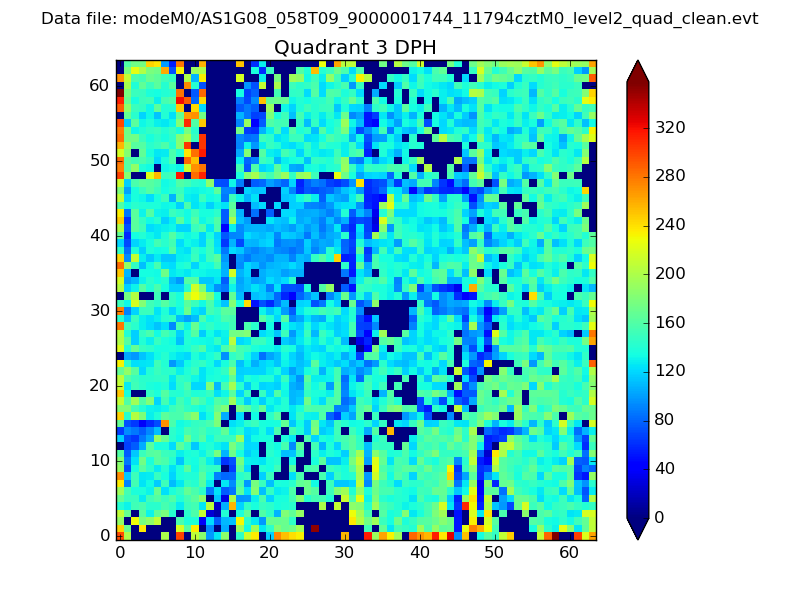 |
 |
Quadrant C |
| Plot type | Count rate plots | Images |
|---|---|---|
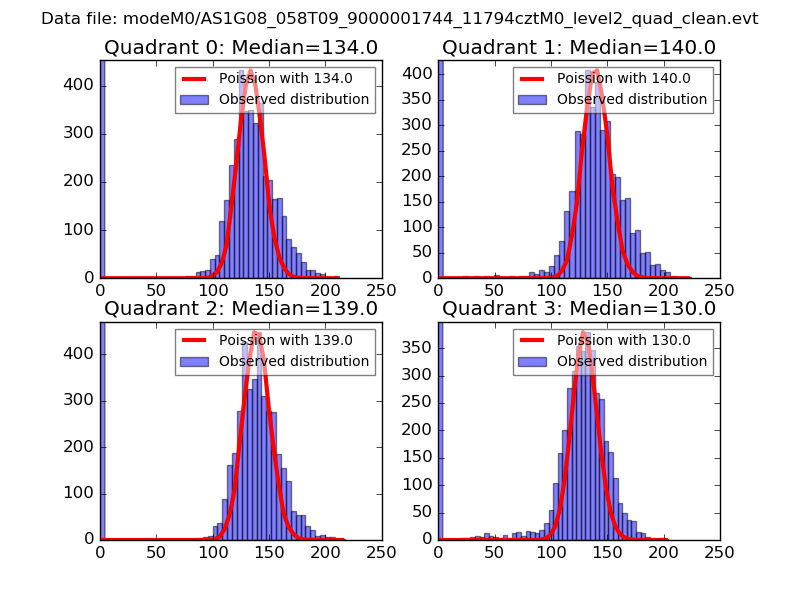
| Comparison with Poisson distribution Blue bars denote a histogram of data divided into 1 sec bins. Red curve is a Poisson curve with rate = median count rate of data. |
 |
 |
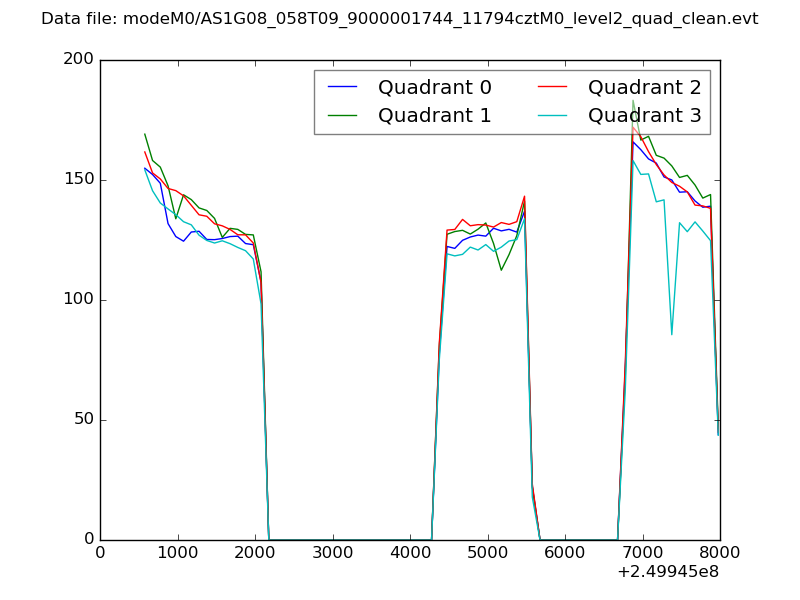
| Quadrant-wise count rates Data is divided into 100 sec bins |
 |
|
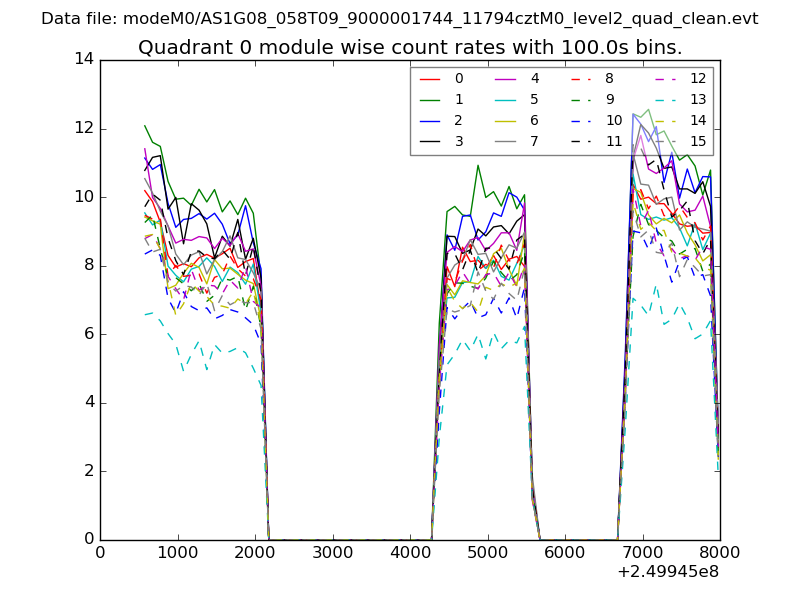
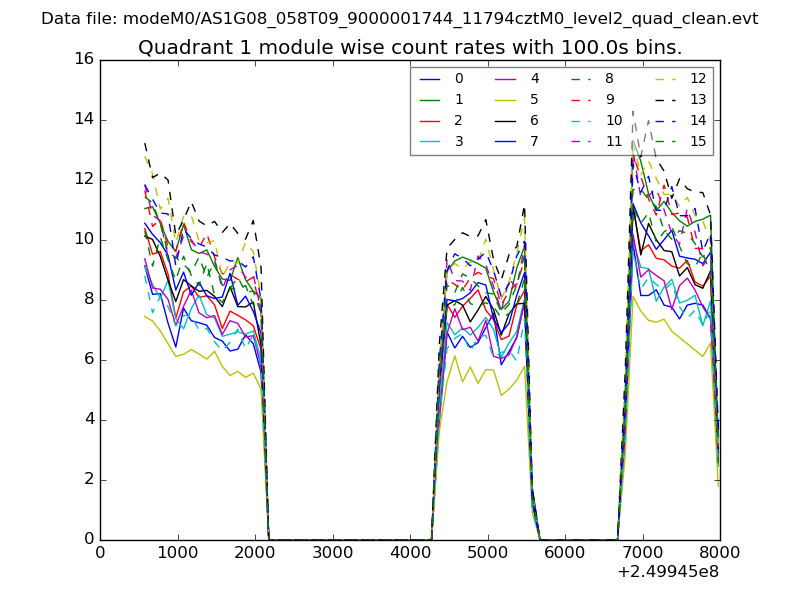
| Module-wise count rates for Quadrant A Data is divided into 100 sec bins |
 |
 |
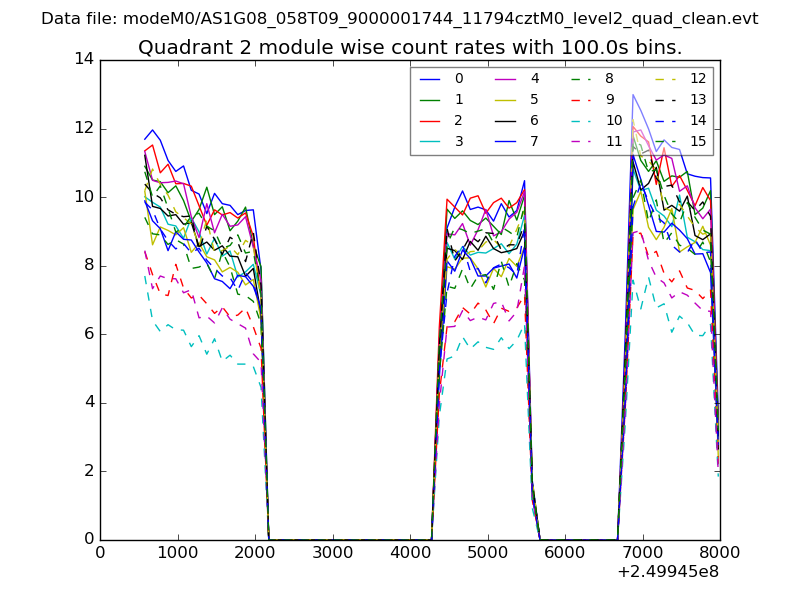
| Module-wise count rates for Quadrant B Data is divided into 100 sec bins |
 |
 |
| Module-wise count rates for Quadrant C Data is divided into 100 sec bins |
 |
 |
| Module-wise count rates for Quadrant D Data is divided into 100 sec bins |
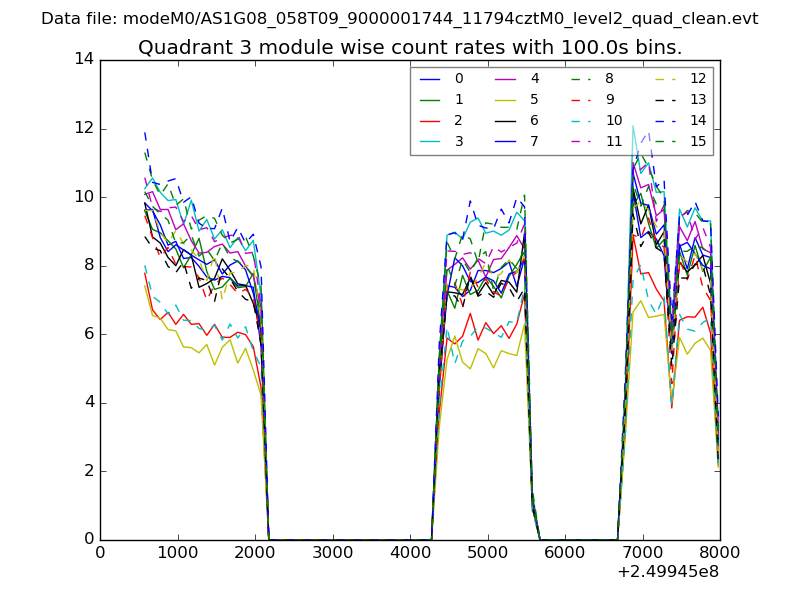 |
 |
| Parameter | Plot |
|---|---|
| CZT HV Monitor | 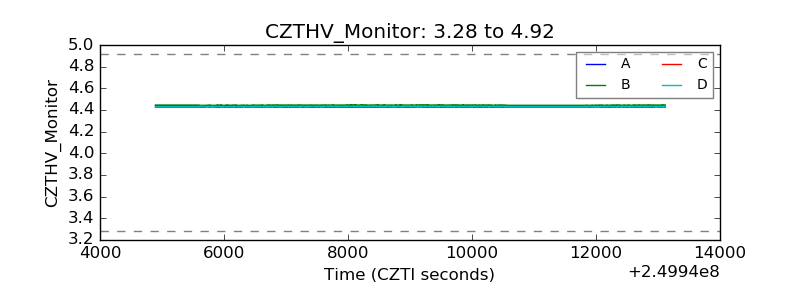 |
| D_VDD | 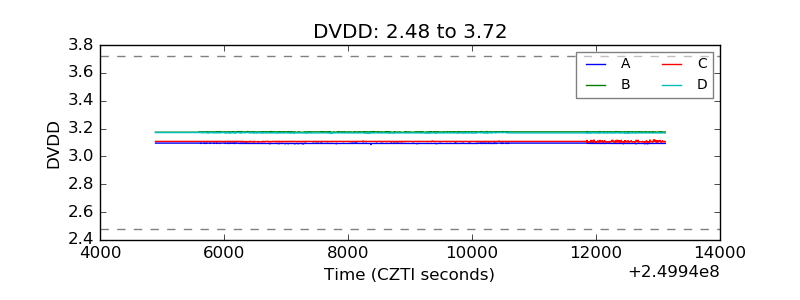 |
| Temperature 1 | 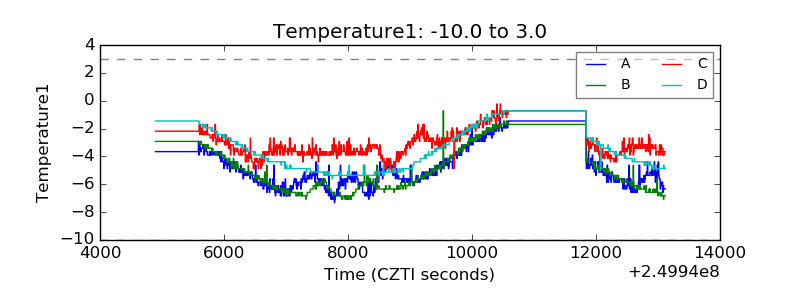 |
| Veto HV Monitor | 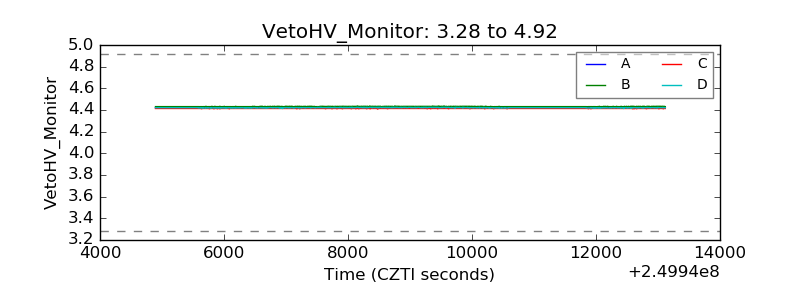 |
| Veto LLD | 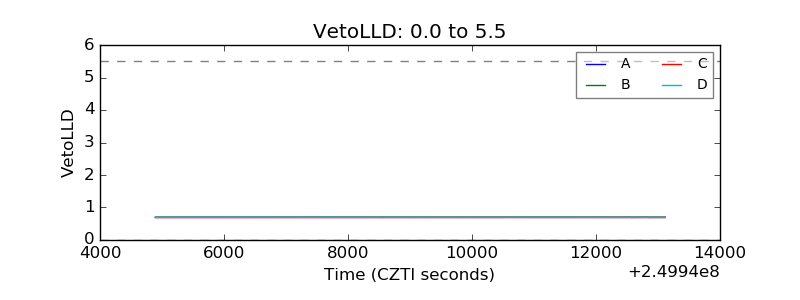 |
| Alpha Counter | 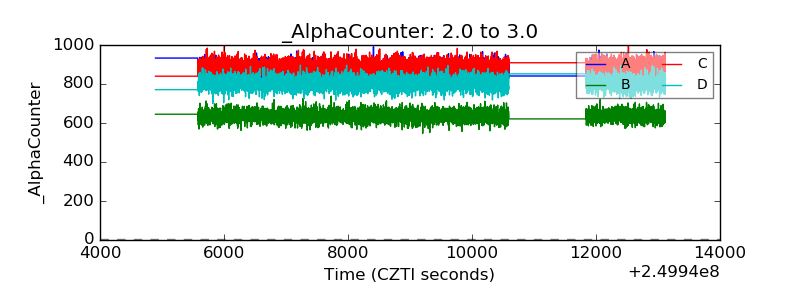 |
| _CPM_Rate | 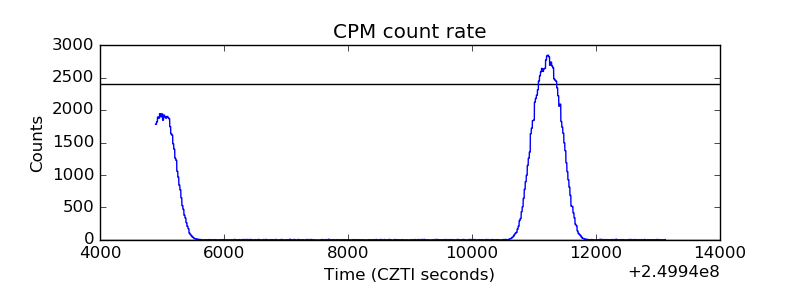 |
| CZT Counter | 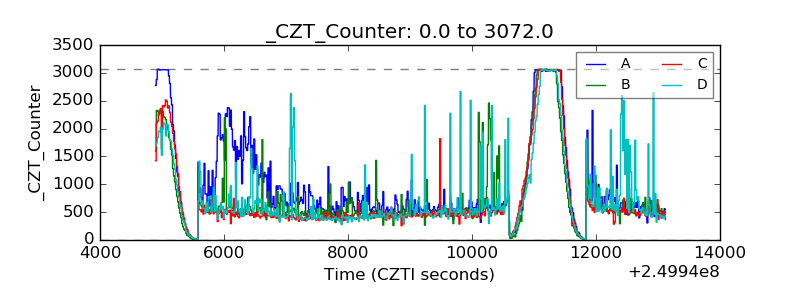 |
| +2.5 Volts monitor |  |
| +5 Volts monitor |  |
| _ROLL_ROT | 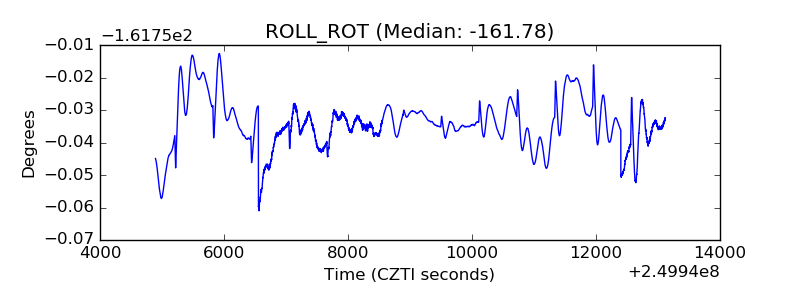 |
| _Roll_DEC | 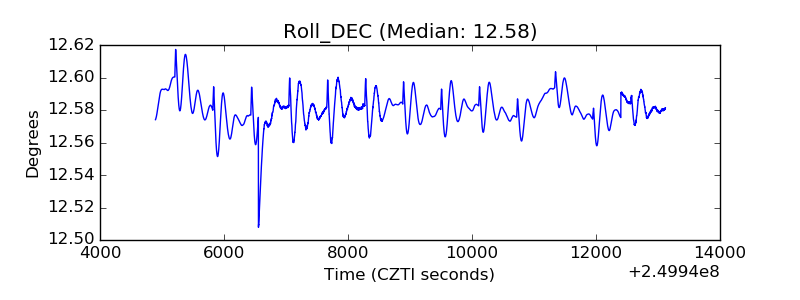 |
| _Roll_RA | 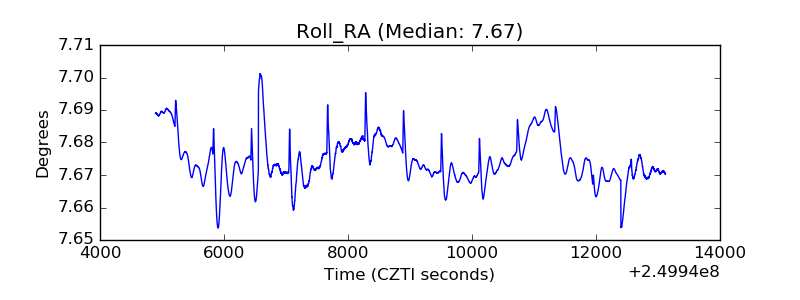 |
| Veto Counter | 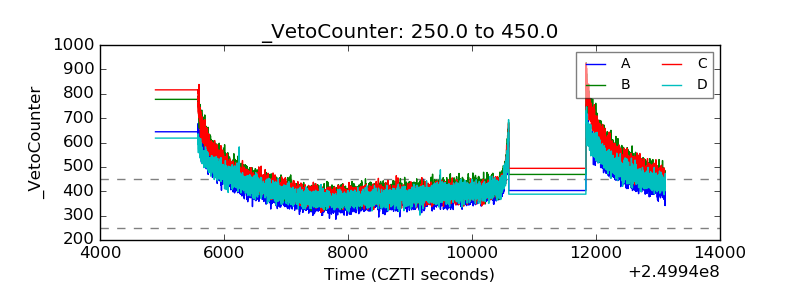 |