| Param | Original file | Final file |
|---|---|---|
| Filename | modeM0/AS1G08_058T09_9000001744_11795cztM0_level2.evt | modeM0/AS1G08_058T09_9000001744_11795cztM0_level2_quad_clean.evt |
| Size (bytes) | 494,674,560 | 79,626,240 |
| Size | 471.8 MB | 75.9 MB |
| Events in quadrant A | 3,627,366 | 498,508 |
| Events in quadrant B | 4,082,997 | 509,679 |
| Events in quadrant C | 2,993,571 | 506,073 |
| Events in quadrant D | 3,857,864 | 465,109 |
| Mode M9 | |||
|---|---|---|---|
| Quadrant | BADHDUFLAG | Total packets | Discarded packets |
| A | 0 | 23 | 0 |
| B | 0 | 23 | 0 |
| C | 0 | 23 | 0 |
| D | 0 | 24 | 0 |
| Mode M0 | |||
|---|---|---|---|
| Quadrant | BADHDUFLAG | Total packets | Discarded packets |
| A | 0 | 14686 | 3 |
| B | 0 | 16140 | 2 |
| C | 0 | 12696 | 2 |
| D | 0 | 15592 | 2 |
| Mode SS | |||
|---|---|---|---|
| Quadrant | BADHDUFLAG | Total packets | Discarded packets |
| A | 0 | 126 | 0 |
| B | 0 | 126 | 0 |
| C | 0 | 126 | 0 |
| D | 0 | 126 | 0 |
| Quadrant | Total seconds | Saturated seconds | Saturation percentage |
|---|---|---|---|
| A | 6183 | 55 | 0.889536% |
| B | 6183 | 158 | 2.555394% |
| C | 6183 | 9 | 0.145560% |
| D | 6183 | 202 | 3.267022% |
Noise dominated data is calculated using 1-second bins in cleaned event files. If a bin has >2000 counts, and if more than 50% of those come from <1% of pixels, then it is considered to be noise-dominated and hence unusable.
| Quadrant | # 1 sec bins | Bins with >0 counts | Bins with >2000 counts | High rate bins dominated by noise | Noise dominated (total time) | Noise dominated (detector-on time) | Marked lightcurve |
|---|---|---|---|---|---|---|---|
| A | 7519 | 6184 | 6 | 6 | 0.08% | 0.10% | 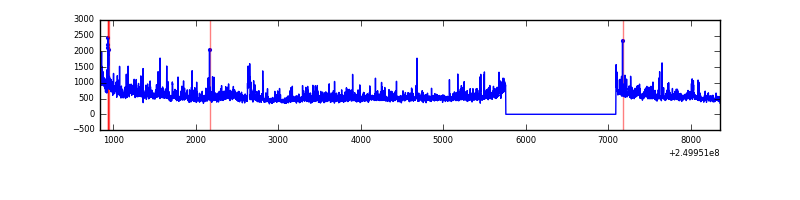 |
| B | 7519 | 6184 | 71 | 71 | 0.94% | 1.15% | 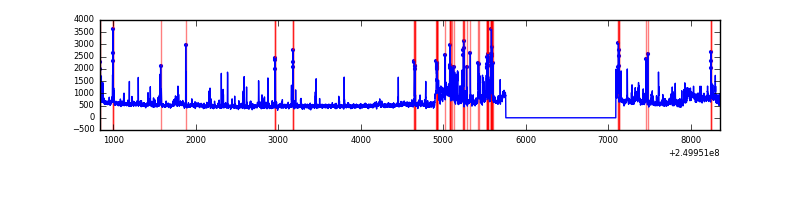 |
| C | 7519 | 6184 | 0 | 0 | 0.00% | 0.00% | 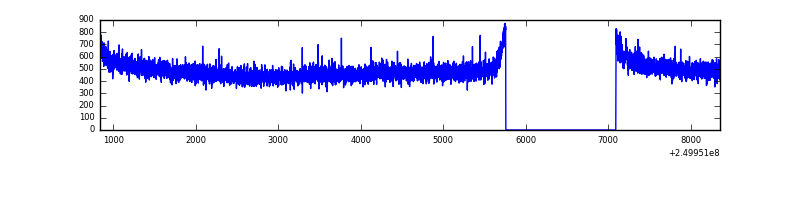 |
| D | 7519 | 6184 | 170 | 170 | 2.26% | 2.75% | 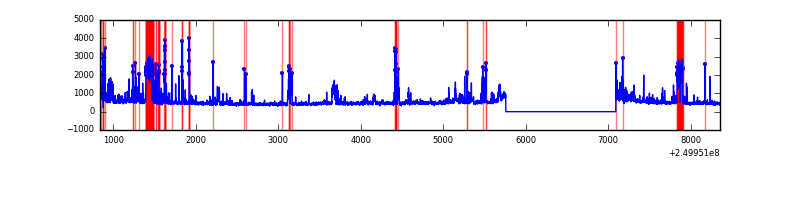 |
Top three noisy pixels from each quadrant. If the there are fewer than three noisy pixels in the level2.evt file, extra rows are filled as -1
| Pixel properties | Quadrant properties | ||||||
|---|---|---|---|---|---|---|---|
| Quadrant | DetID | PixID | Counts | Sigma | Mean | Median | Sigma |
| A | 8 | 15 | 291865 | 1845.34 | 779 | 764 | 157.7 |
| A | 1 | 162 | 132109 | 832.62 | 779 | 764 | 157.7 |
| A | 1 | 178 | 71684 | 449.57 | 779 | 764 | 157.7 |
| B | 4 | 239 | 425529 | 2883.91 | 785 | 767 | 147.3 |
| B | 10 | 16 | 385861 | 2614.58 | 785 | 767 | 147.3 |
| B | 3 | 64 | 88443 | 595.27 | 785 | 767 | 147.3 |
| C | 8 | 128 | 6947 | 35.0 | 764 | 772 | 176.4 |
| C | 13 | 61 | 5534 | 26.99 | 764 | 772 | 176.4 |
| C | 8 | 112 | 3849 | 17.44 | 764 | 772 | 176.4 |
| D | 1 | 52 | 579692 | 3230.88 | 745 | 728 | 179.2 |
| D | 9 | 85 | 227112 | 1263.32 | 745 | 728 | 179.2 |
| D | 13 | 249 | 78593 | 434.52 | 745 | 728 | 179.2 |
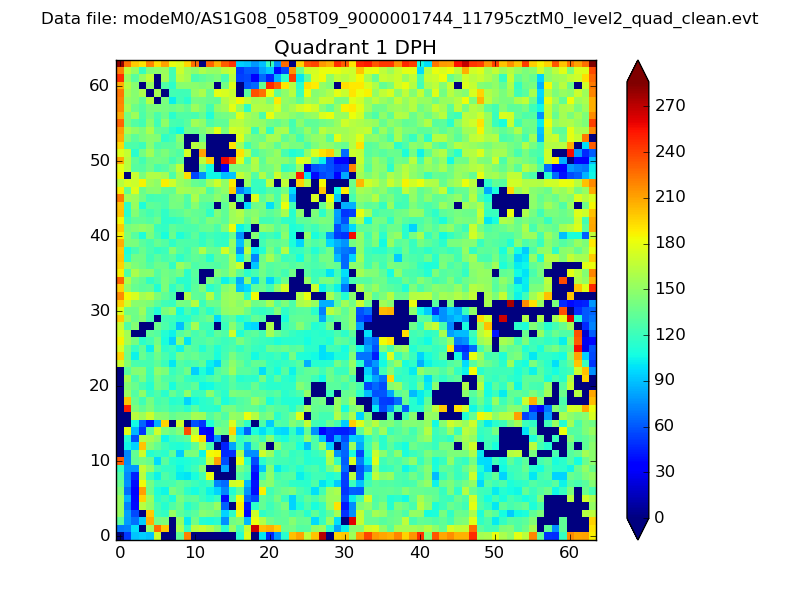
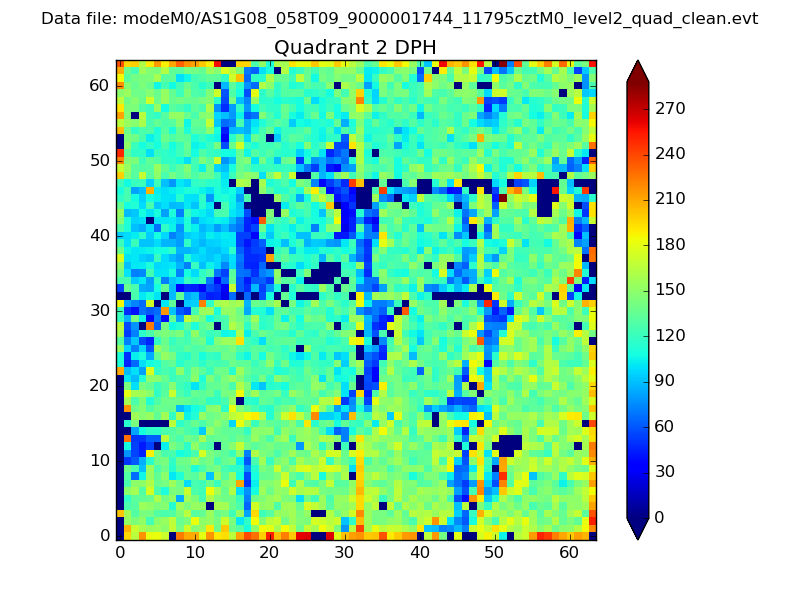
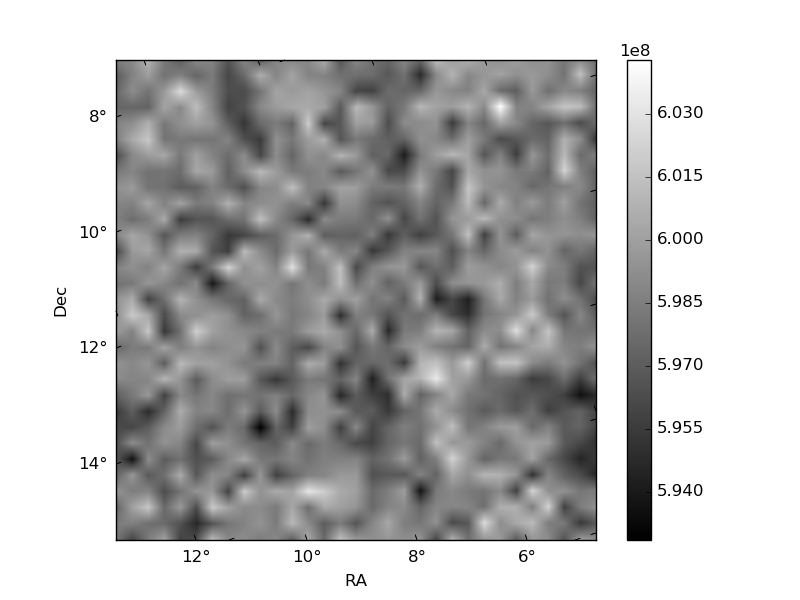
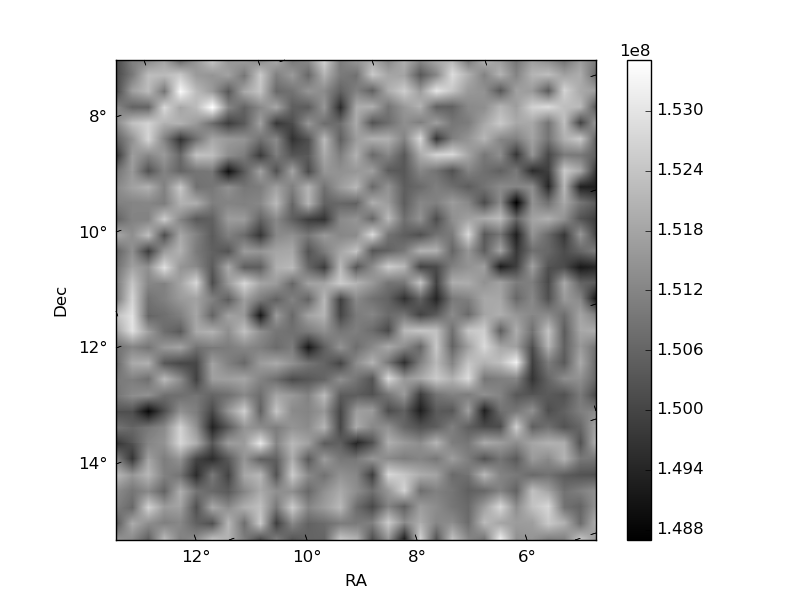
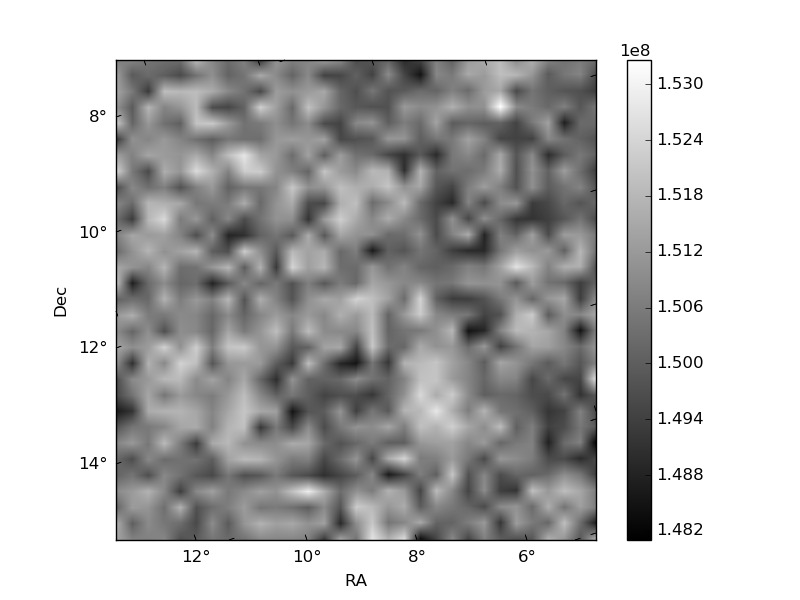
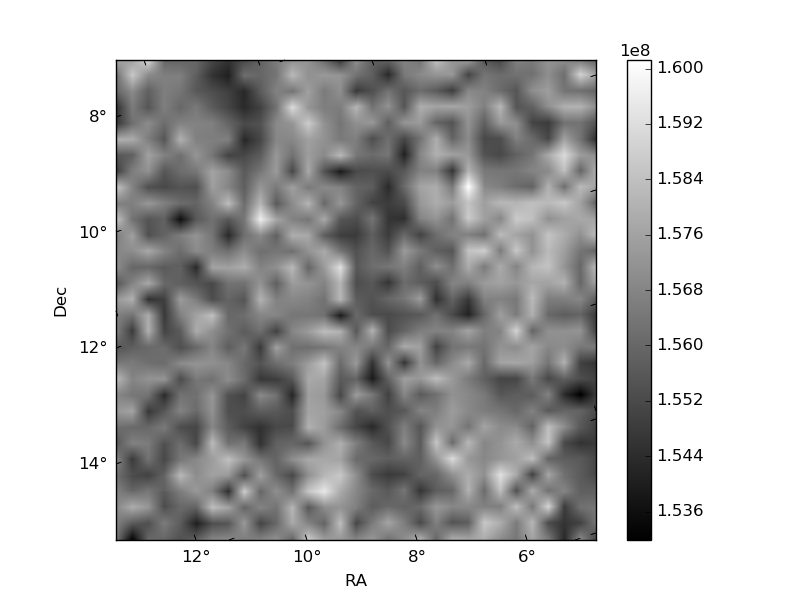
Histogram calculated using DETX and DETY for each event in the final _common_clean file
| Quadrant A |  |
 |
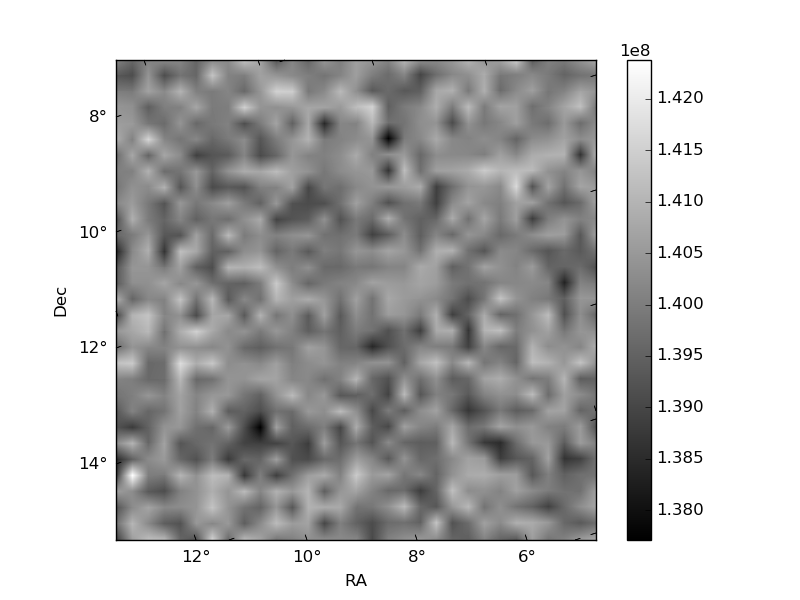
Quadrant B |
|---|---|---|---|
| Quadrant D | 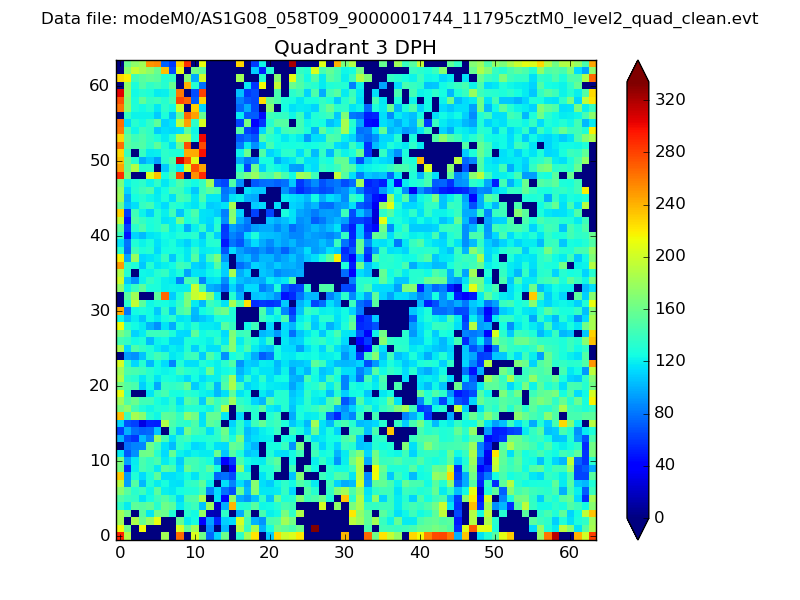 |
 |
Quadrant C |
| Plot type | Count rate plots | Images |
|---|---|---|
| Comparison with Poisson distribution Blue bars denote a histogram of data divided into 1 sec bins. Red curve is a Poisson curve with rate = median count rate of data. |
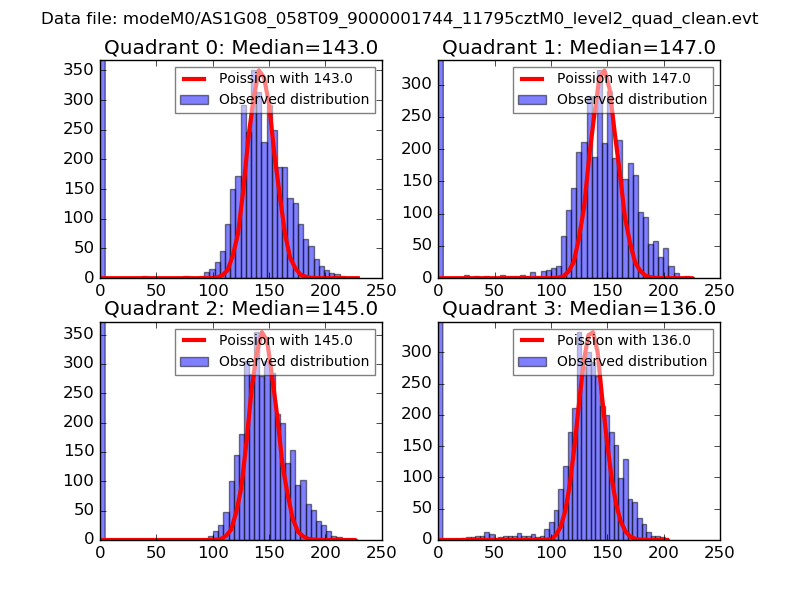 |
 |
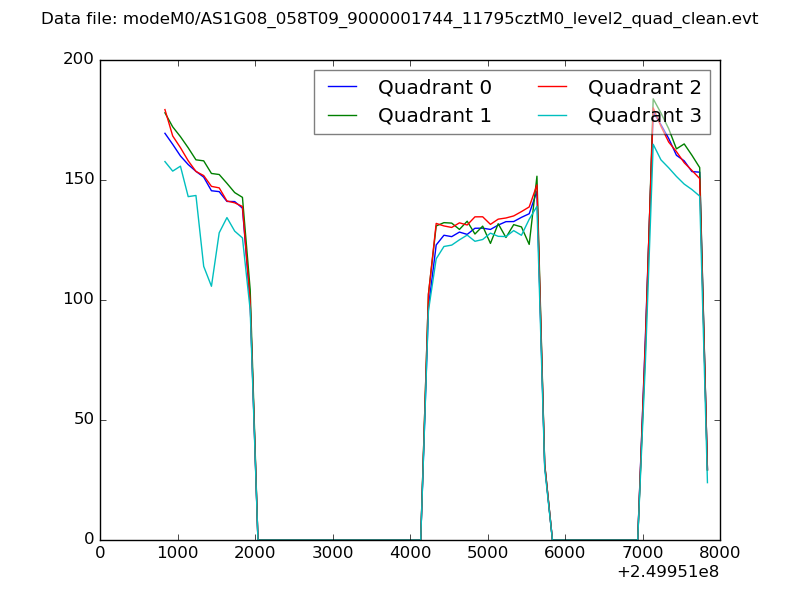
| Quadrant-wise count rates Data is divided into 100 sec bins |
 |
|
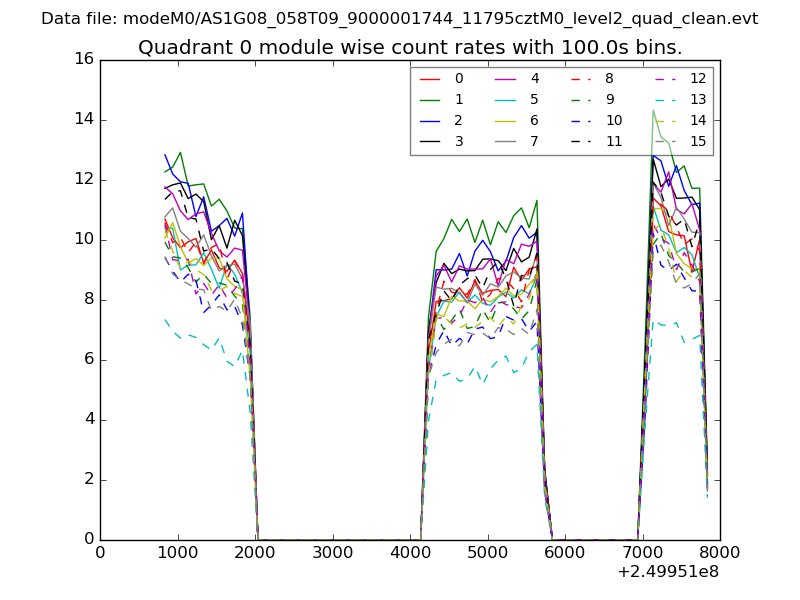
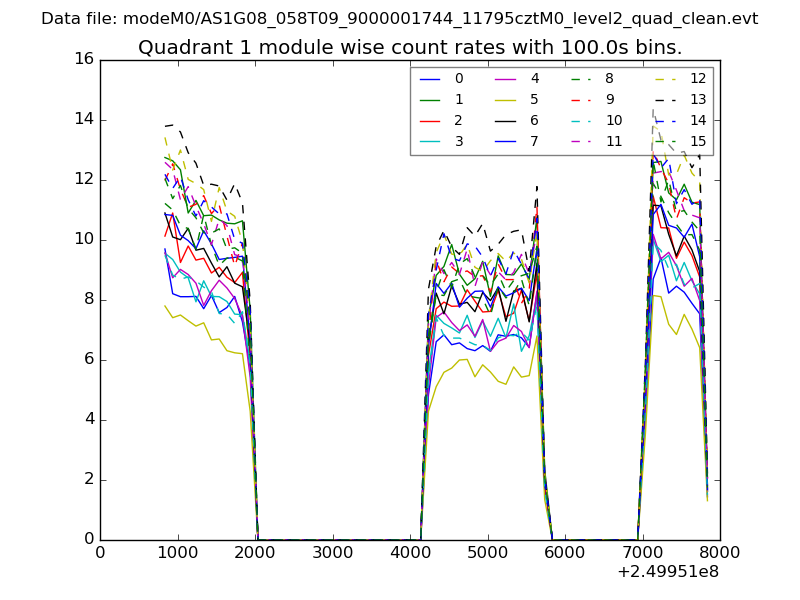
| Module-wise count rates for Quadrant A Data is divided into 100 sec bins |
 |
 |
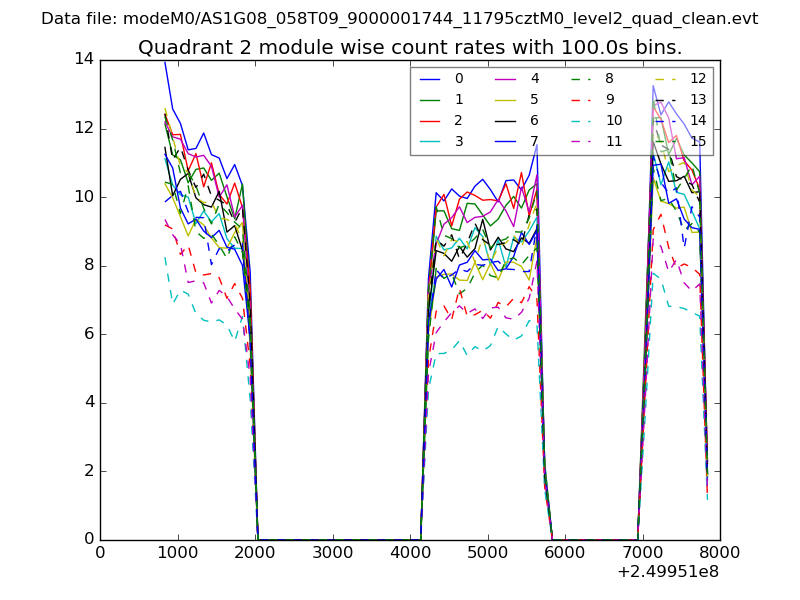
| Module-wise count rates for Quadrant B Data is divided into 100 sec bins |
 |
 |
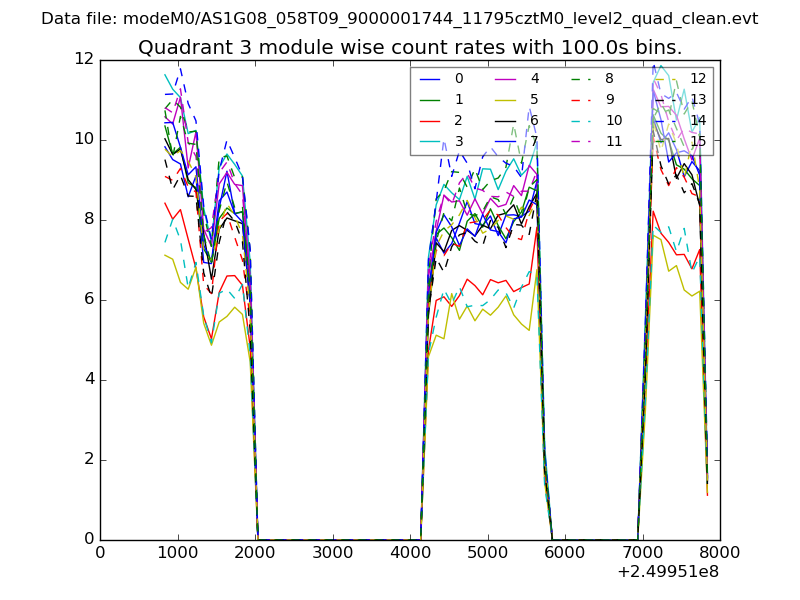
| Module-wise count rates for Quadrant C Data is divided into 100 sec bins |
 |
 |
| Module-wise count rates for Quadrant D Data is divided into 100 sec bins |
 |
 |
| Parameter | Plot |
|---|---|
| CZT HV Monitor | 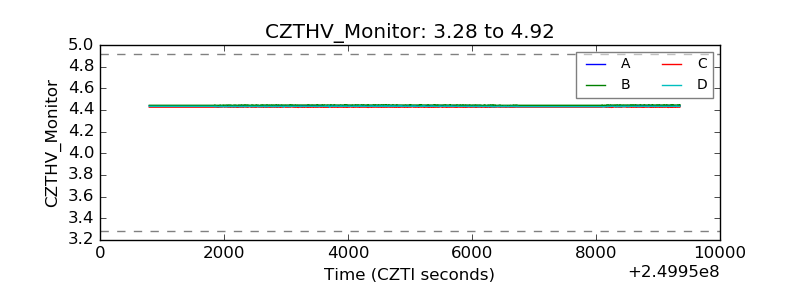 |
| D_VDD |  |
| Temperature 1 | 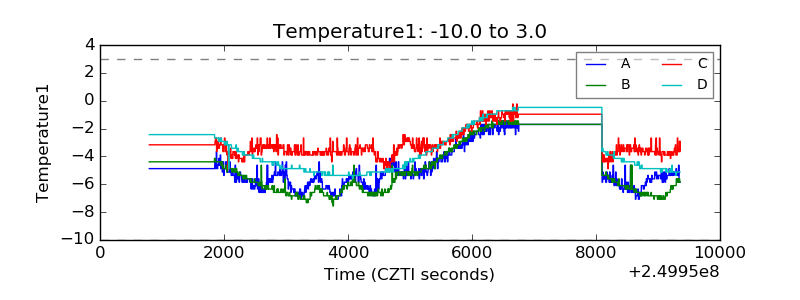 |
| Veto HV Monitor | 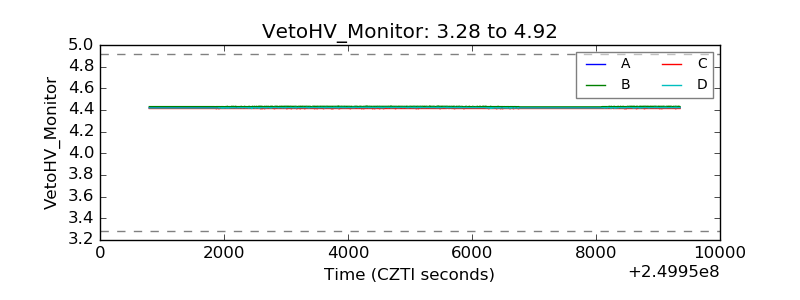 |
| Veto LLD | 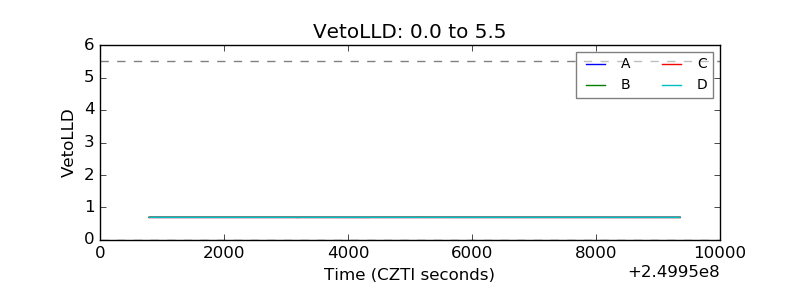 |
| Alpha Counter | 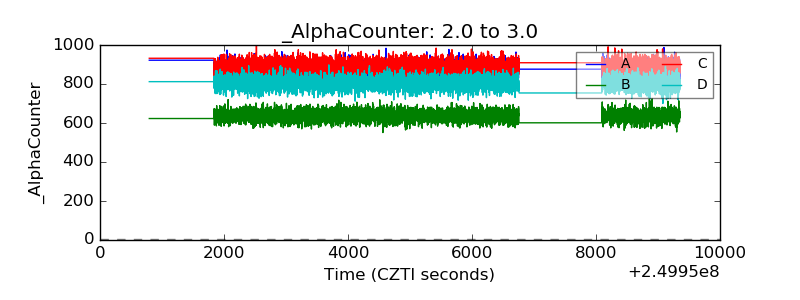 |
| _CPM_Rate | 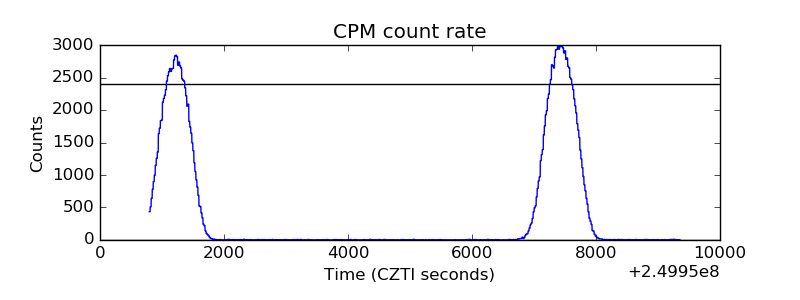 |
| CZT Counter | 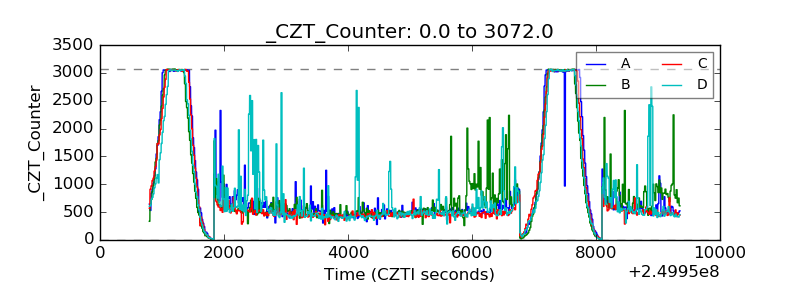 |
| +2.5 Volts monitor |  |
| +5 Volts monitor | 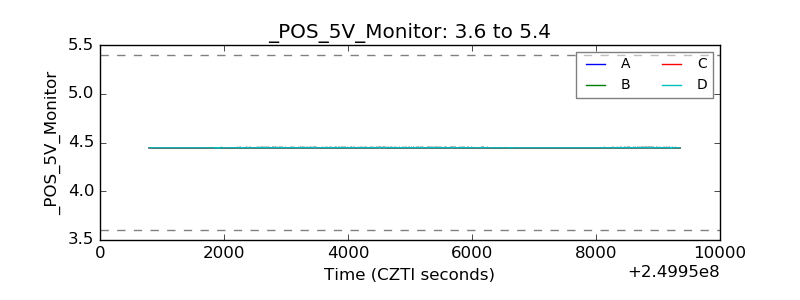 |
| _ROLL_ROT | 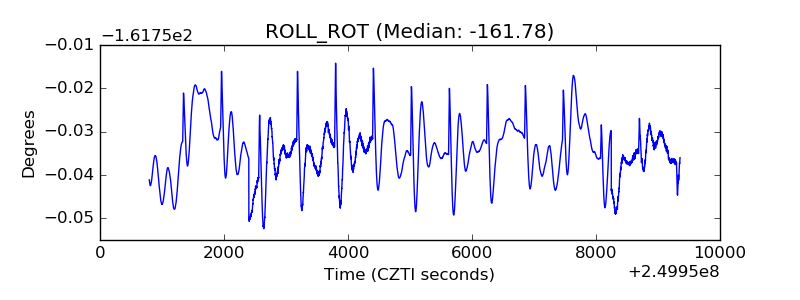 |
| _Roll_DEC | 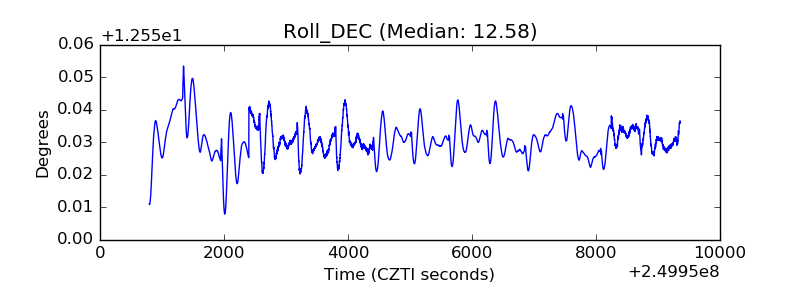 |
| _Roll_RA | 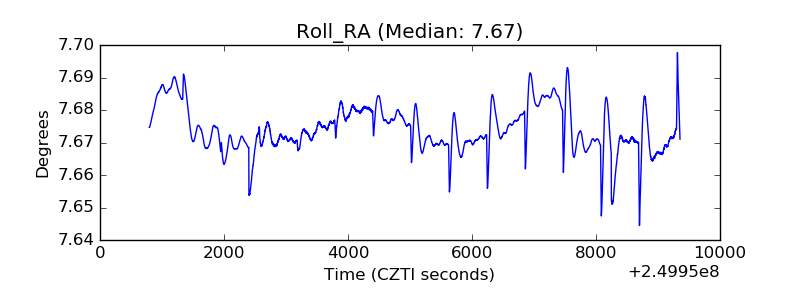 |
| Veto Counter | 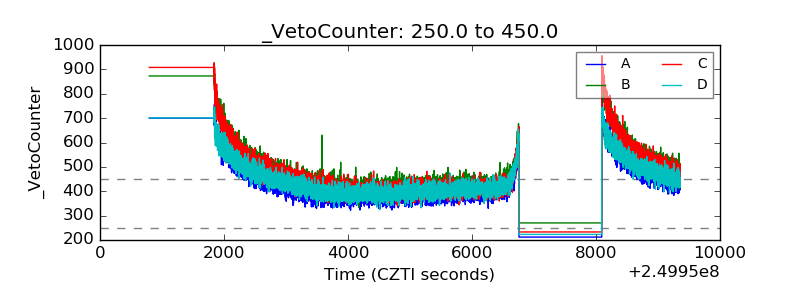 |