| Param | Original file | Final file |
|---|---|---|
| Filename | modeM0/AS1G08_058T09_9000001744_11796cztM0_level2.evt | modeM0/AS1G08_058T09_9000001744_11796cztM0_level2_quad_clean.evt |
| Size (bytes) | 508,950,720 | 70,084,800 |
| Size | 485.4 MB | 66.8 MB |
| Events in quadrant A | 3,637,360 | 422,290 |
| Events in quadrant B | 4,880,854 | 429,820 |
| Events in quadrant C | 3,078,561 | 428,765 |
| Events in quadrant D | 3,390,853 | 402,652 |
| Mode M9 | |||
|---|---|---|---|
| Quadrant | BADHDUFLAG | Total packets | Discarded packets |
| A | 0 | 14 | 0 |
| B | 0 | 14 | 0 |
| C | 0 | 14 | 0 |
| D | 0 | 14 | 0 |
| Mode M0 | |||
|---|---|---|---|
| Quadrant | BADHDUFLAG | Total packets | Discarded packets |
| A | 0 | 14764 | 2 |
| B | 0 | 18774 | 1 |
| C | 0 | 12903 | 1 |
| D | 0 | 14225 | 1 |
| Mode SS | |||
|---|---|---|---|
| Quadrant | BADHDUFLAG | Total packets | Discarded packets |
| A | 0 | 128 | 0 |
| B | 0 | 128 | 0 |
| C | 0 | 128 | 0 |
| D | 0 | 128 | 0 |
| Quadrant | Total seconds | Saturated seconds | Saturation percentage |
|---|---|---|---|
| A | 6282 | 67 | 1.066539% |
| B | 6282 | 155 | 2.467367% |
| C | 6282 | 21 | 0.334288% |
| D | 6282 | 80 | 1.273480% |
Noise dominated data is calculated using 1-second bins in cleaned event files. If a bin has >2000 counts, and if more than 50% of those come from <1% of pixels, then it is considered to be noise-dominated and hence unusable.
| Quadrant | # 1 sec bins | Bins with >0 counts | Bins with >2000 counts | High rate bins dominated by noise | Noise dominated (total time) | Noise dominated (detector-on time) | Marked lightcurve |
|---|---|---|---|---|---|---|---|
| A | 7653 | 6284 | 2 | 2 | 0.03% | 0.03% | 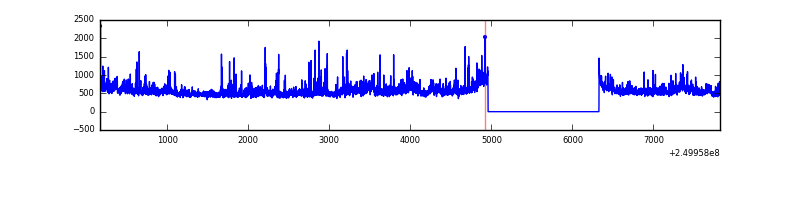 |
| B | 7653 | 6284 | 73 | 73 | 0.95% | 1.16% | 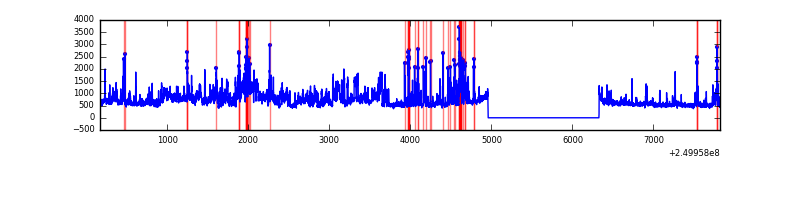 |
| C | 7653 | 6284 | 0 | 0 | 0.00% | 0.00% | 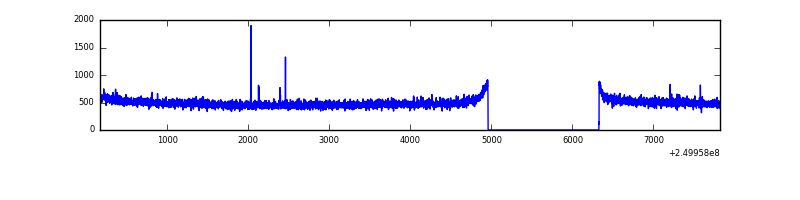 |
| D | 7653 | 6284 | 71 | 71 | 0.93% | 1.13% | 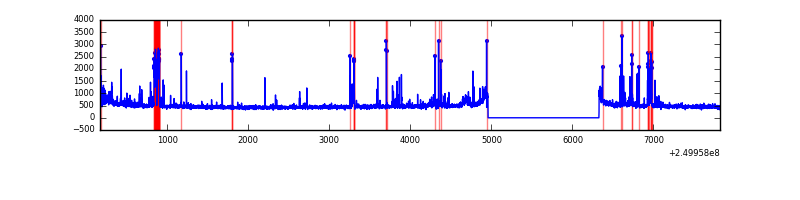 |
Top three noisy pixels from each quadrant. If the there are fewer than three noisy pixels in the level2.evt file, extra rows are filled as -1
| Pixel properties | Quadrant properties | ||||||
|---|---|---|---|---|---|---|---|
| Quadrant | DetID | PixID | Counts | Sigma | Mean | Median | Sigma |
| A | 8 | 15 | 289948 | 1799.65 | 802 | 788 | 160.7 |
| A | 1 | 162 | 107557 | 664.5 | 802 | 788 | 160.7 |
| A | 1 | 178 | 55211 | 338.71 | 802 | 788 | 160.7 |
| B | 10 | 16 | 1102035 | 7321.91 | 806 | 791 | 150.4 |
| B | 4 | 239 | 430037 | 2853.96 | 806 | 791 | 150.4 |
| B | 3 | 64 | 52254 | 342.17 | 806 | 791 | 150.4 |
| C | 7 | 238 | 9876 | 49.78 | 787 | 795 | 182.4 |
| C | 13 | 61 | 5758 | 27.2 | 787 | 795 | 182.4 |
| C | 14 | 234 | 2653 | 10.18 | 787 | 795 | 182.4 |
| D | 1 | 52 | 181147 | 974.64 | 772 | 753 | 185.1 |
| D | 13 | 249 | 82622 | 442.32 | 772 | 753 | 185.1 |
| D | 13 | 122 | 70761 | 378.24 | 772 | 753 | 185.1 |
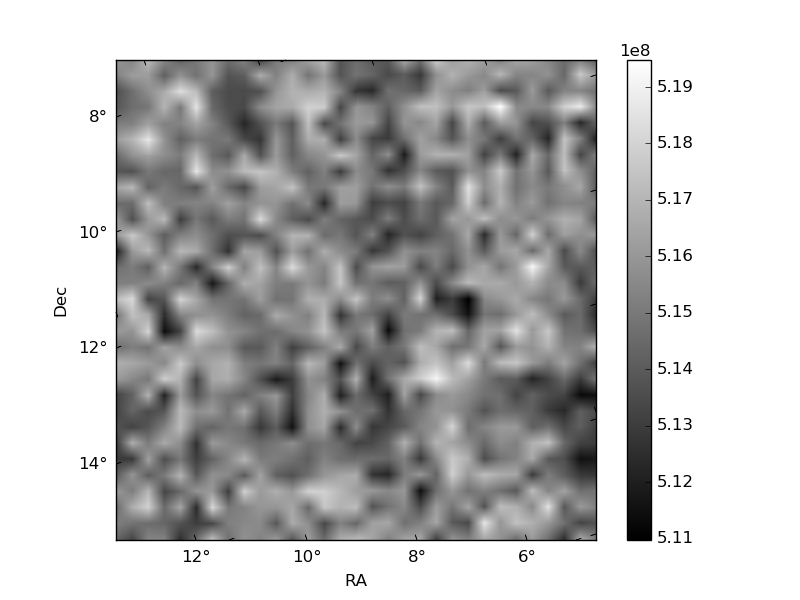
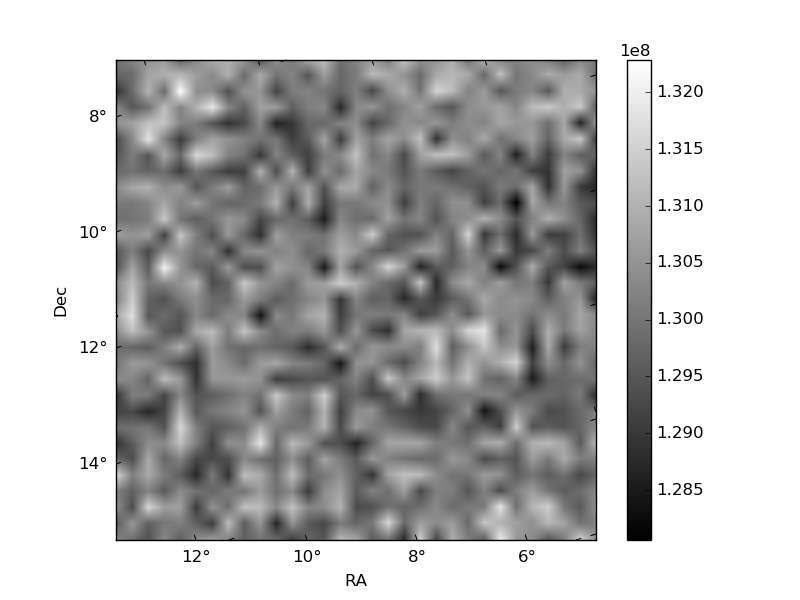
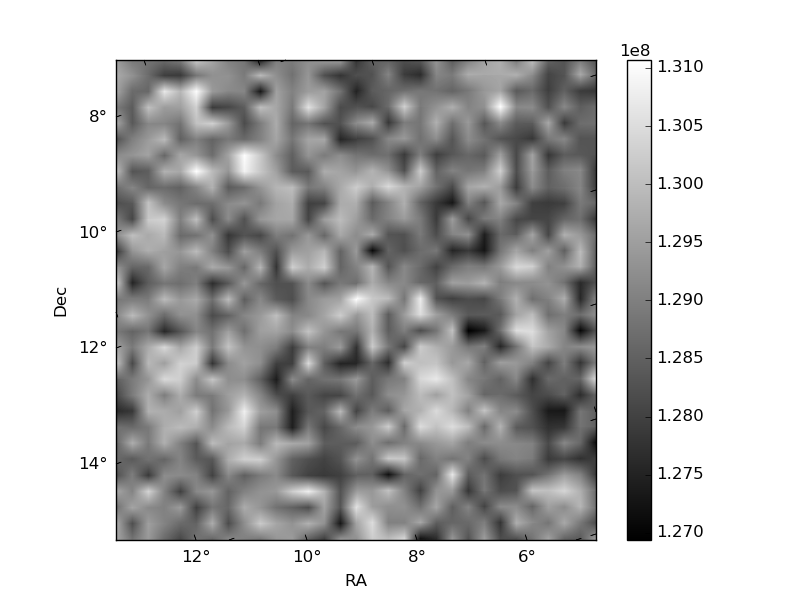
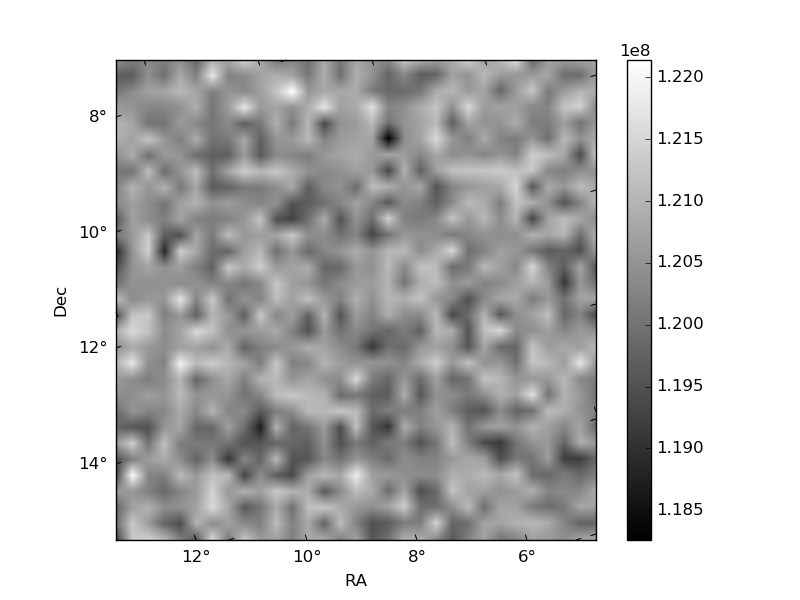
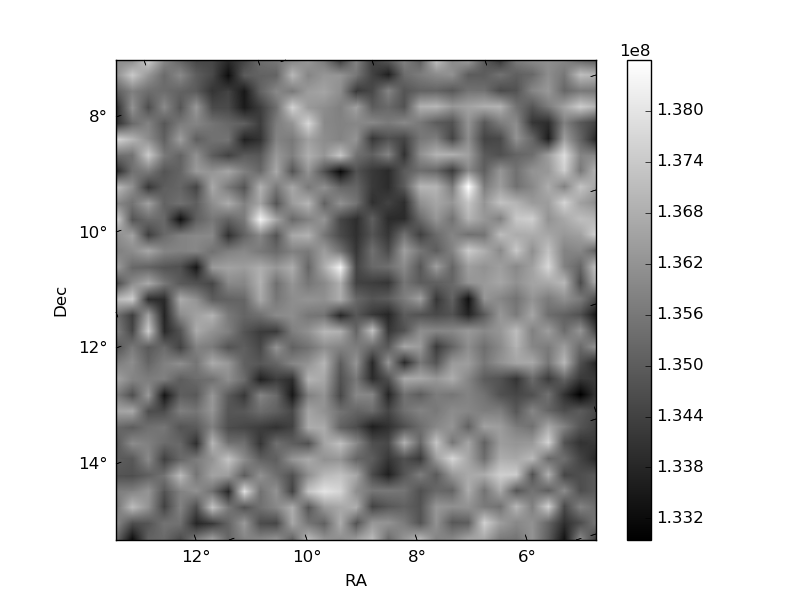
Histogram calculated using DETX and DETY for each event in the final _common_clean file
| Quadrant A | 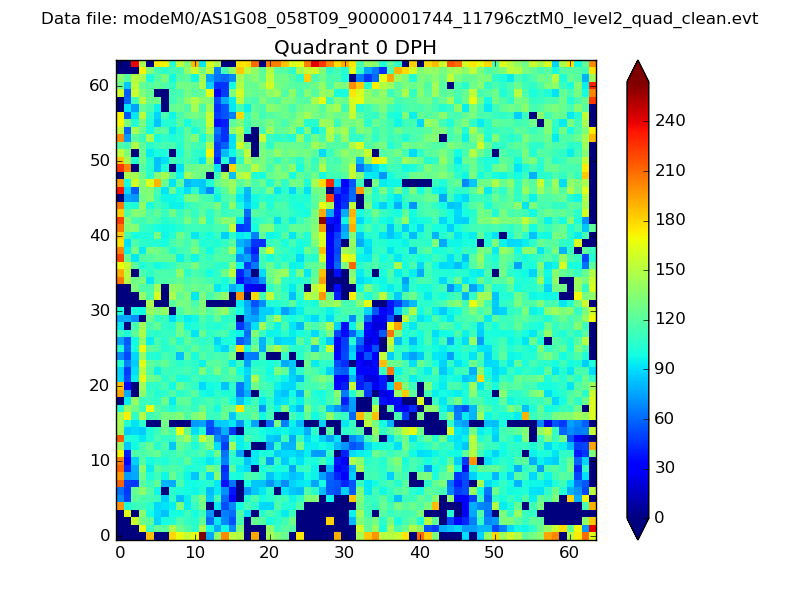 |
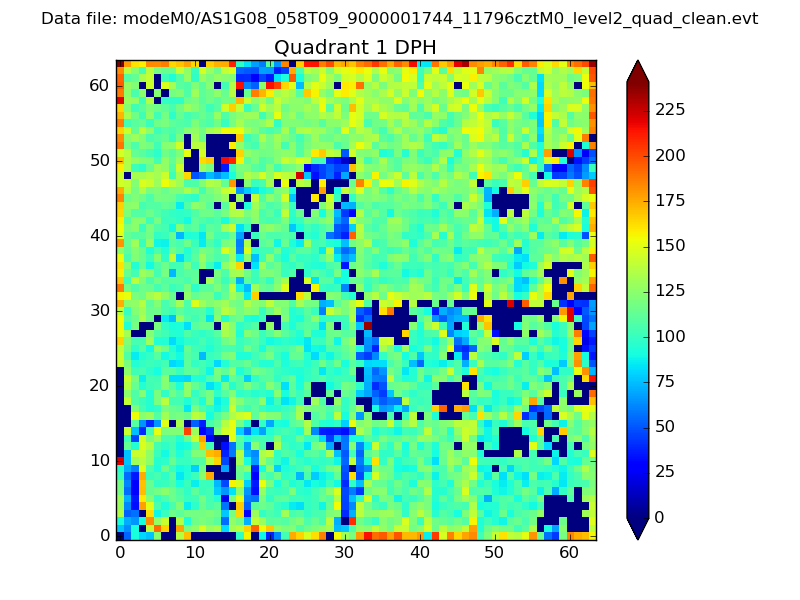 |
Quadrant B |
|---|---|---|---|
| Quadrant D | 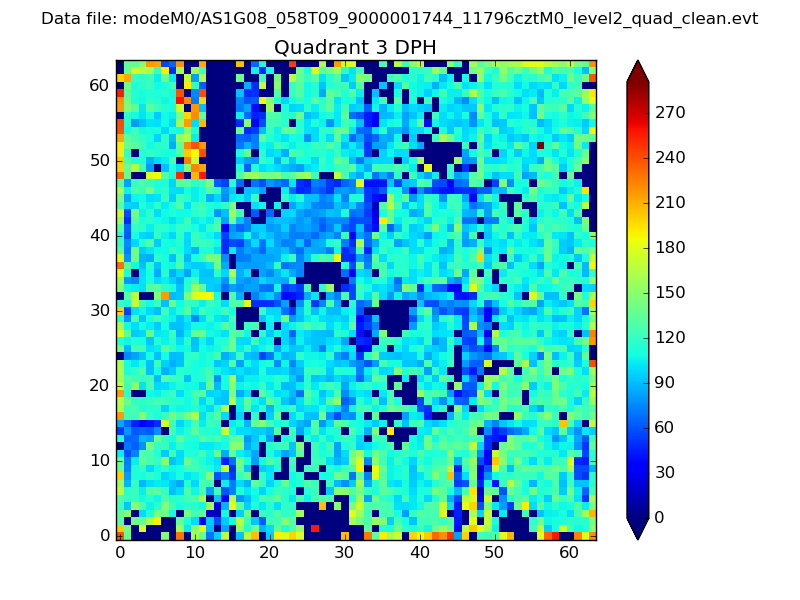 |
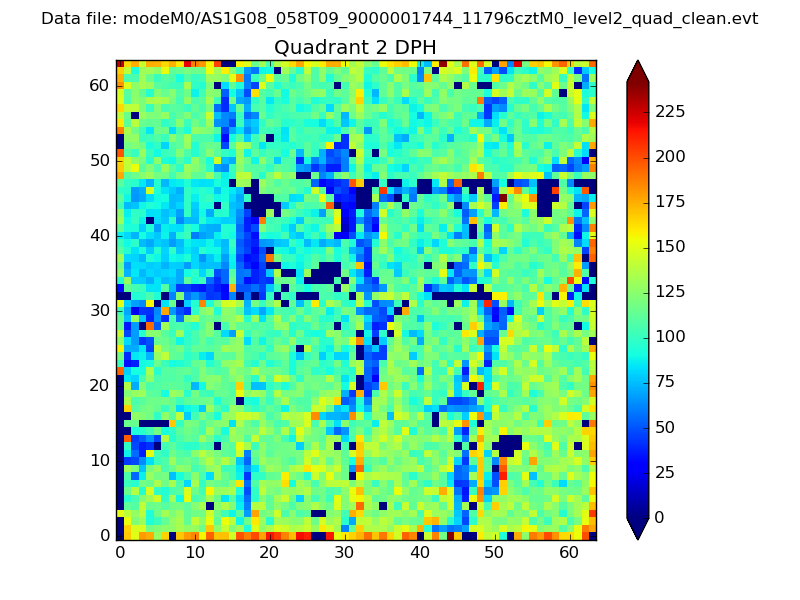 |
Quadrant C |
| Plot type | Count rate plots | Images |
|---|---|---|
| Comparison with Poisson distribution Blue bars denote a histogram of data divided into 1 sec bins. Red curve is a Poisson curve with rate = median count rate of data. |
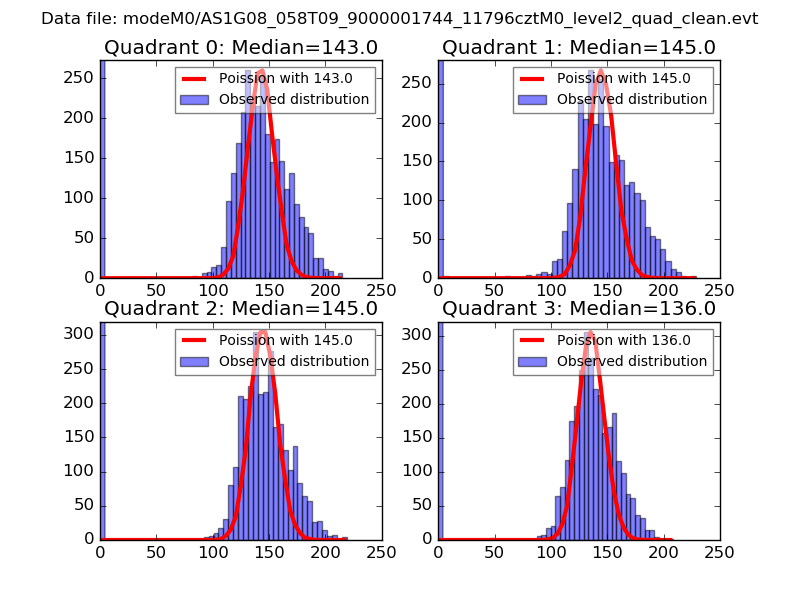 |
 |
| Quadrant-wise count rates Data is divided into 100 sec bins |
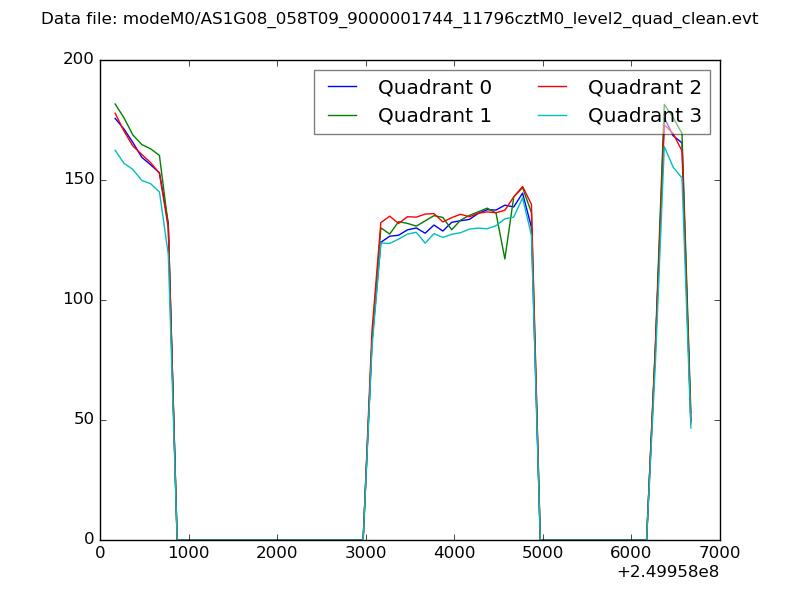 |
|
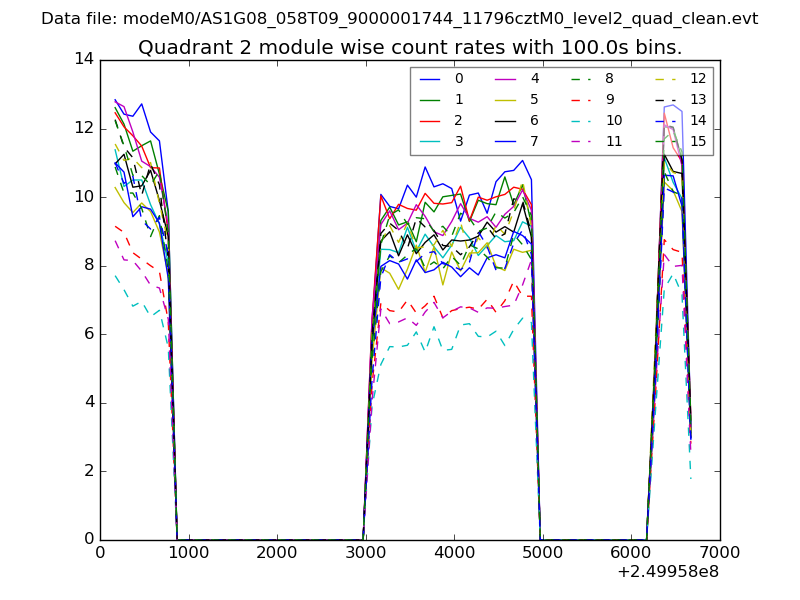
| Module-wise count rates for Quadrant A Data is divided into 100 sec bins |
 |
 |
| Module-wise count rates for Quadrant B Data is divided into 100 sec bins |
 |
 |
| Module-wise count rates for Quadrant C Data is divided into 100 sec bins |
 |
 |
| Module-wise count rates for Quadrant D Data is divided into 100 sec bins |
 |
 |
| Parameter | Plot |
|---|---|
| CZT HV Monitor | 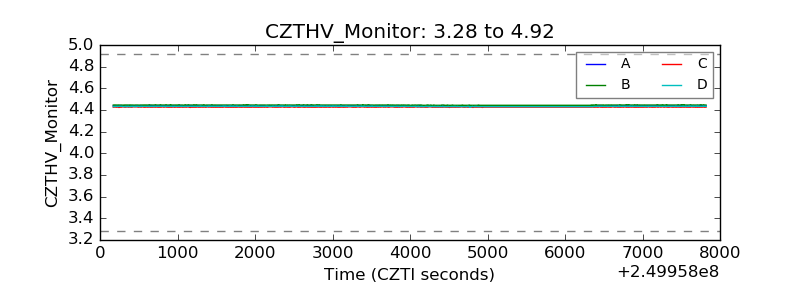 |
| D_VDD | 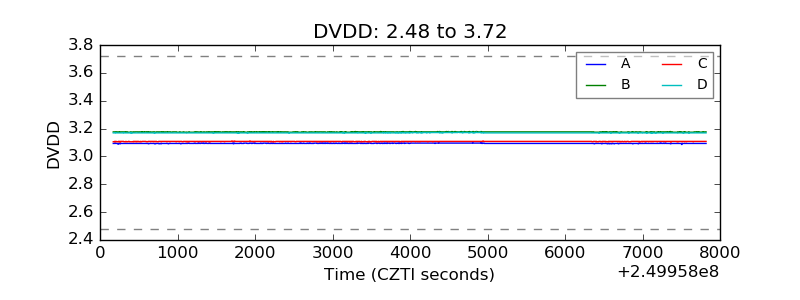 |
| Temperature 1 | 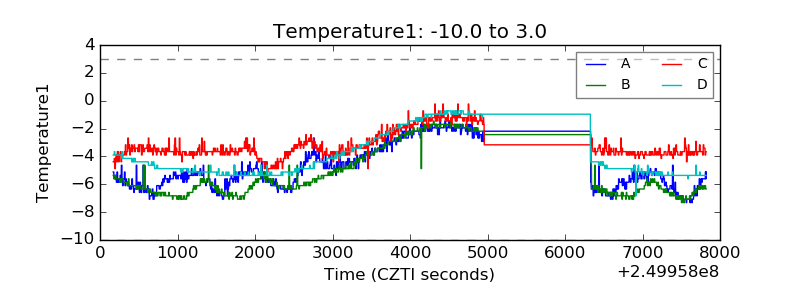 |
| Veto HV Monitor |  |
| Veto LLD | 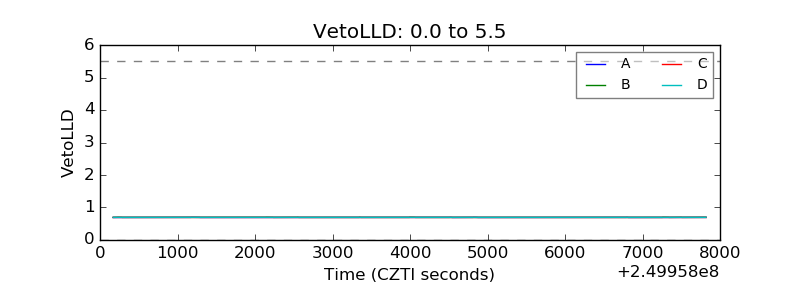 |
| Alpha Counter | 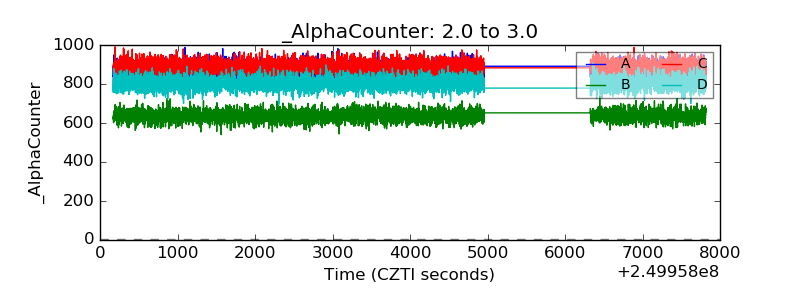 |
| _CPM_Rate | 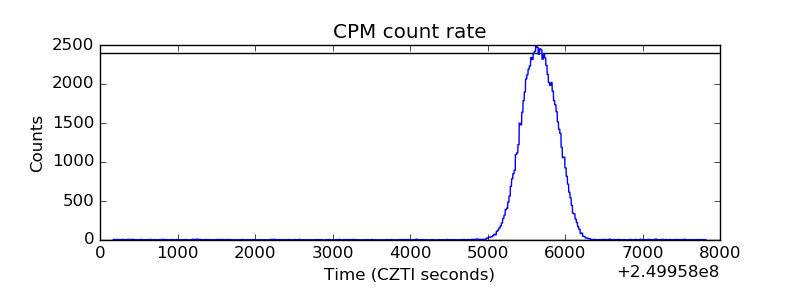 |
| CZT Counter | 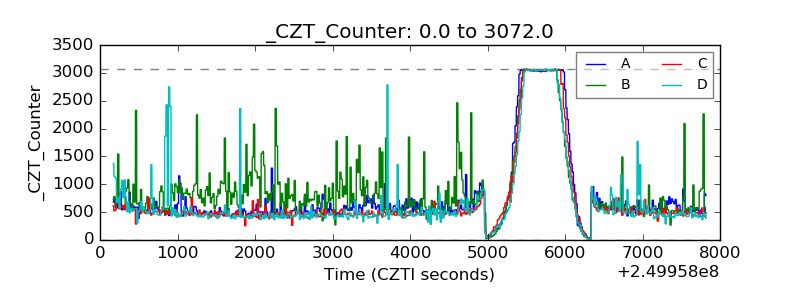 |
| +2.5 Volts monitor |  |
| +5 Volts monitor |  |
| _ROLL_ROT | 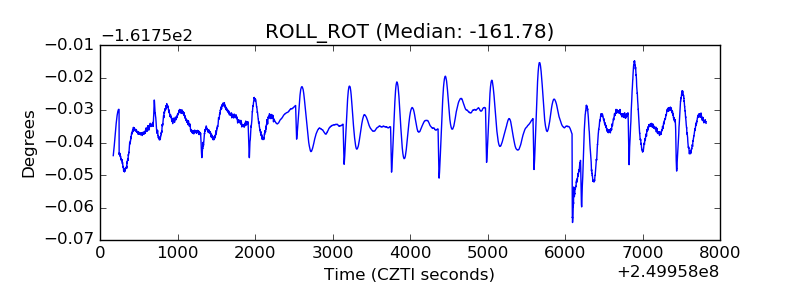 |
| _Roll_DEC |  |
| _Roll_RA | 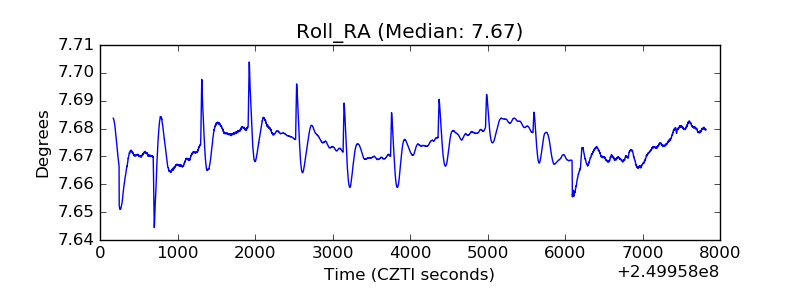 |
| Veto Counter |  |