| Param | Original file | Final file |
|---|---|---|
| Filename | modeM0/AS1G08_058T09_9000001744_11797cztM0_level2.evt | modeM0/AS1G08_058T09_9000001744_11797cztM0_level2_quad_clean.evt |
| Size (bytes) | 483,073,920 | 63,694,080 |
| Size | 460.7 MB | 60.7 MB |
| Events in quadrant A | 3,791,273 | 370,470 |
| Events in quadrant B | 3,943,004 | 376,050 |
| Events in quadrant C | 3,123,021 | 377,029 |
| Events in quadrant D | 3,338,722 | 358,848 |
| Mode M9 | |||
|---|---|---|---|
| Quadrant | BADHDUFLAG | Total packets | Discarded packets |
| A | 0 | 15 | 0 |
| B | 0 | 15 | 0 |
| C | 0 | 15 | 0 |
| D | 0 | 16 | 0 |
| Mode M0 | |||
|---|---|---|---|
| Quadrant | BADHDUFLAG | Total packets | Discarded packets |
| A | 0 | 15334 | 3 |
| B | 0 | 15630 | 2 |
| C | 0 | 13220 | 2 |
| D | 0 | 14137 | 2 |
| Mode SS | |||
|---|---|---|---|
| Quadrant | BADHDUFLAG | Total packets | Discarded packets |
| A | 0 | 130 | 0 |
| B | 0 | 130 | 0 |
| C | 0 | 130 | 0 |
| D | 0 | 130 | 0 |
| Quadrant | Total seconds | Saturated seconds | Saturation percentage |
|---|---|---|---|
| A | 6392 | 113 | 1.767835% |
| B | 6392 | 165 | 2.581352% |
| C | 6392 | 44 | 0.688360% |
| D | 6392 | 103 | 1.611389% |
Noise dominated data is calculated using 1-second bins in cleaned event files. If a bin has >2000 counts, and if more than 50% of those come from <1% of pixels, then it is considered to be noise-dominated and hence unusable.
| Quadrant | # 1 sec bins | Bins with >0 counts | Bins with >2000 counts | High rate bins dominated by noise | Noise dominated (total time) | Noise dominated (detector-on time) | Marked lightcurve |
|---|---|---|---|---|---|---|---|
| A | 7713 | 6394 | 5 | 5 | 0.06% | 0.08% | 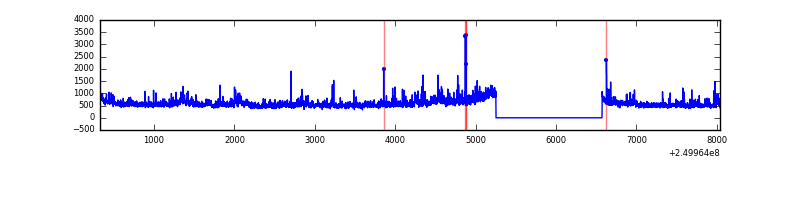 |
| B | 7713 | 6394 | 58 | 58 | 0.75% | 0.91% | 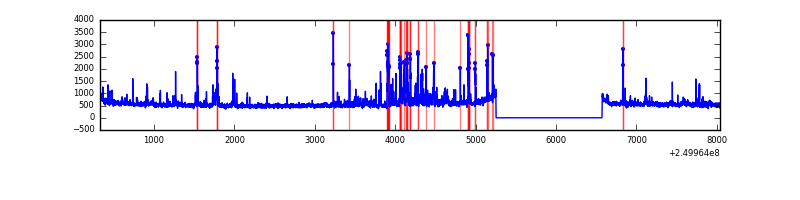 |
| C | 7713 | 6394 | 0 | 0 | 0.00% | 0.00% | 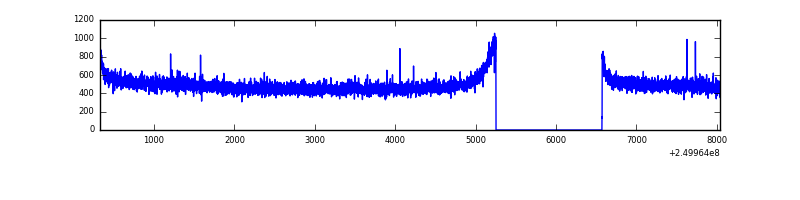 |
| D | 7713 | 6394 | 51 | 51 | 0.66% | 0.80% | 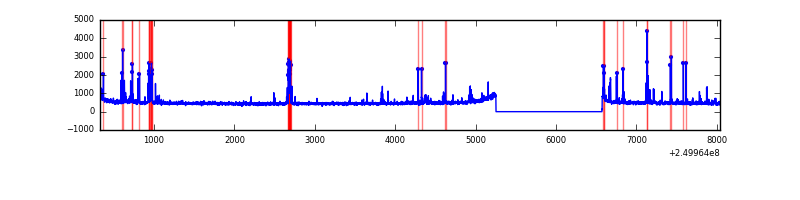 |
Top three noisy pixels from each quadrant. If the there are fewer than three noisy pixels in the level2.evt file, extra rows are filled as -1
| Pixel properties | Quadrant properties | ||||||
|---|---|---|---|---|---|---|---|
| Quadrant | DetID | PixID | Counts | Sigma | Mean | Median | Sigma |
| A | 8 | 15 | 386293 | 2352.32 | 818 | 802 | 163.9 |
| A | 1 | 162 | 109171 | 661.28 | 818 | 802 | 163.9 |
| A | 1 | 178 | 51897 | 311.79 | 818 | 802 | 163.9 |
| B | 4 | 239 | 337111 | 2172.73 | 824 | 805 | 154.8 |
| B | 3 | 64 | 108951 | 698.69 | 824 | 805 | 154.8 |
| B | 11 | 51 | 107244 | 687.66 | 824 | 805 | 154.8 |
| C | 13 | 61 | 5775 | 27.05 | 800 | 804 | 183.7 |
| C | 14 | 234 | 4397 | 19.55 | 800 | 804 | 183.7 |
| C | 3 | 202 | 1956 | 6.27 | 800 | 804 | 183.7 |
| D | 13 | 104 | 115811 | 616.28 | 788 | 765 | 186.7 |
| D | 13 | 249 | 67723 | 358.68 | 788 | 765 | 186.7 |
| D | 1 | 52 | 56835 | 300.36 | 788 | 765 | 186.7 |
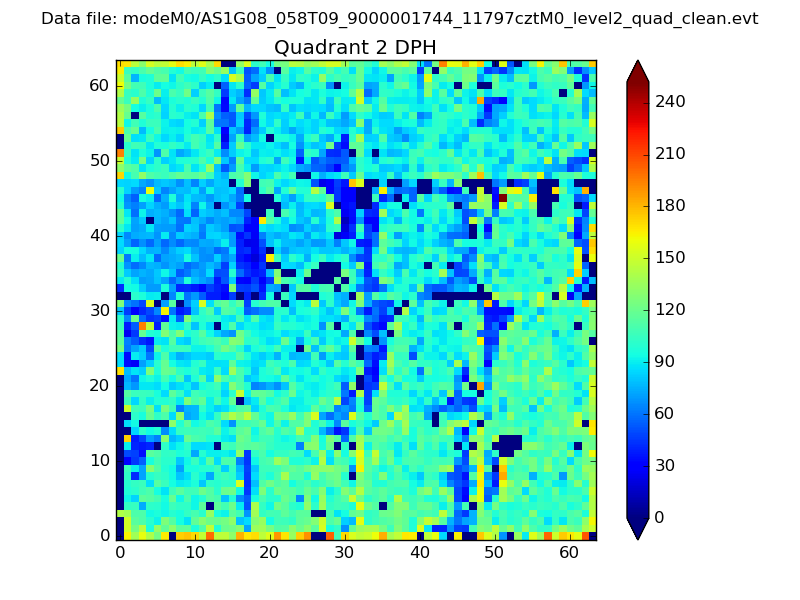
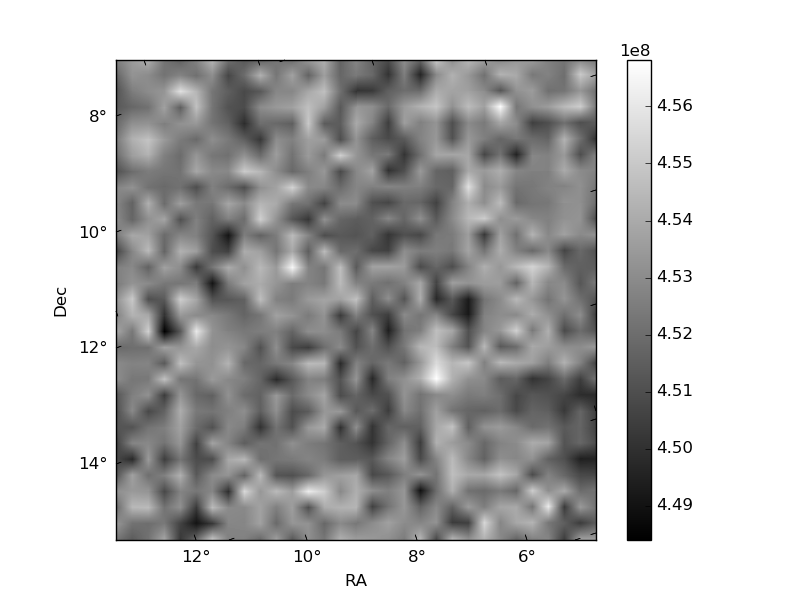
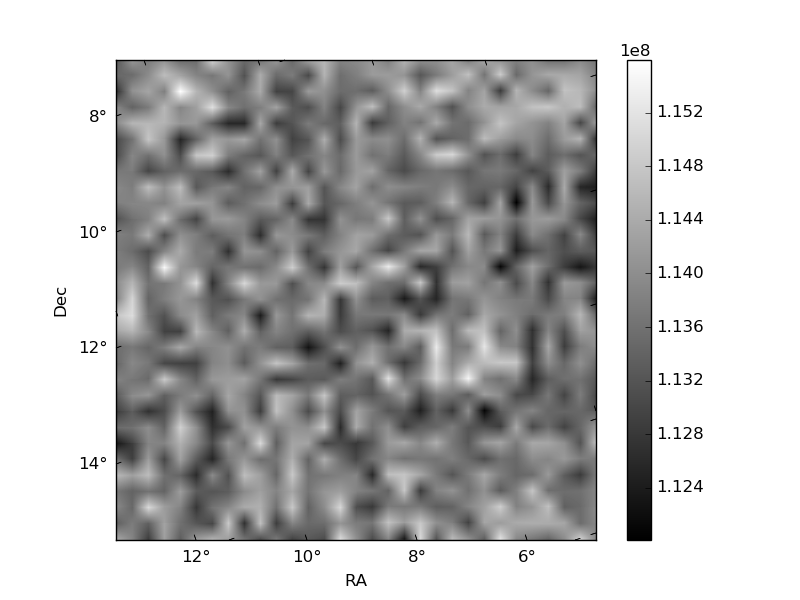
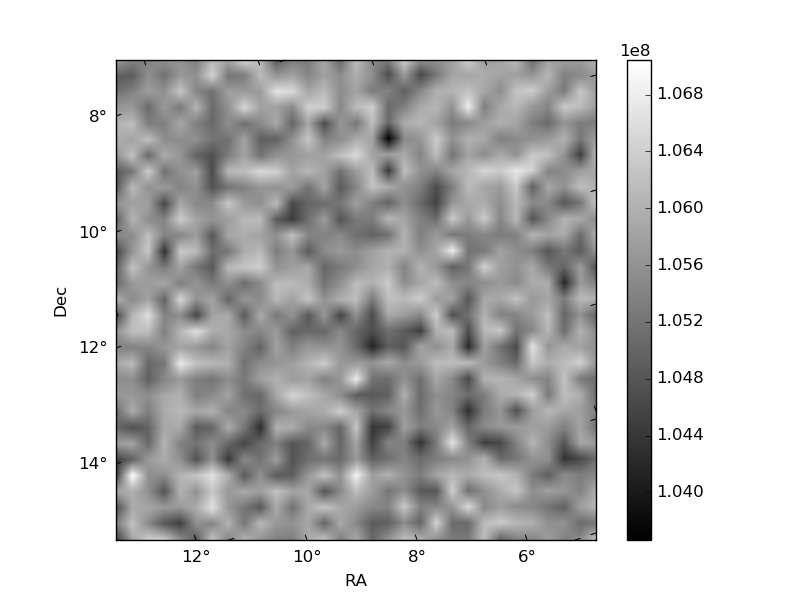
Histogram calculated using DETX and DETY for each event in the final _common_clean file
| Quadrant A | 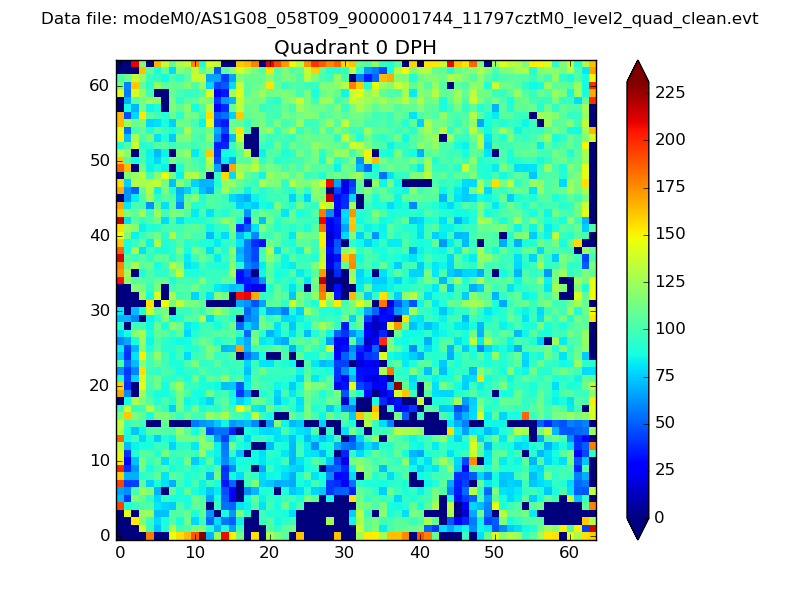 |
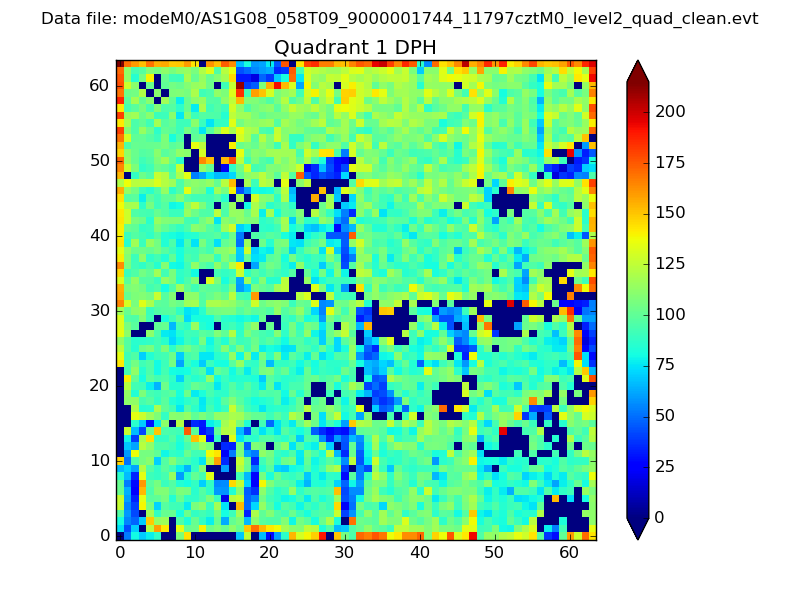 |
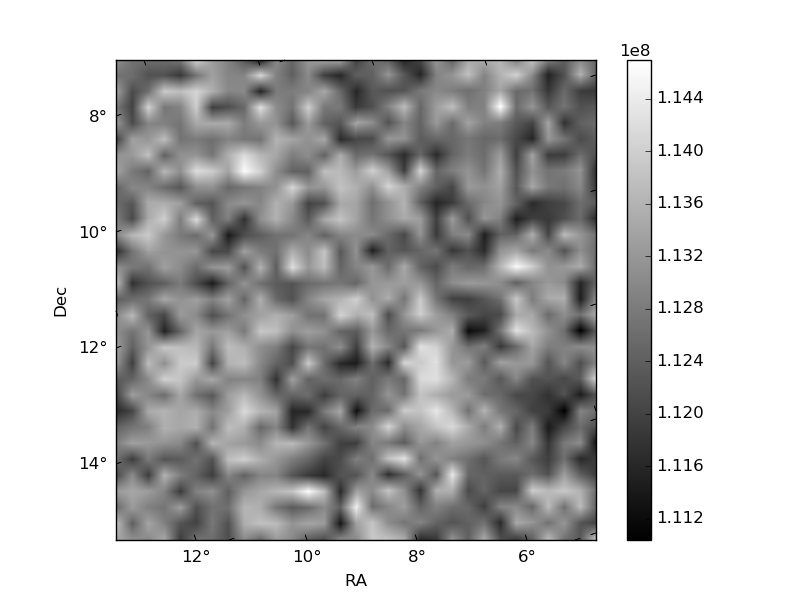
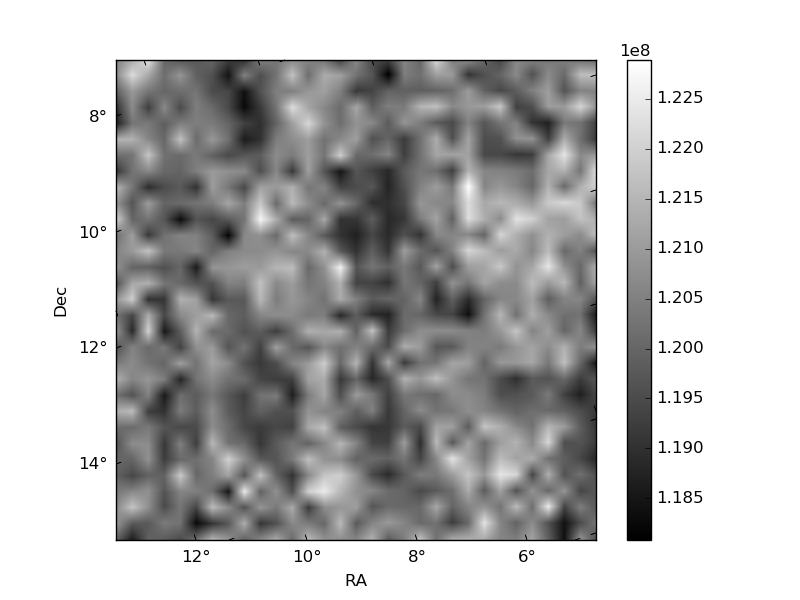
Quadrant B |
|---|---|---|---|
| Quadrant D | 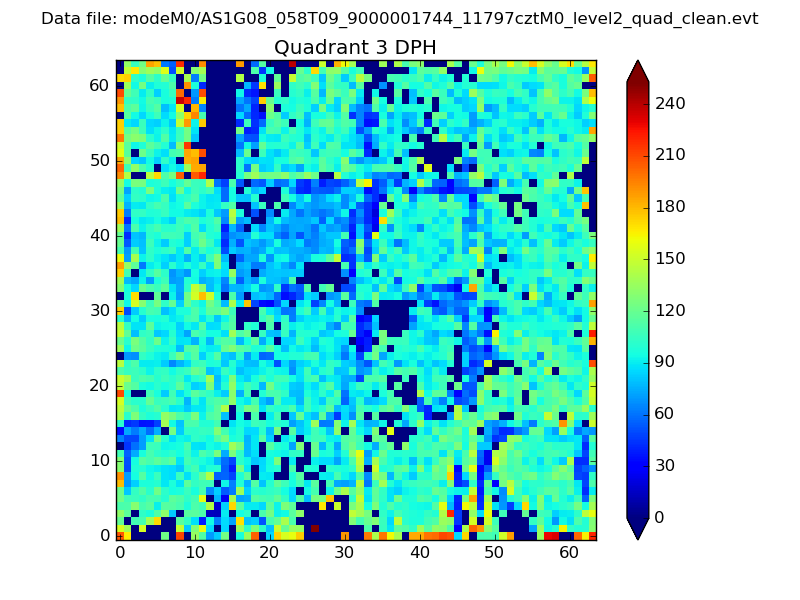 |
 |
Quadrant C |
| Plot type | Count rate plots | Images |
|---|---|---|
| Comparison with Poisson distribution Blue bars denote a histogram of data divided into 1 sec bins. Red curve is a Poisson curve with rate = median count rate of data. |
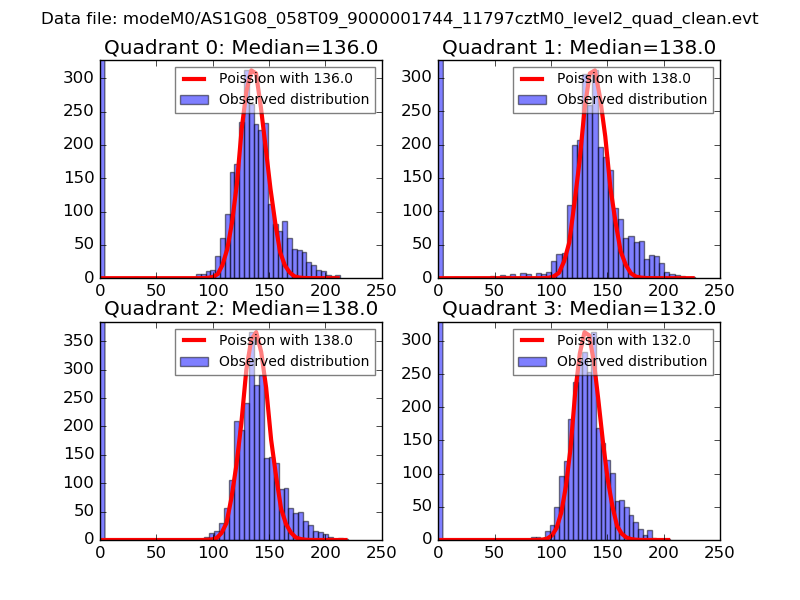 |
 |
| Quadrant-wise count rates Data is divided into 100 sec bins |
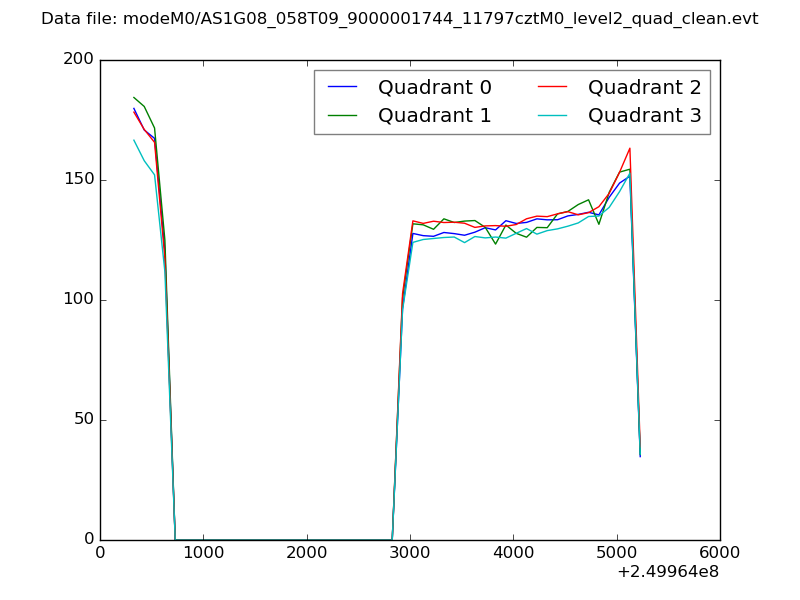 |
|
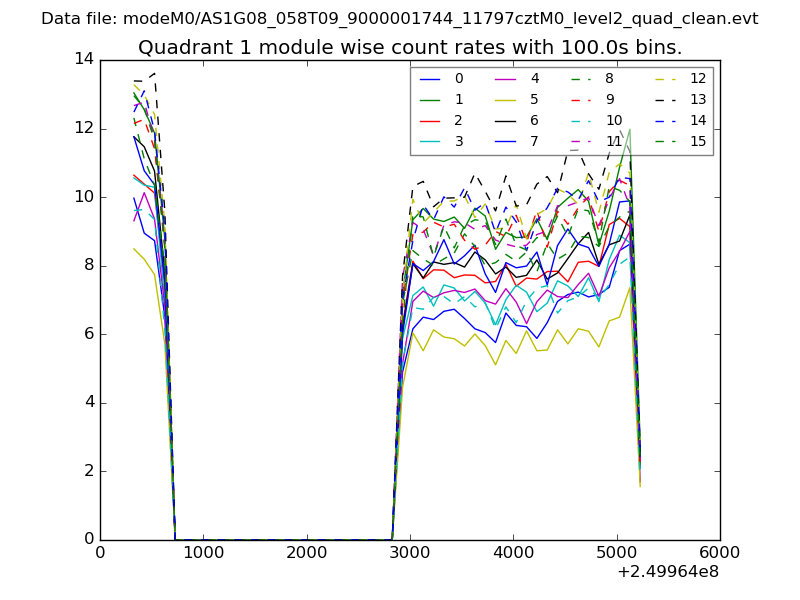
| Module-wise count rates for Quadrant A Data is divided into 100 sec bins |
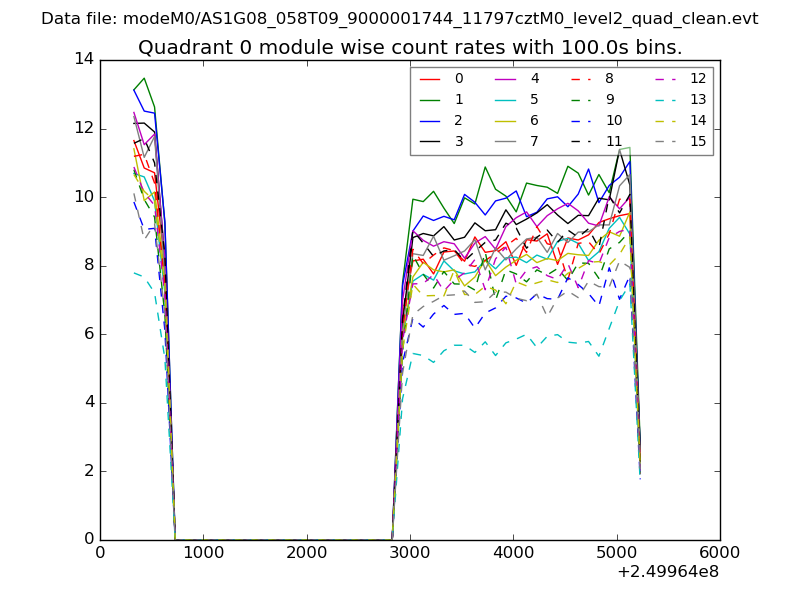 |
 |
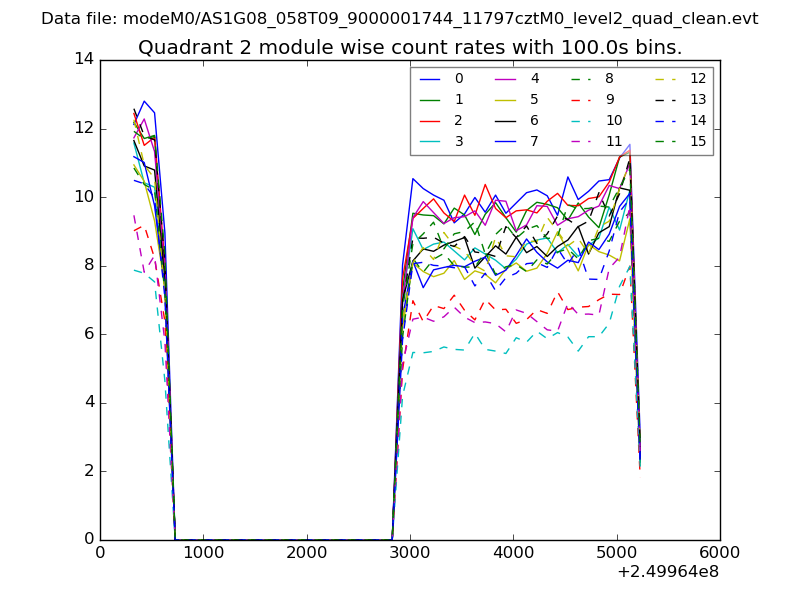
| Module-wise count rates for Quadrant B Data is divided into 100 sec bins |
 |
 |
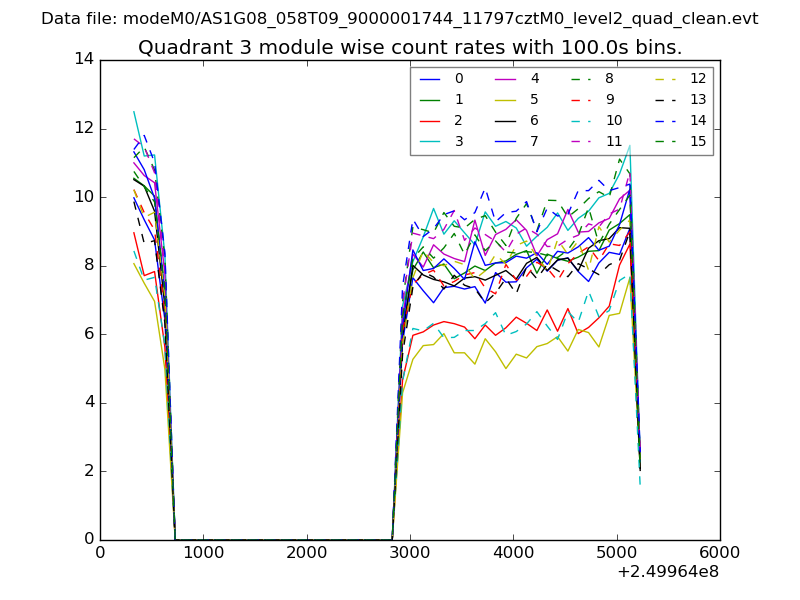
| Module-wise count rates for Quadrant C Data is divided into 100 sec bins |
 |
 |
| Module-wise count rates for Quadrant D Data is divided into 100 sec bins |
 |
 |
| Parameter | Plot |
|---|---|
| CZT HV Monitor | 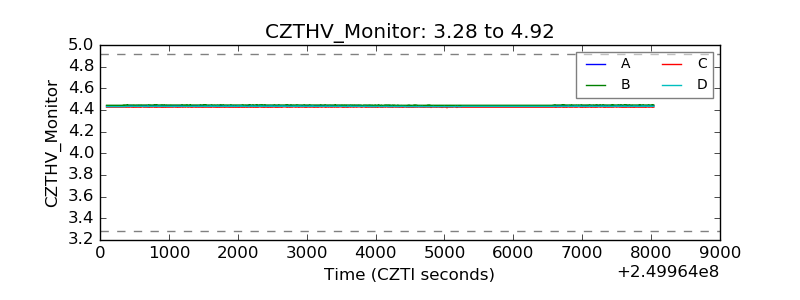 |
| D_VDD | 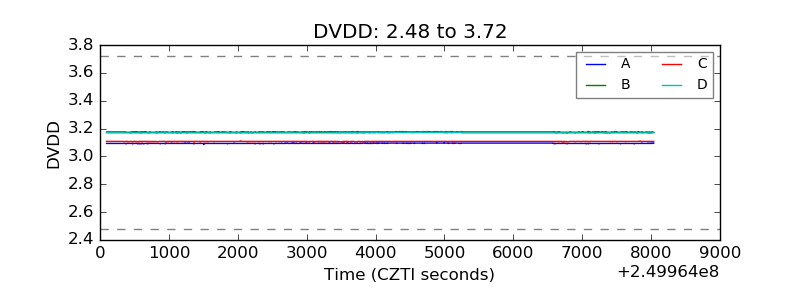 |
| Temperature 1 | 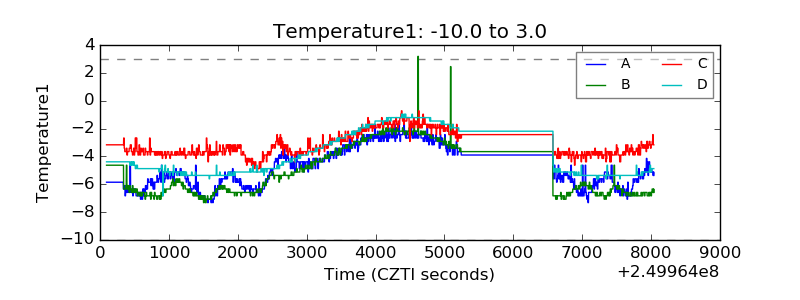 |
| Veto HV Monitor | 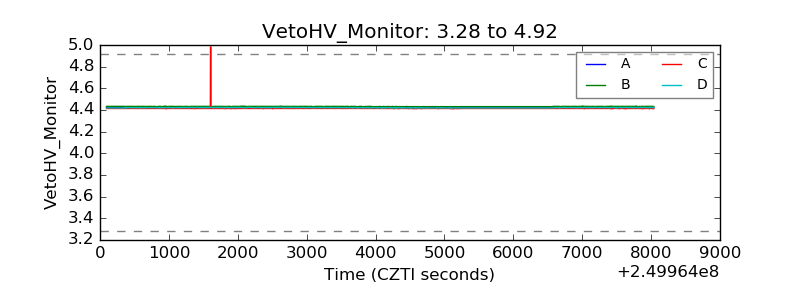 |
| Veto LLD | 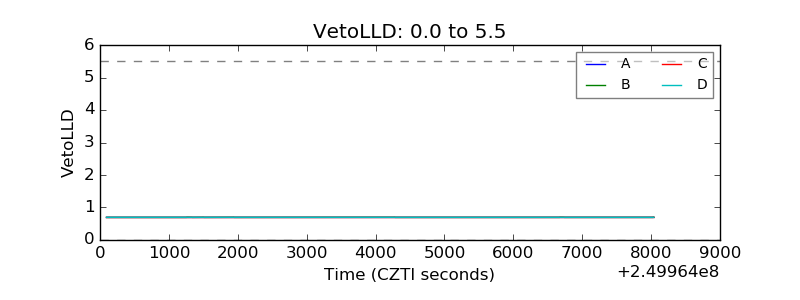 |
| Alpha Counter | 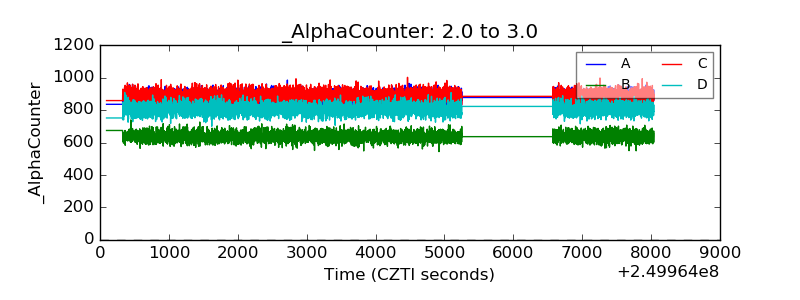 |
| _CPM_Rate | 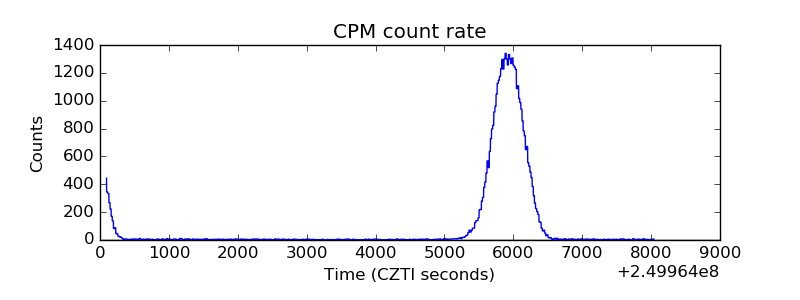 |
| CZT Counter | 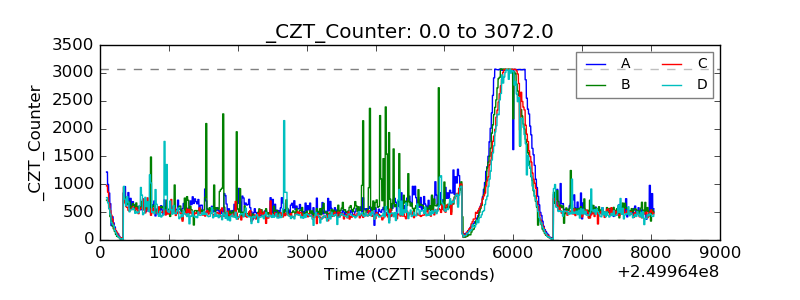 |
| +2.5 Volts monitor |  |
| +5 Volts monitor |  |
| _ROLL_ROT | 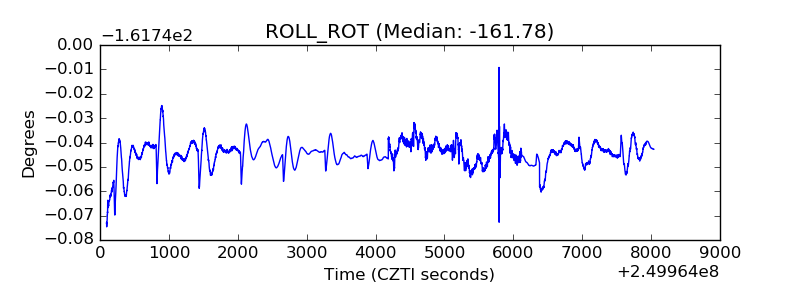 |
| _Roll_DEC | 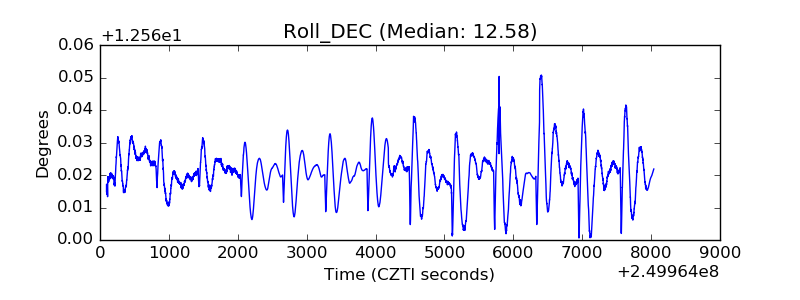 |
| _Roll_RA | 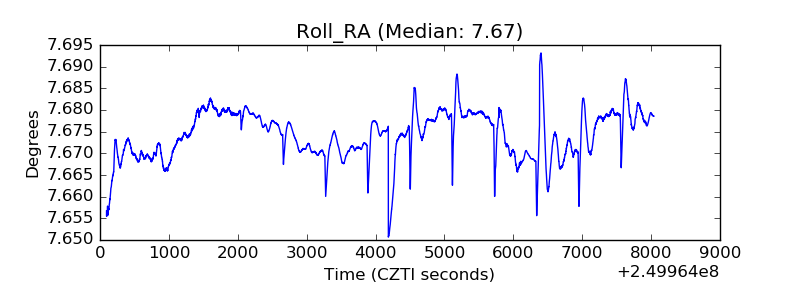 |
| Veto Counter | 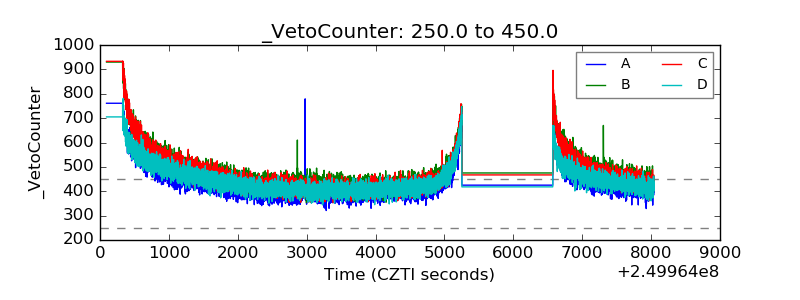 |