| Param | Original file | Final file |
|---|---|---|
| Filename | modeM0/AS1G08_058T09_9000001744_11798cztM0_level2.evt | modeM0/AS1G08_058T09_9000001744_11798cztM0_level2_quad_clean.evt |
| Size (bytes) | 499,345,920 | 63,826,560 |
| Size | 476.2 MB | 60.9 MB |
| Events in quadrant A | 3,487,092 | 376,605 |
| Events in quadrant B | 4,455,125 | 365,287 |
| Events in quadrant C | 3,127,924 | 380,451 |
| Events in quadrant D | 3,613,925 | 359,151 |
| Mode M9 | |||
|---|---|---|---|
| Quadrant | BADHDUFLAG | Total packets | Discarded packets |
| A | 0 | 13 | 0 |
| B | 0 | 13 | 0 |
| C | 0 | 13 | 0 |
| D | 0 | 14 | 0 |
| Mode M0 | |||
|---|---|---|---|
| Quadrant | BADHDUFLAG | Total packets | Discarded packets |
| A | 0 | 14291 | 3 |
| B | 0 | 17263 | 2 |
| C | 0 | 13457 | 2 |
| D | 0 | 14961 | 2 |
| Mode SS | |||
|---|---|---|---|
| Quadrant | BADHDUFLAG | Total packets | Discarded packets |
| A | 0 | 132 | 0 |
| B | 0 | 132 | 0 |
| C | 0 | 132 | 0 |
| D | 0 | 132 | 0 |
| Quadrant | Total seconds | Saturated seconds | Saturation percentage |
|---|---|---|---|
| A | 6459 | 112 | 1.734015% |
| B | 6459 | 361 | 5.589100% |
| C | 6459 | 52 | 0.805078% |
| D | 6459 | 158 | 2.446199% |
Noise dominated data is calculated using 1-second bins in cleaned event files. If a bin has >2000 counts, and if more than 50% of those come from <1% of pixels, then it is considered to be noise-dominated and hence unusable.
| Quadrant | # 1 sec bins | Bins with >0 counts | Bins with >2000 counts | High rate bins dominated by noise | Noise dominated (total time) | Noise dominated (detector-on time) | Marked lightcurve |
|---|---|---|---|---|---|---|---|
| A | 7560 | 6461 | 3 | 3 | 0.04% | 0.05% | 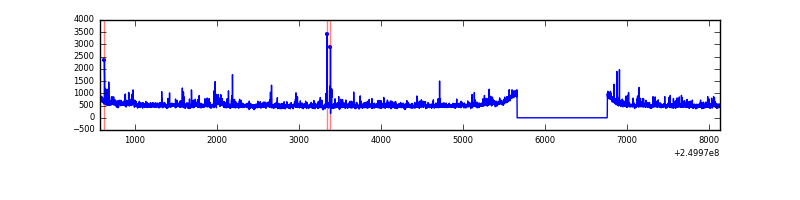 |
| B | 7560 | 6461 | 162 | 162 | 2.14% | 2.51% | 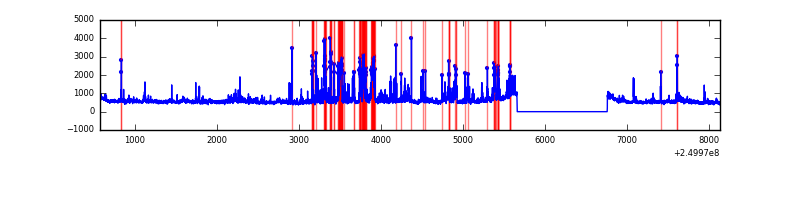 |
| C | 7560 | 6461 | 0 | 0 | 0.00% | 0.00% | 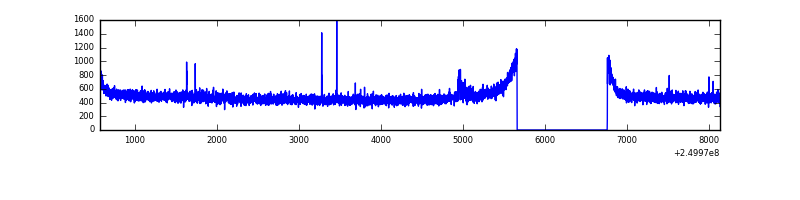 |
| D | 7560 | 6461 | 53 | 53 | 0.70% | 0.82% | 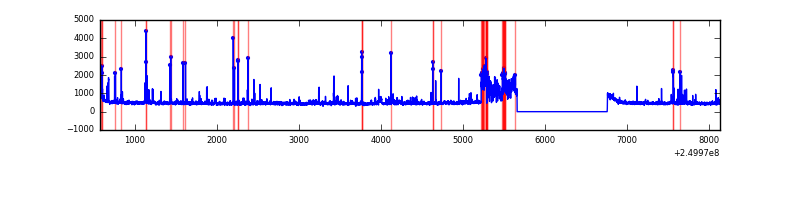 |
Top three noisy pixels from each quadrant. If the there are fewer than three noisy pixels in the level2.evt file, extra rows are filled as -1
| Pixel properties | Quadrant properties | ||||||
|---|---|---|---|---|---|---|---|
| Quadrant | DetID | PixID | Counts | Sigma | Mean | Median | Sigma |
| A | 1 | 162 | 102257 | 609.37 | 817 | 799 | 166.5 |
| A | 8 | 15 | 98432 | 586.39 | 817 | 799 | 166.5 |
| A | 1 | 178 | 49095 | 290.07 | 817 | 799 | 166.5 |
| B | 4 | 239 | 529770 | 3430.01 | 810 | 792 | 154.2 |
| B | 3 | 64 | 429589 | 2780.42 | 810 | 792 | 154.2 |
| B | 11 | 51 | 160812 | 1037.61 | 810 | 792 | 154.2 |
| C | 1 | 3 | 16290 | 84.55 | 796 | 802 | 183.2 |
| C | 13 | 61 | 5849 | 27.55 | 796 | 802 | 183.2 |
| C | 14 | 234 | 5216 | 24.1 | 796 | 802 | 183.2 |
| D | 1 | 52 | 477346 | 2535.62 | 783 | 763 | 188.0 |
| D | 13 | 104 | 39591 | 206.58 | 783 | 763 | 188.0 |
| D | 9 | 85 | 38746 | 202.09 | 783 | 763 | 188.0 |
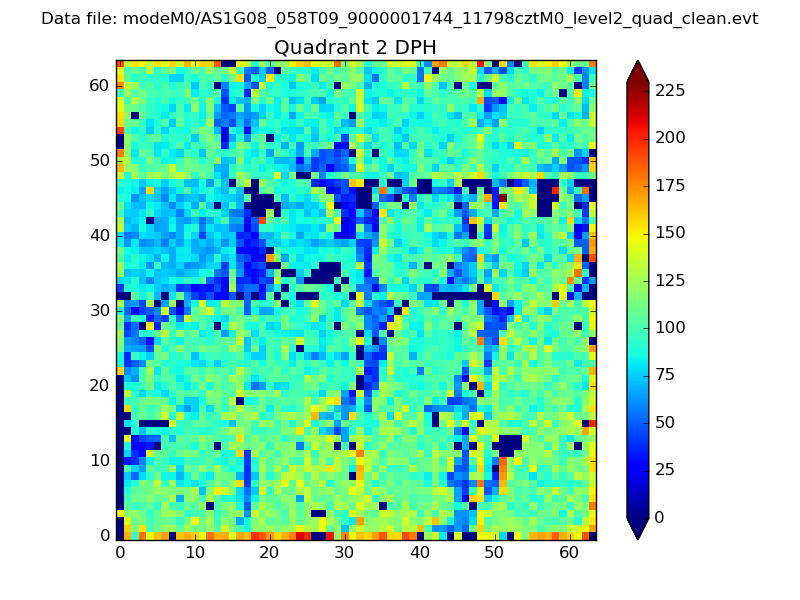
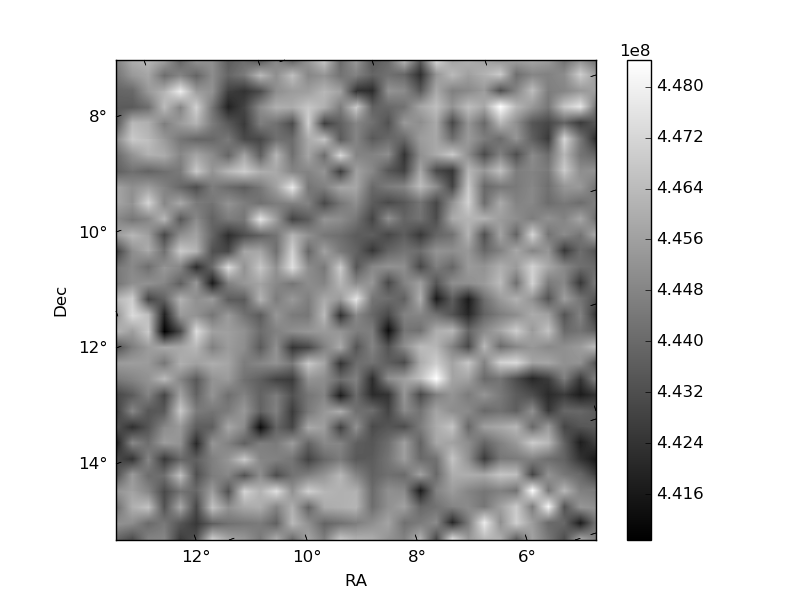
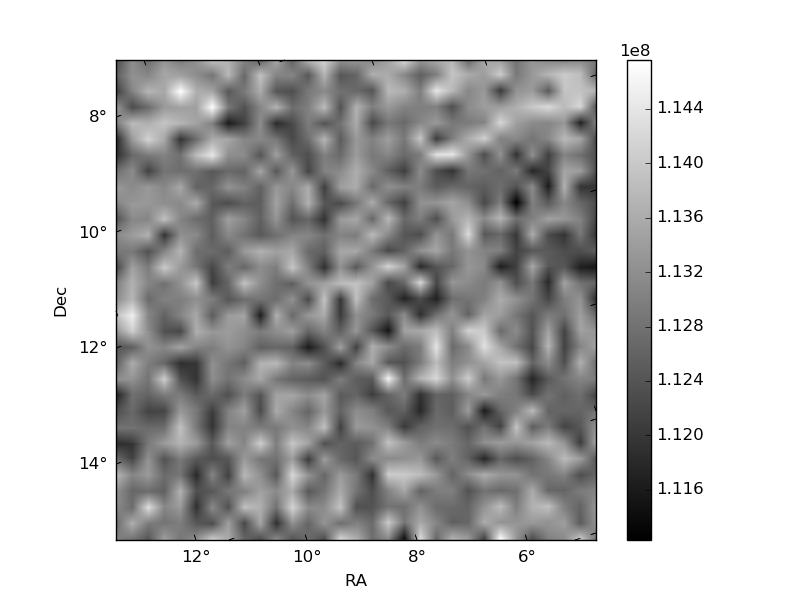
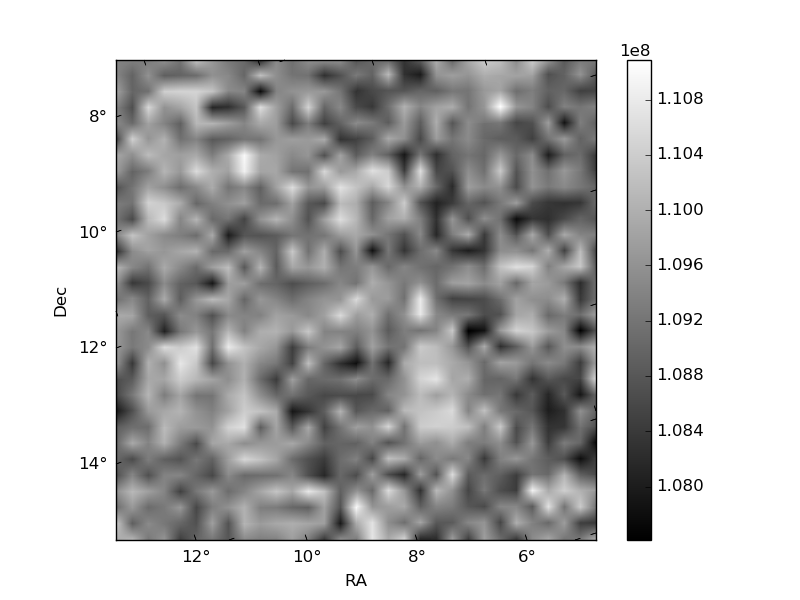
Histogram calculated using DETX and DETY for each event in the final _common_clean file
| Quadrant A | 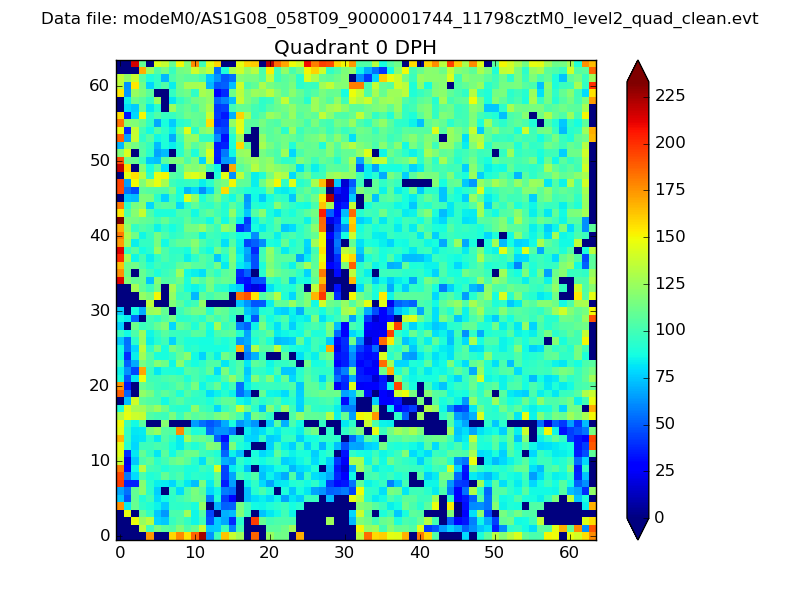 |
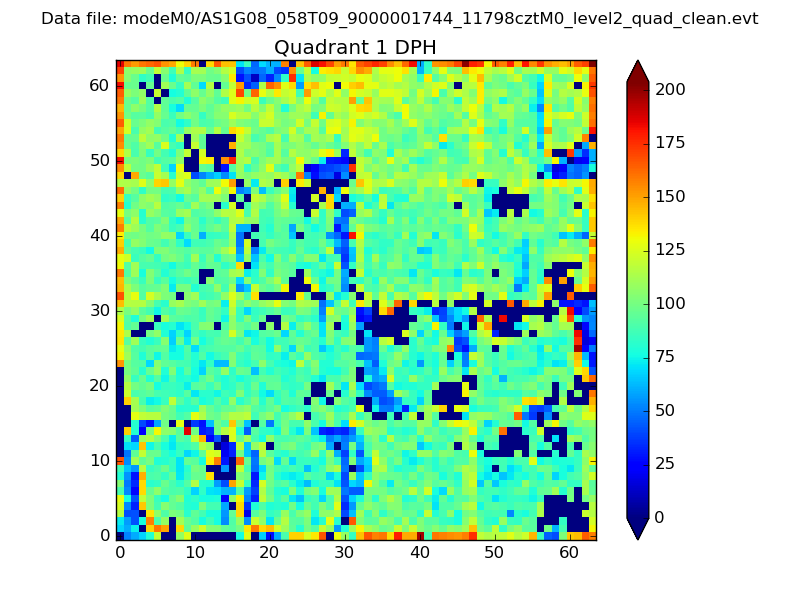 |
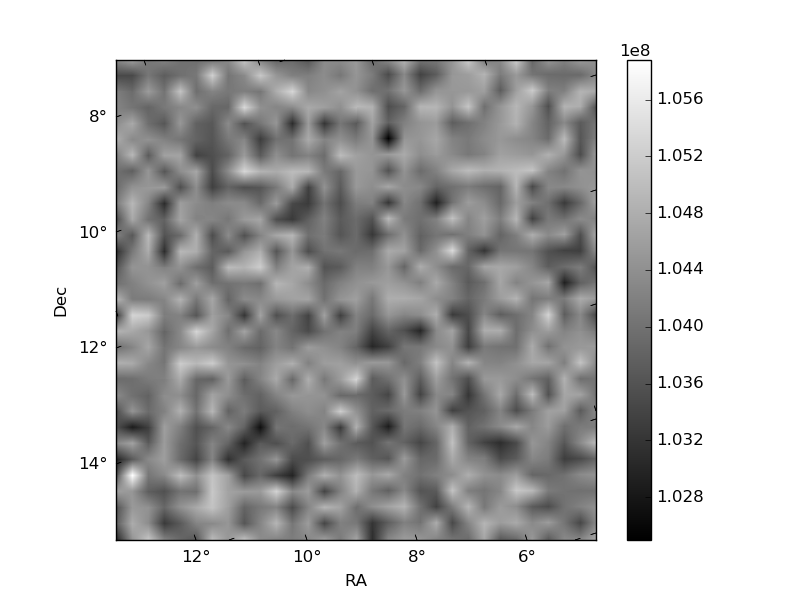
Quadrant B |
|---|---|---|---|
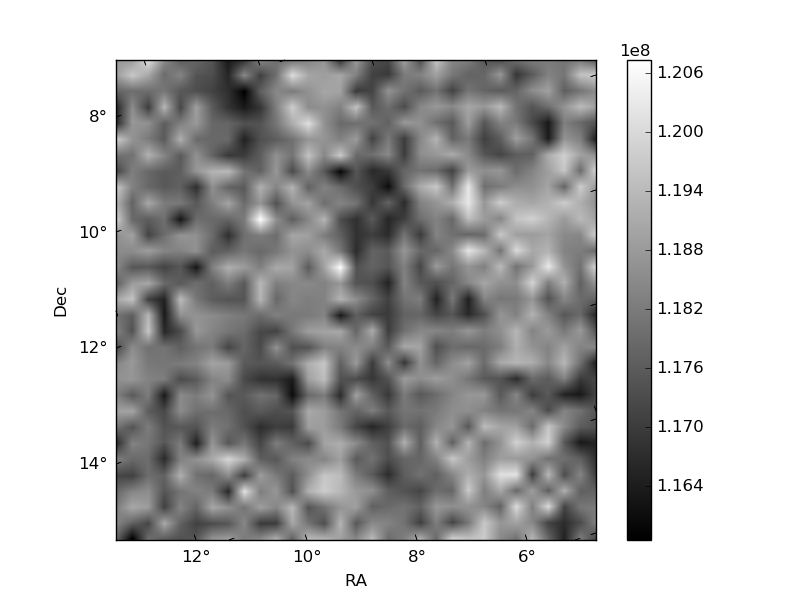
| Quadrant D | 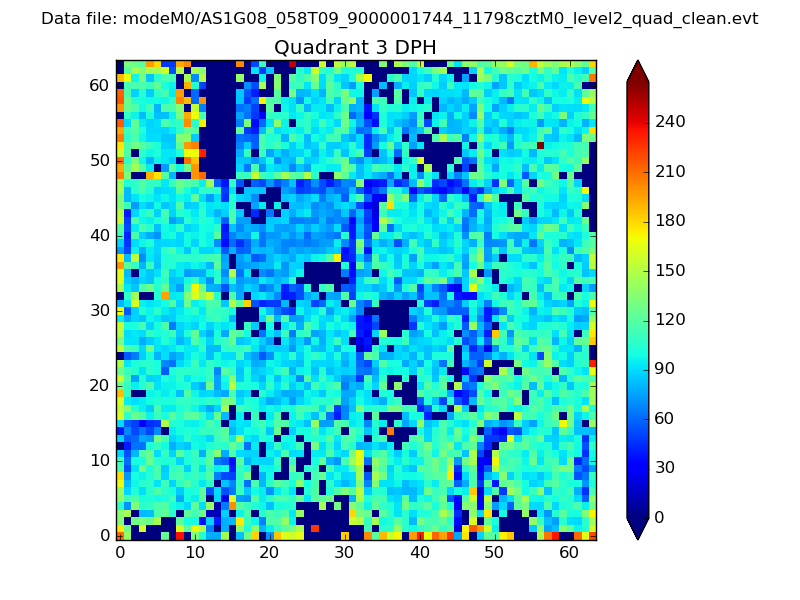 |
 |
Quadrant C |
| Plot type | Count rate plots | Images |
|---|---|---|
| Comparison with Poisson distribution Blue bars denote a histogram of data divided into 1 sec bins. Red curve is a Poisson curve with rate = median count rate of data. |
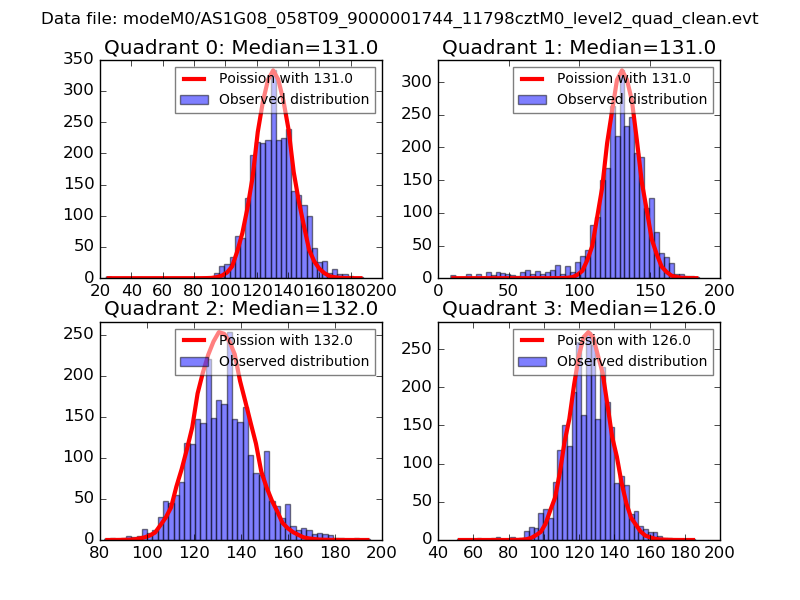 |
 |
| Quadrant-wise count rates Data is divided into 100 sec bins |
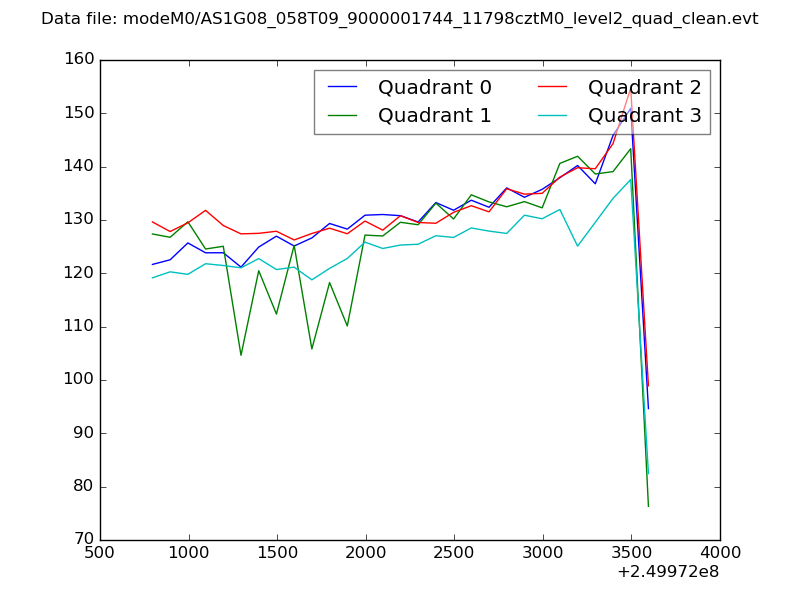 |
|
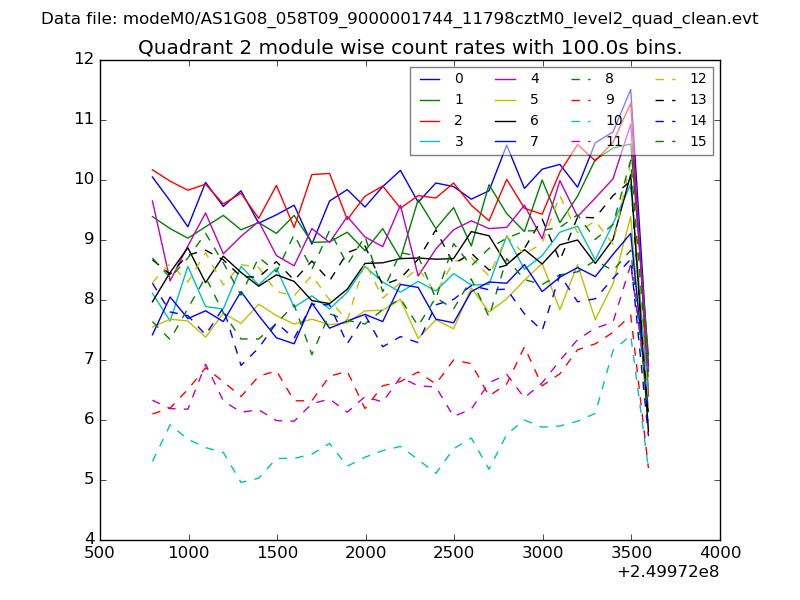
| Module-wise count rates for Quadrant A Data is divided into 100 sec bins |
 |
 |
| Module-wise count rates for Quadrant B Data is divided into 100 sec bins |
 |
 |
| Module-wise count rates for Quadrant C Data is divided into 100 sec bins |
 |
 |
| Module-wise count rates for Quadrant D Data is divided into 100 sec bins |
 |
 |
| Parameter | Plot |
|---|---|
| CZT HV Monitor | 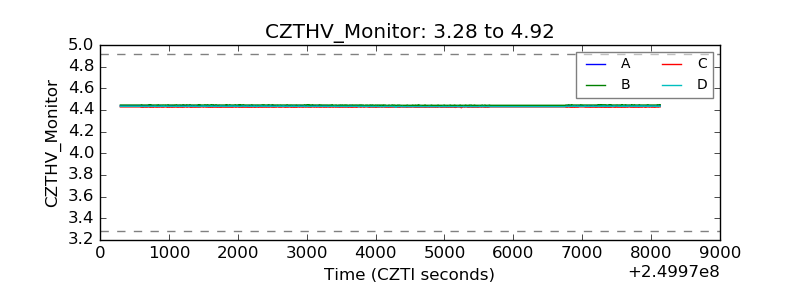 |
| D_VDD | 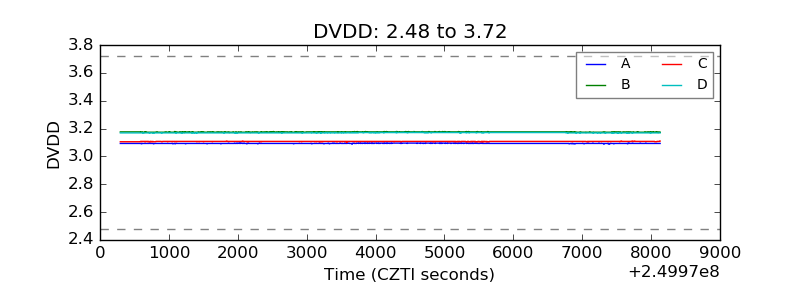 |
| Temperature 1 | 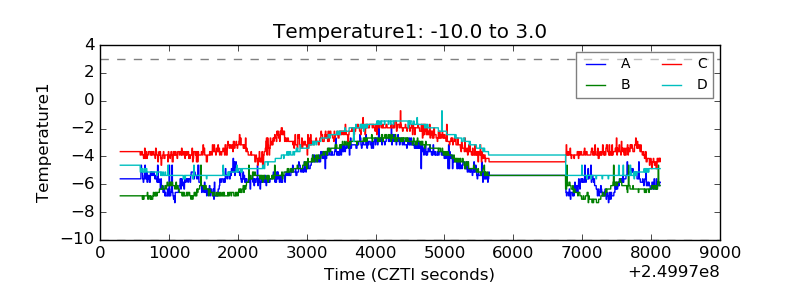 |
| Veto HV Monitor | 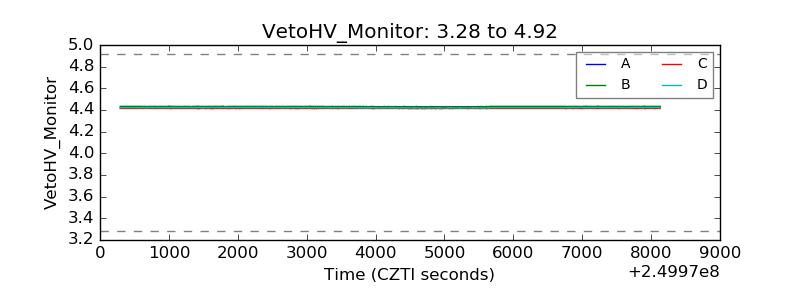 |
| Veto LLD | 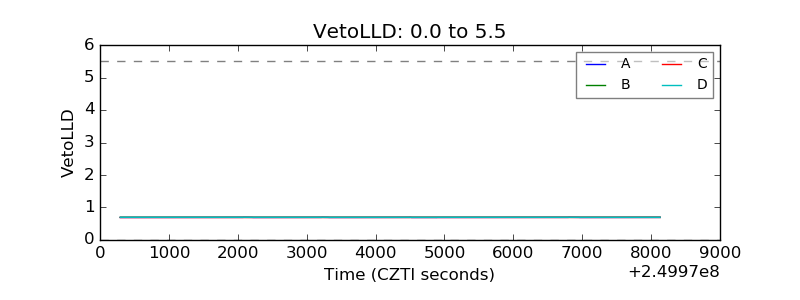 |
| Alpha Counter | 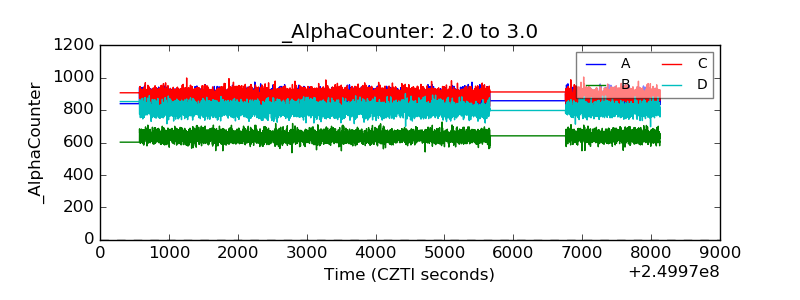 |
| _CPM_Rate | 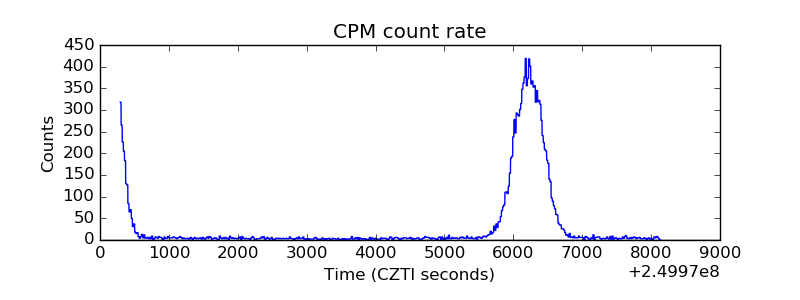 |
| CZT Counter | 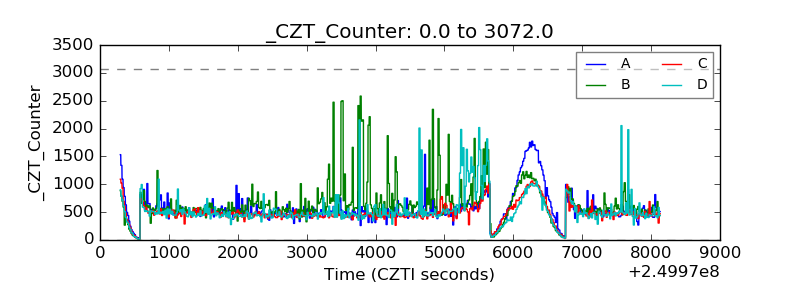 |
| +2.5 Volts monitor |  |
| +5 Volts monitor |  |
| _ROLL_ROT | 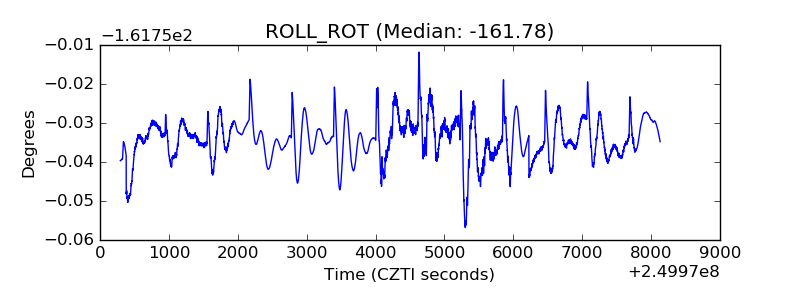 |
| _Roll_DEC |  |
| _Roll_RA |  |
| Veto Counter |  |