| Param | Original file | Final file |
|---|---|---|
| Filename | modeM0/AS1G08_058T09_9000001744_11799cztM0_level2.evt | modeM0/AS1G08_058T09_9000001744_11799cztM0_level2_quad_clean.evt |
| Size (bytes) | 548,164,800 | 75,300,480 |
| Size | 522.8 MB | 71.8 MB |
| Events in quadrant A | 3,690,977 | 454,866 |
| Events in quadrant B | 5,622,701 | 441,531 |
| Events in quadrant C | 3,259,939 | 458,732 |
| Events in quadrant D | 3,558,151 | 442,590 |
| Mode M9 | |||
|---|---|---|---|
| Quadrant | BADHDUFLAG | Total packets | Discarded packets |
| A | 0 | 8 | 0 |
| B | 0 | 8 | 0 |
| C | 0 | 8 | 0 |
| D | 0 | 9 | 0 |
| Mode M0 | |||
|---|---|---|---|
| Quadrant | BADHDUFLAG | Total packets | Discarded packets |
| A | 0 | 15150 | 3 |
| B | 0 | 21288 | 2 |
| C | 0 | 14332 | 2 |
| D | 0 | 15302 | 2 |
| Mode SS | |||
|---|---|---|---|
| Quadrant | BADHDUFLAG | Total packets | Discarded packets |
| A | 0 | 140 | 0 |
| B | 0 | 140 | 0 |
| C | 0 | 140 | 0 |
| D | 0 | 140 | 0 |
| Quadrant | Total seconds | Saturated seconds | Saturation percentage |
|---|---|---|---|
| A | 6921 | 173 | 2.499639% |
| B | 6921 | 575 | 8.308048% |
| C | 6921 | 87 | 1.257044% |
| D | 6921 | 184 | 2.658575% |
Noise dominated data is calculated using 1-second bins in cleaned event files. If a bin has >2000 counts, and if more than 50% of those come from <1% of pixels, then it is considered to be noise-dominated and hence unusable.
| Quadrant | # 1 sec bins | Bins with >0 counts | Bins with >2000 counts | High rate bins dominated by noise | Noise dominated (total time) | Noise dominated (detector-on time) | Marked lightcurve |
|---|---|---|---|---|---|---|---|
| A | 7622 | 6923 | 2 | 2 | 0.03% | 0.03% | 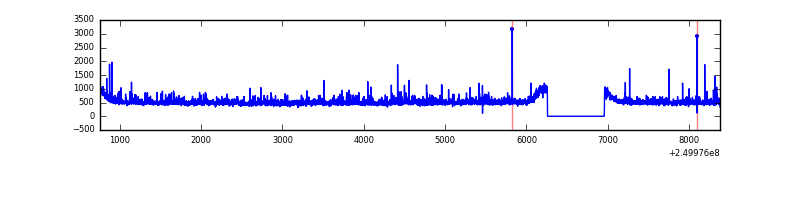 |
| B | 7622 | 6923 | 294 | 294 | 3.86% | 4.25% | 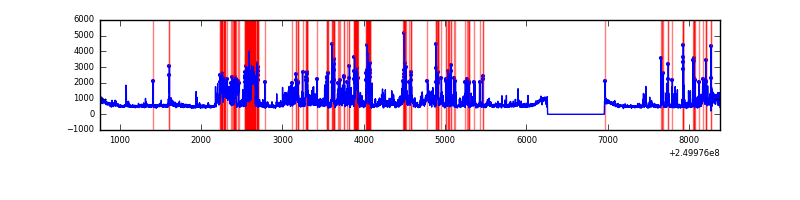 |
| C | 7622 | 6923 | 0 | 0 | 0.00% | 0.00% | 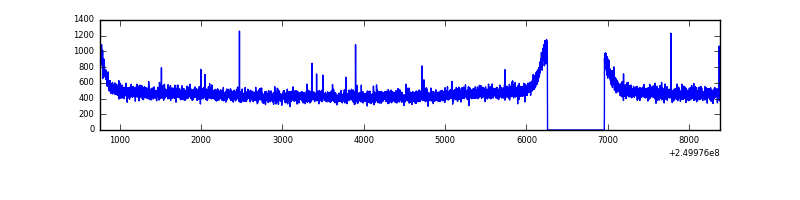 |
| D | 7622 | 6922 | 49 | 49 | 0.64% | 0.71% | 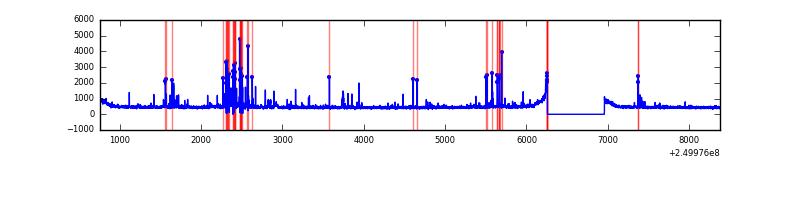 |
Top three noisy pixels from each quadrant. If the there are fewer than three noisy pixels in the level2.evt file, extra rows are filled as -1
| Pixel properties | Quadrant properties | ||||||
|---|---|---|---|---|---|---|---|
| Quadrant | DetID | PixID | Counts | Sigma | Mean | Median | Sigma |
| A | 1 | 162 | 117465 | 664.47 | 854 | 834 | 175.5 |
| A | 8 | 15 | 115496 | 653.25 | 854 | 834 | 175.5 |
| A | 1 | 178 | 57981 | 325.58 | 854 | 834 | 175.5 |
| B | 3 | 64 | 1582912 | 9774.85 | 839 | 817 | 161.9 |
| B | 4 | 239 | 492991 | 3040.86 | 839 | 817 | 161.9 |
| B | 11 | 51 | 91170 | 558.24 | 839 | 817 | 161.9 |
| C | 13 | 61 | 6181 | 27.4 | 835 | 841 | 194.9 |
| C | 14 | 234 | 3601 | 14.16 | 835 | 841 | 194.9 |
| C | 1 | 3 | 2981 | 10.98 | 835 | 841 | 194.9 |
| D | 1 | 52 | 274136 | 1261.52 | 813 | 794 | 216.7 |
| D | 13 | 104 | 47075 | 213.59 | 813 | 794 | 216.7 |
| D | 9 | 85 | 44821 | 203.19 | 813 | 794 | 216.7 |
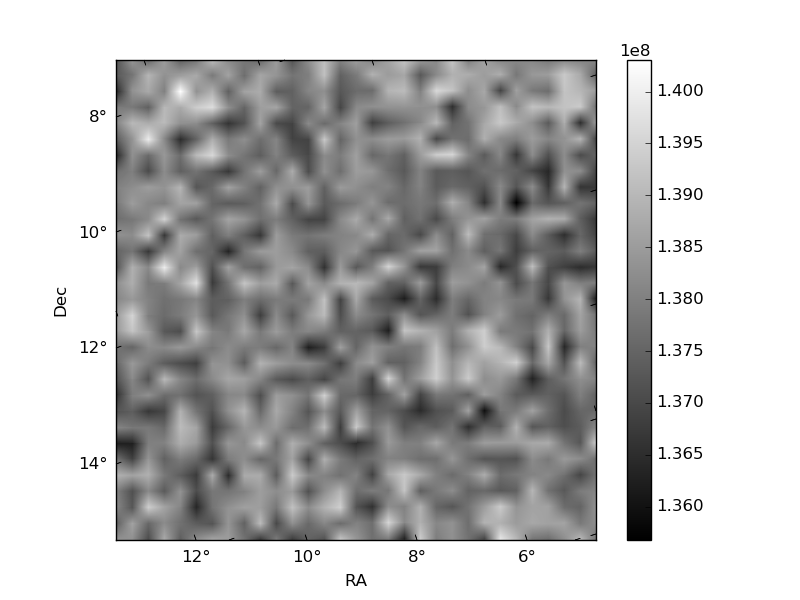
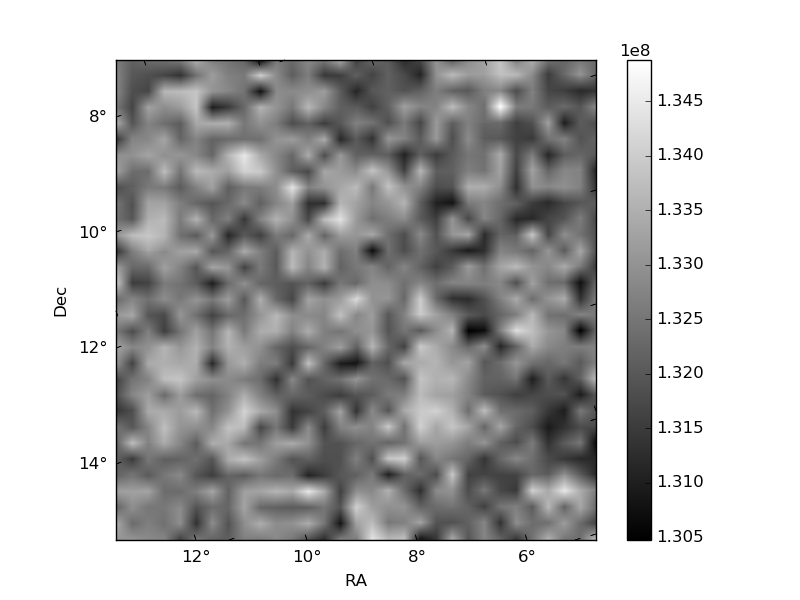
Histogram calculated using DETX and DETY for each event in the final _common_clean file
| Quadrant A |  |
 |
Quadrant B |
|---|---|---|---|
| Quadrant D |  |
 |
Quadrant C |
| Plot type | Count rate plots | Images |
|---|---|---|
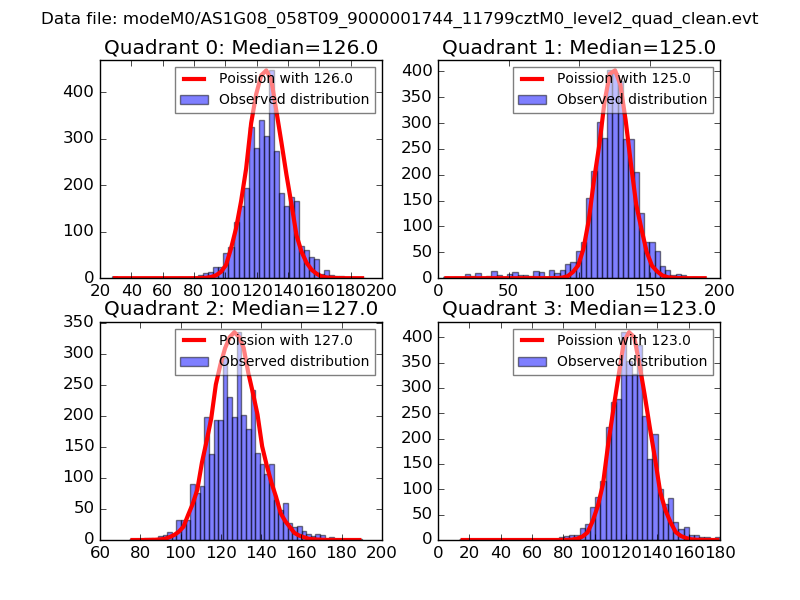
| Comparison with Poisson distribution Blue bars denote a histogram of data divided into 1 sec bins. Red curve is a Poisson curve with rate = median count rate of data. |
 |
 |
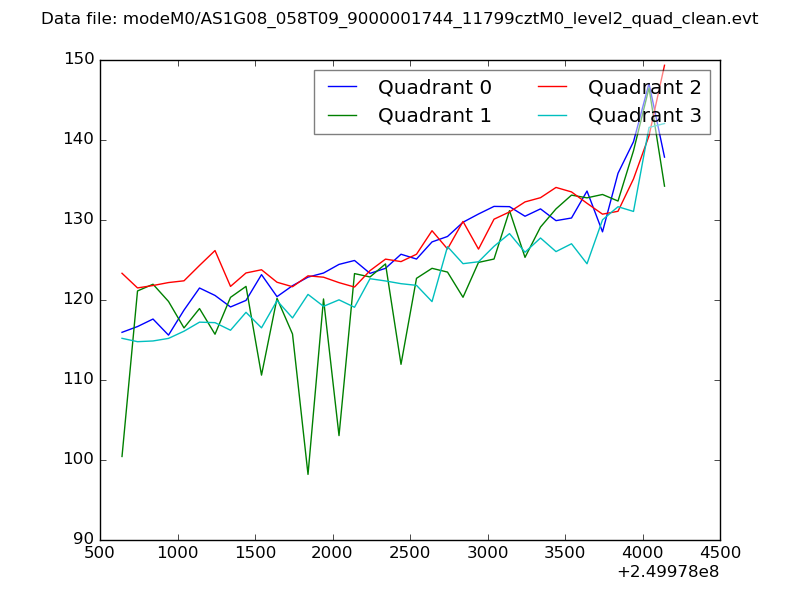
| Quadrant-wise count rates Data is divided into 100 sec bins |
 |
|
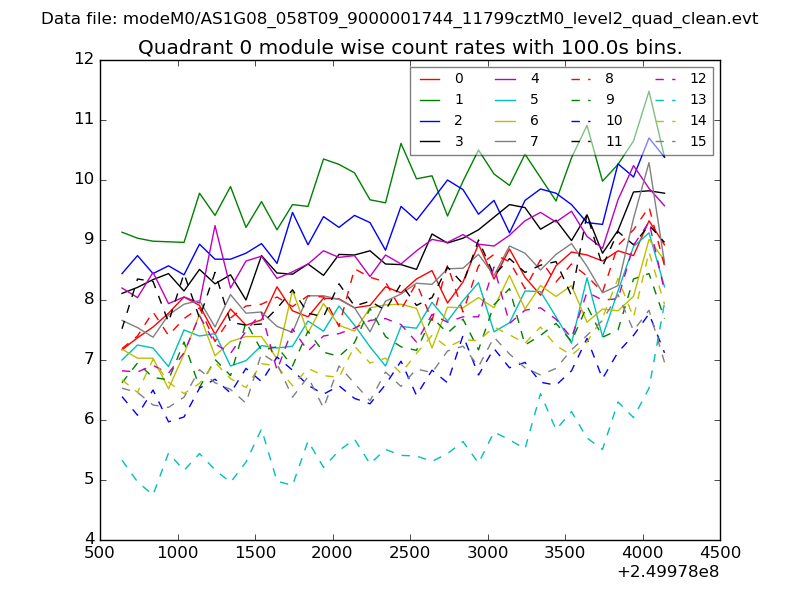
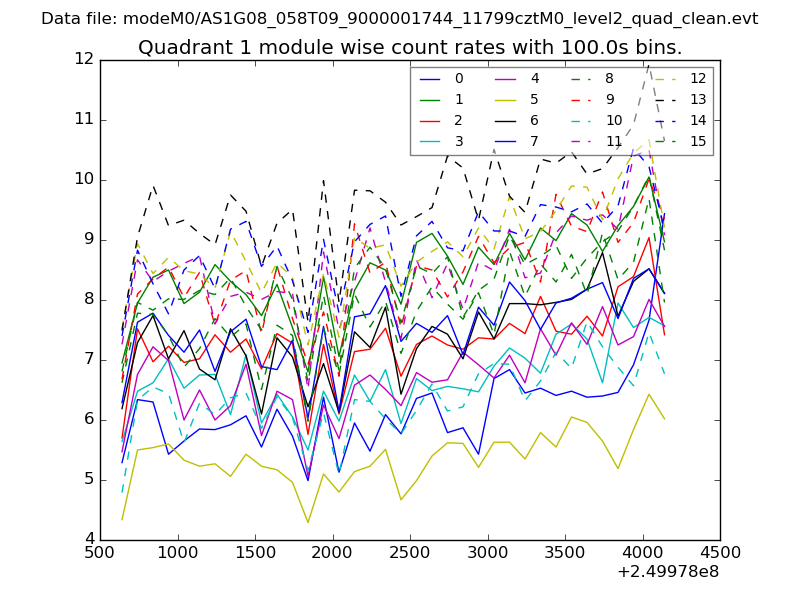
| Module-wise count rates for Quadrant A Data is divided into 100 sec bins |
 |
 |
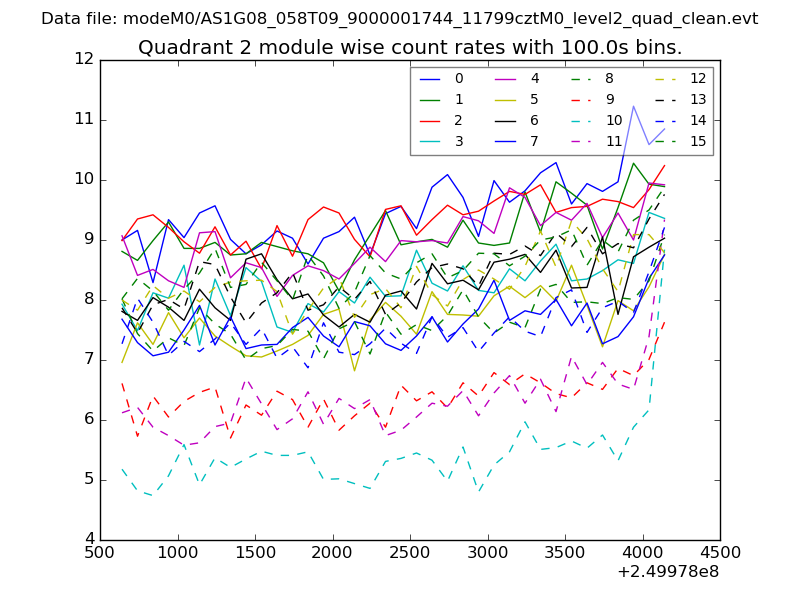
| Module-wise count rates for Quadrant B Data is divided into 100 sec bins |
 |
 |
| Module-wise count rates for Quadrant C Data is divided into 100 sec bins |
 |
 |
| Module-wise count rates for Quadrant D Data is divided into 100 sec bins |
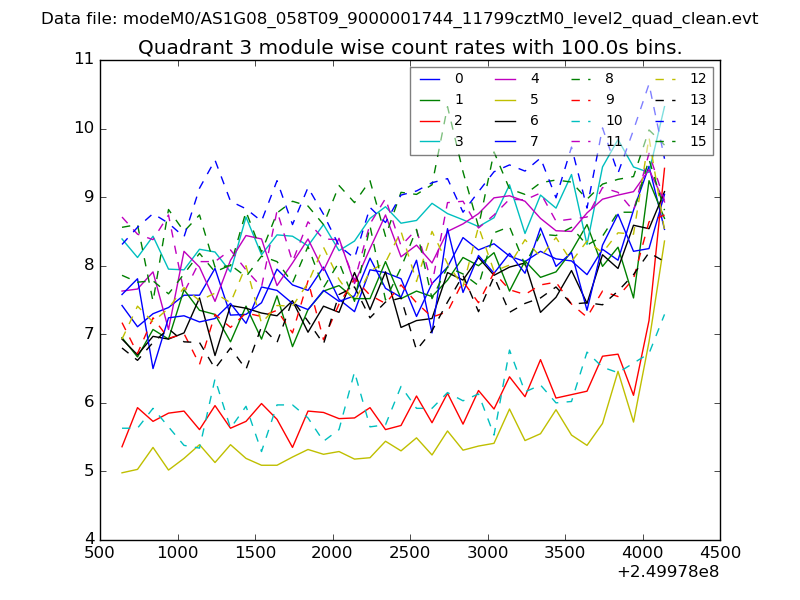 |
 |
| Parameter | Plot |
|---|---|
| CZT HV Monitor | 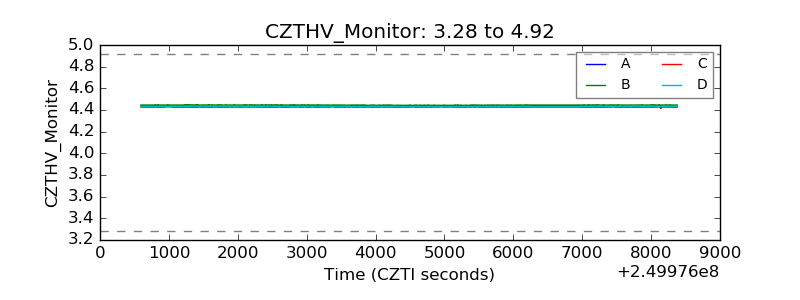 |
| D_VDD | 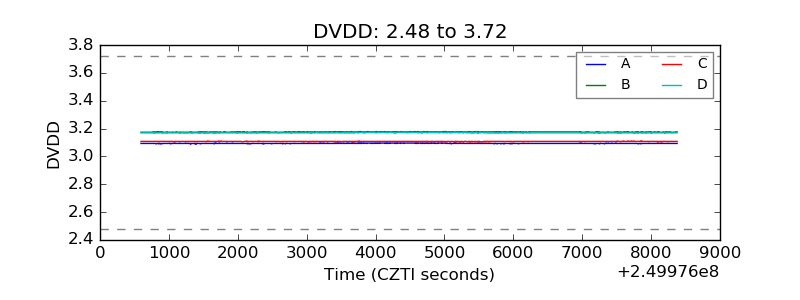 |
| Temperature 1 | 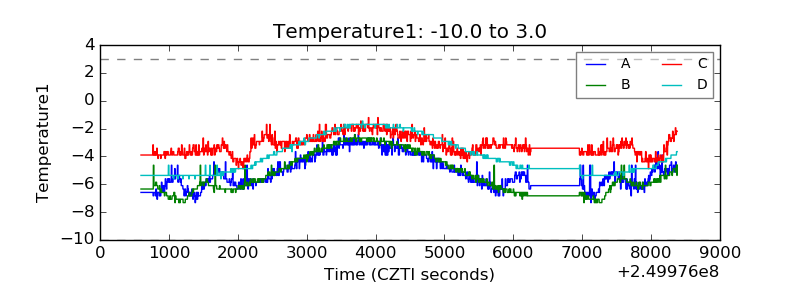 |
| Veto HV Monitor |  |
| Veto LLD | 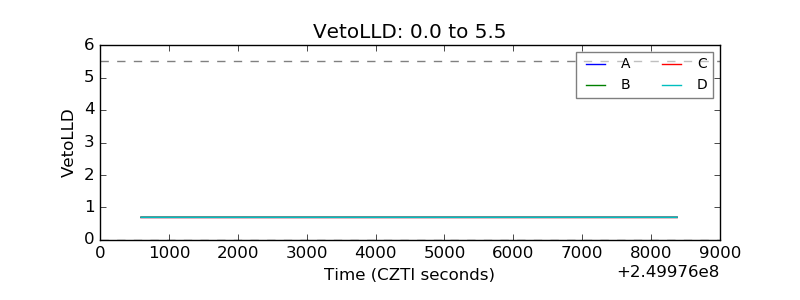 |
| Alpha Counter | 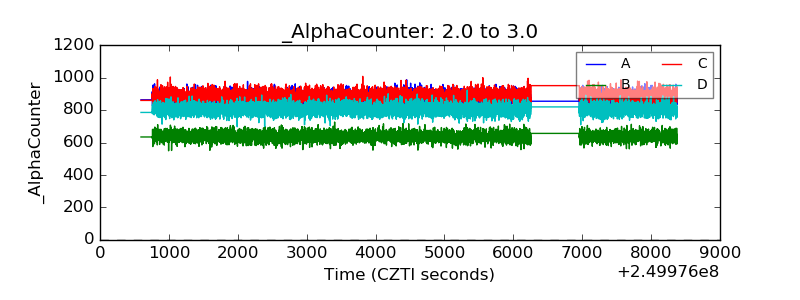 |
| _CPM_Rate | 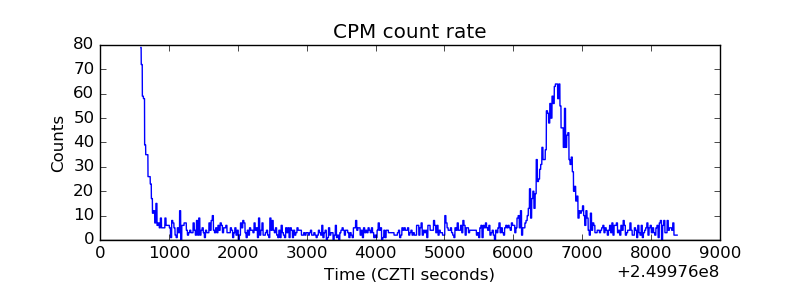 |
| CZT Counter | 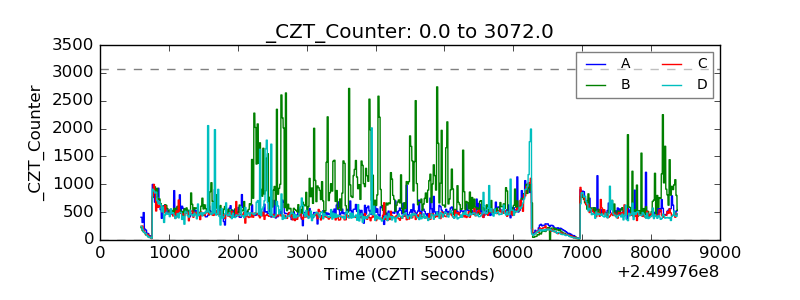 |
| +2.5 Volts monitor |  |
| +5 Volts monitor | 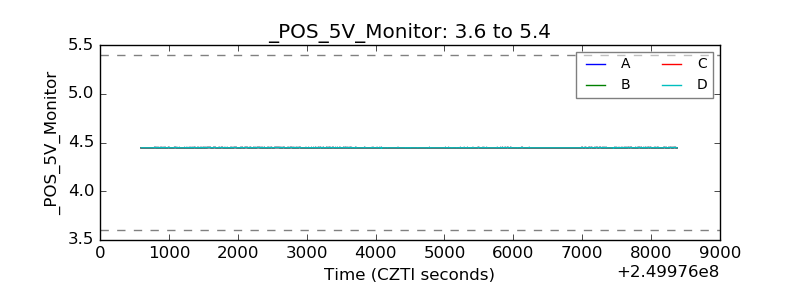 |
| _ROLL_ROT | 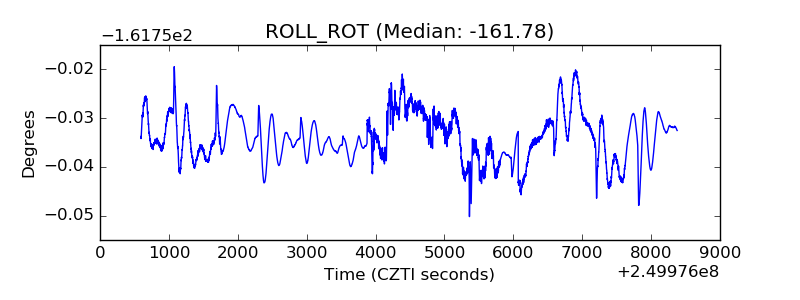 |
| _Roll_DEC |  |
| _Roll_RA | 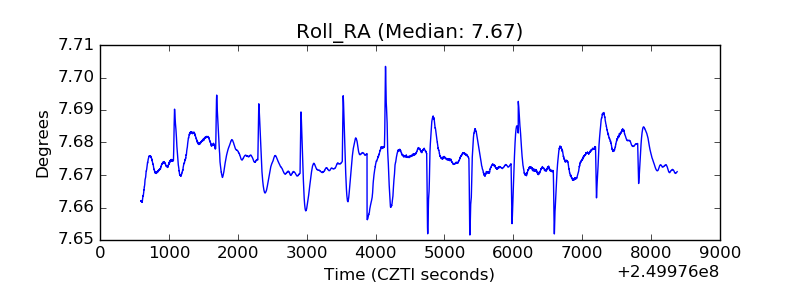 |
| Veto Counter | 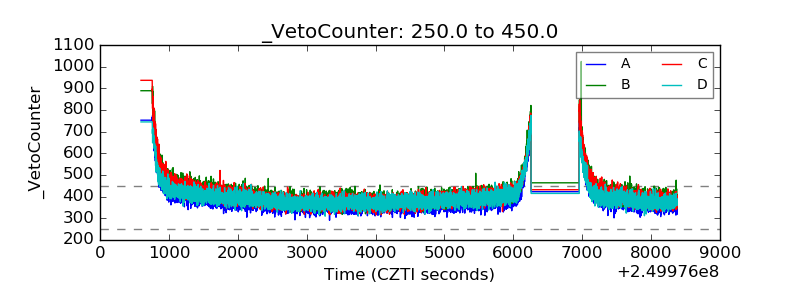 |