| Param | Original file | Final file |
|---|---|---|
| Filename | modeM0/AS1G08_058T09_9000001744_11804cztM0_level2.evt | modeM0/AS1G08_058T09_9000001744_11804cztM0_level2_quad_clean.evt |
| Size (bytes) | 647,864,640 | 106,672,320 |
| Size | 617.9 MB | 101.7 MB |
| Events in quadrant A | 4,103,158 | 676,829 |
| Events in quadrant B | 6,387,070 | 652,205 |
| Events in quadrant C | 3,673,129 | 688,717 |
| Events in quadrant D | 4,910,383 | 651,304 |
| Mode M9 | |||
|---|---|---|---|
| Quadrant | BADHDUFLAG | Total packets | Discarded packets |
| A | 0 | 7 | 0 |
| B | 0 | 7 | 0 |
| C | 0 | 7 | 0 |
| D | 0 | 7 | 0 |
| Mode M0 | |||
|---|---|---|---|
| Quadrant | BADHDUFLAG | Total packets | Discarded packets |
| A | 0 | 17290 | 2 |
| B | 0 | 24331 | 2 |
| C | 0 | 16628 | 2 |
| D | 0 | 19696 | 2 |
| Mode SS | |||
|---|---|---|---|
| Quadrant | BADHDUFLAG | Total packets | Discarded packets |
| A | 0 | 166 | 0 |
| B | 0 | 166 | 0 |
| C | 0 | 166 | 0 |
| D | 0 | 166 | 0 |
| Quadrant | Total seconds | Saturated seconds | Saturation percentage |
|---|---|---|---|
| A | 8073 | 204 | 2.526942% |
| B | 8073 | 601 | 7.444568% |
| C | 8073 | 97 | 1.201536% |
| D | 8073 | 259 | 3.208225% |
Noise dominated data is calculated using 1-second bins in cleaned event files. If a bin has >2000 counts, and if more than 50% of those come from <1% of pixels, then it is considered to be noise-dominated and hence unusable.
| Quadrant | # 1 sec bins | Bins with >0 counts | Bins with >2000 counts | High rate bins dominated by noise | Noise dominated (total time) | Noise dominated (detector-on time) | Marked lightcurve |
|---|---|---|---|---|---|---|---|
| A | 8804 | 8076 | 5 | 5 | 0.06% | 0.06% | 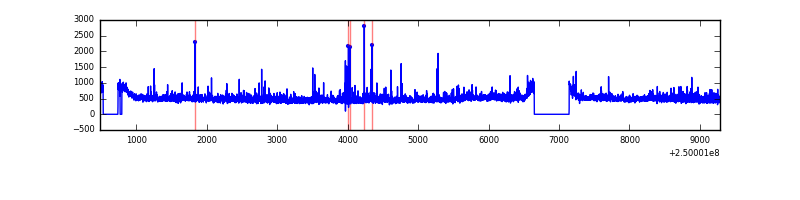 |
| B | 8804 | 8076 | 321 | 321 | 3.65% | 3.97% | 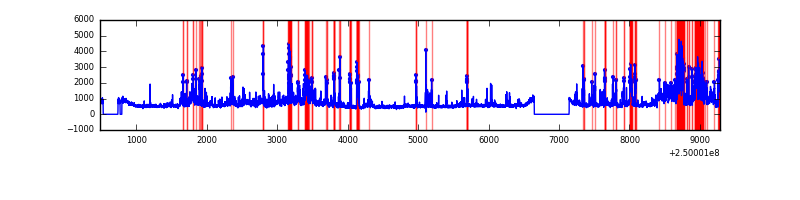 |
| C | 8804 | 8076 | 0 | 0 | 0.00% | 0.00% | 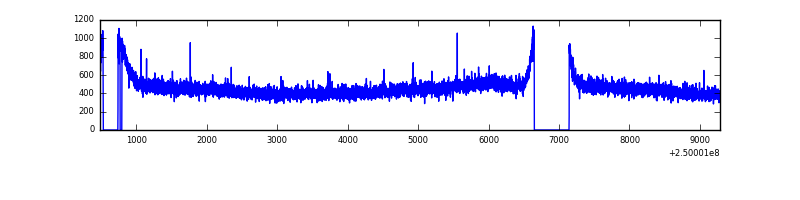 |
| D | 8804 | 8076 | 146 | 146 | 1.66% | 1.81% | 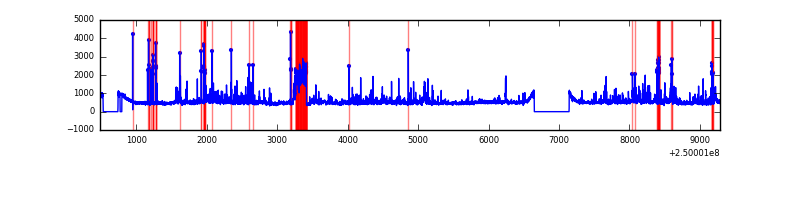 |
Top three noisy pixels from each quadrant. If the there are fewer than three noisy pixels in the level2.evt file, extra rows are filled as -1
| Pixel properties | Quadrant properties | ||||||
|---|---|---|---|---|---|---|---|
| Quadrant | DetID | PixID | Counts | Sigma | Mean | Median | Sigma |
| A | 1 | 162 | 135207 | 671.82 | 967 | 944 | 199.9 |
| A | 1 | 178 | 72206 | 356.58 | 967 | 944 | 199.9 |
| A | 1 | 161 | 62694 | 308.98 | 967 | 944 | 199.9 |
| B | 4 | 239 | 941146 | 5168.01 | 945 | 917 | 181.9 |
| B | 15 | 185 | 806522 | 4428.04 | 945 | 917 | 181.9 |
| B | 3 | 64 | 594026 | 3260.05 | 945 | 917 | 181.9 |
| C | 13 | 61 | 6892 | 27.31 | 940 | 945 | 217.8 |
| C | 1 | 3 | 4179 | 14.85 | 940 | 945 | 217.8 |
| C | 12 | 4 | 3605 | 12.21 | 940 | 945 | 217.8 |
| D | 1 | 52 | 359811 | 1579.09 | 938 | 912 | 227.3 |
| D | 13 | 249 | 335213 | 1470.86 | 938 | 912 | 227.3 |
| D | 2 | 136 | 213263 | 934.31 | 938 | 912 | 227.3 |
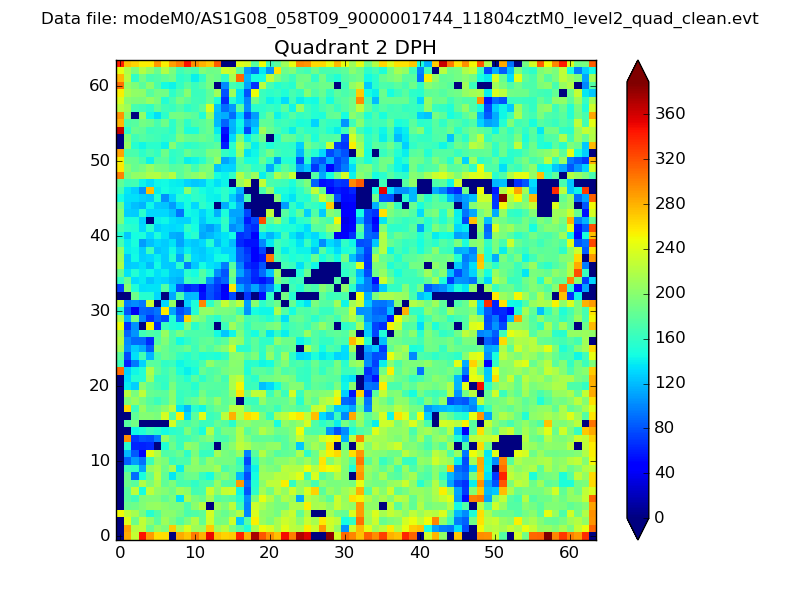
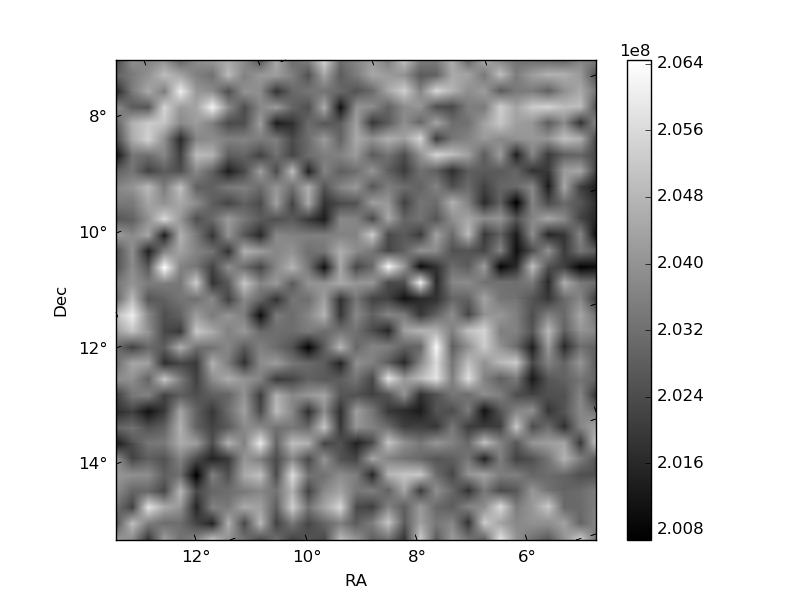
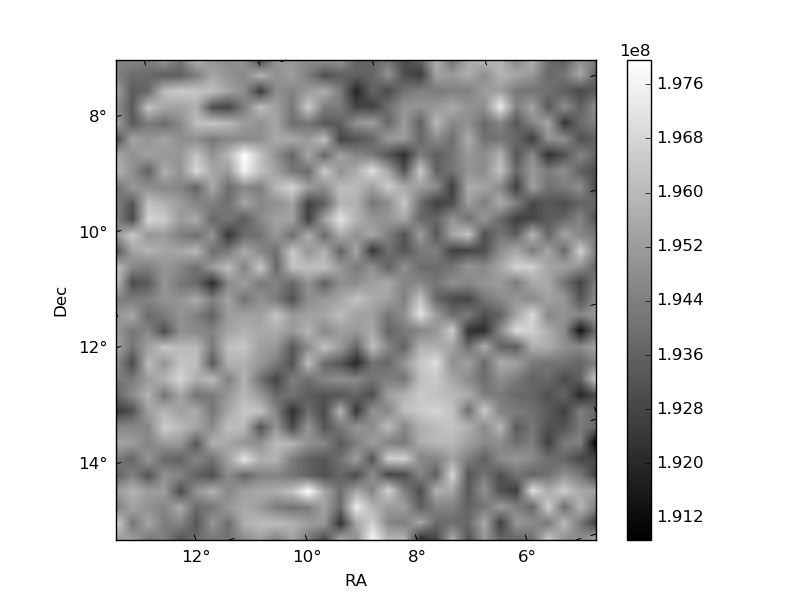
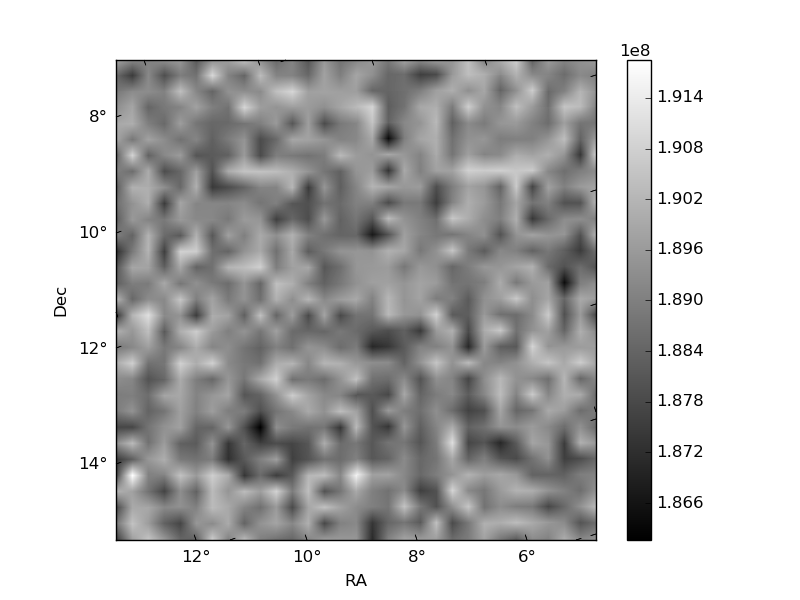
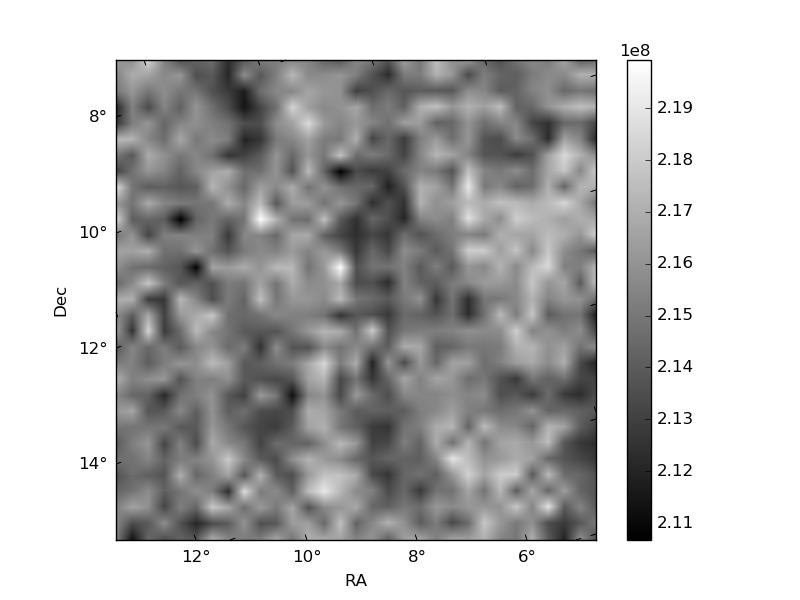
Histogram calculated using DETX and DETY for each event in the final _common_clean file
| Quadrant A |  |
 |
Quadrant B |
|---|---|---|---|
| Quadrant D | 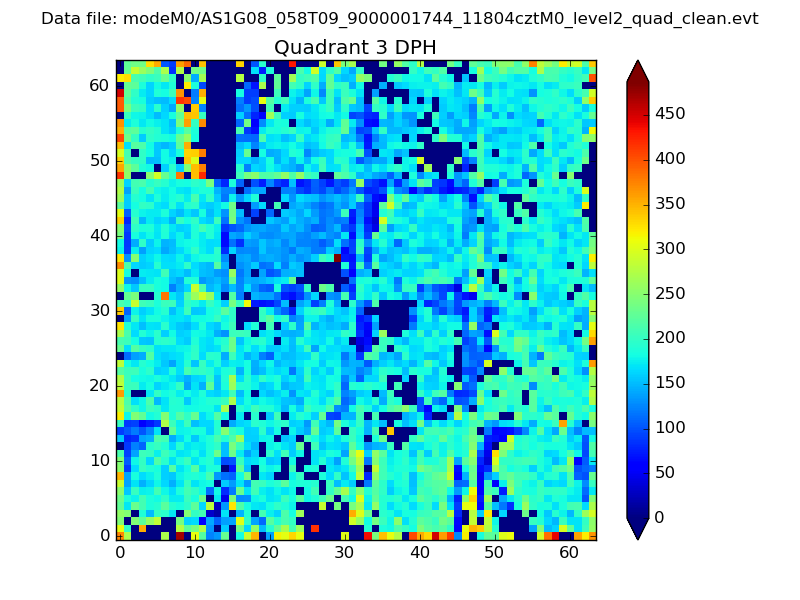 |
 |
Quadrant C |
| Plot type | Count rate plots | Images |
|---|---|---|
| Comparison with Poisson distribution Blue bars denote a histogram of data divided into 1 sec bins. Red curve is a Poisson curve with rate = median count rate of data. |
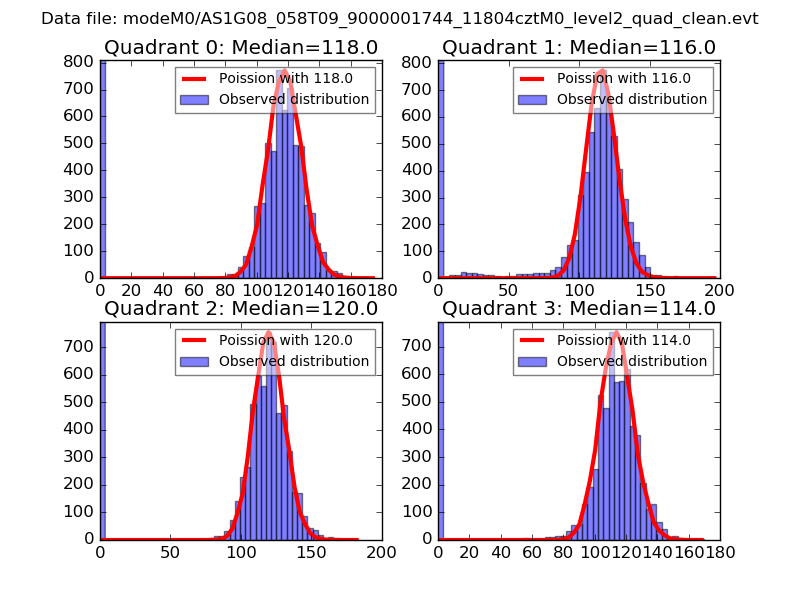 |
 |
| Quadrant-wise count rates Data is divided into 100 sec bins |
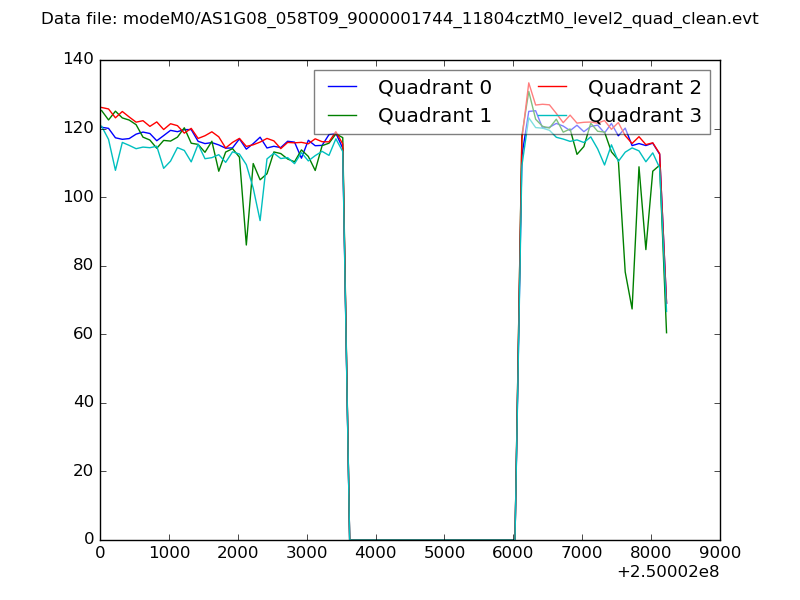 |
|
| Module-wise count rates for Quadrant A Data is divided into 100 sec bins |
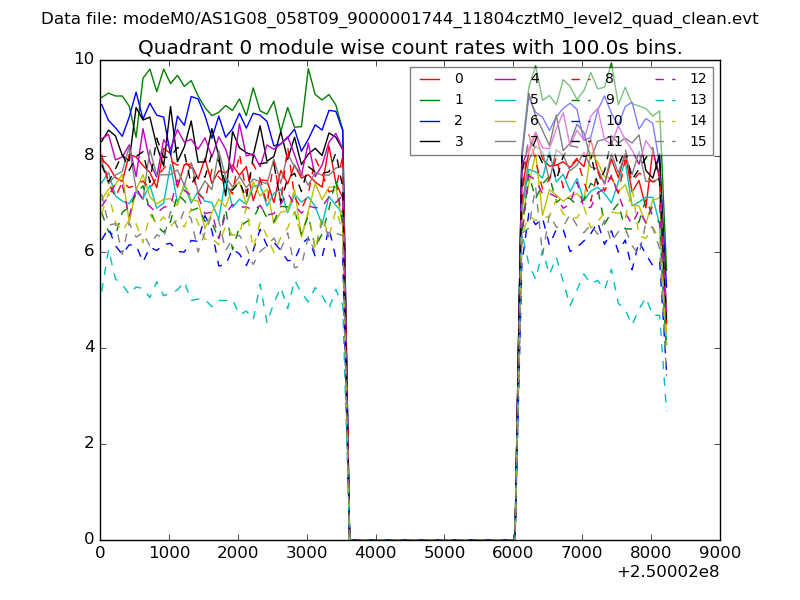 |
 |
| Module-wise count rates for Quadrant B Data is divided into 100 sec bins |
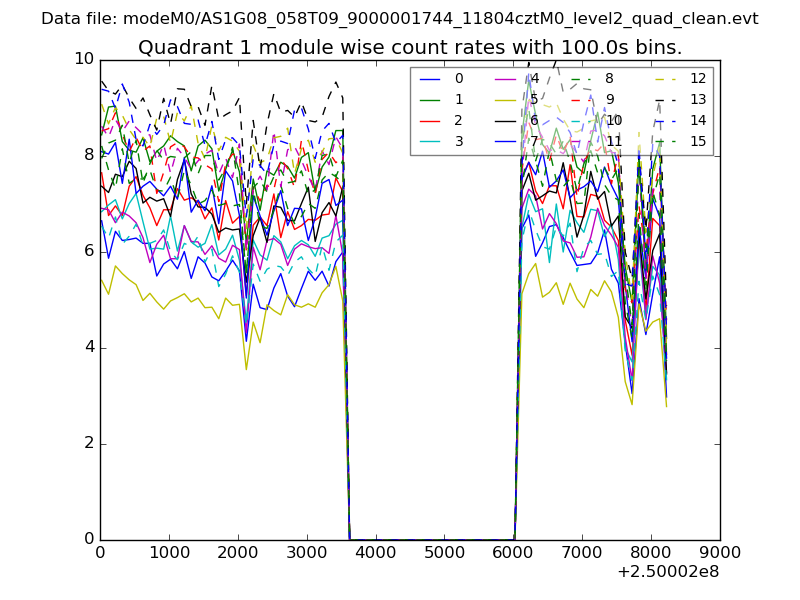 |
 |
| Module-wise count rates for Quadrant C Data is divided into 100 sec bins |
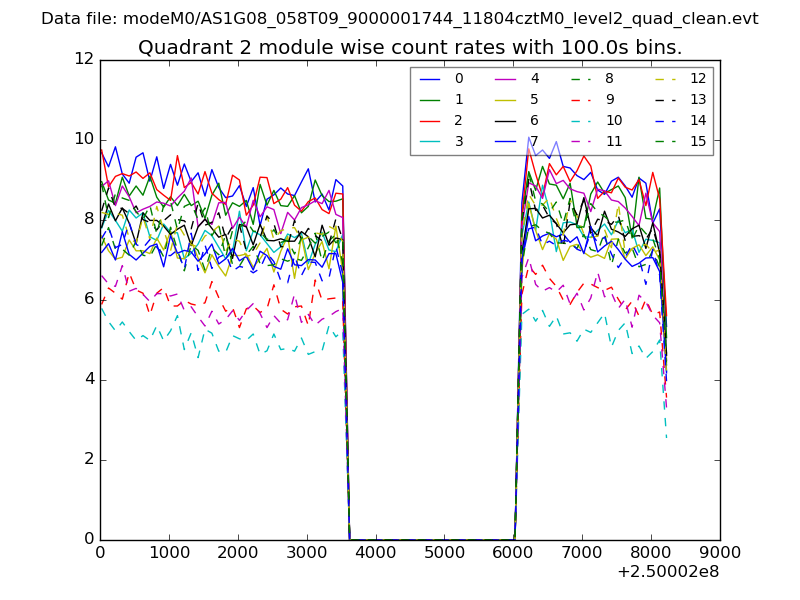 |
 |
| Module-wise count rates for Quadrant D Data is divided into 100 sec bins |
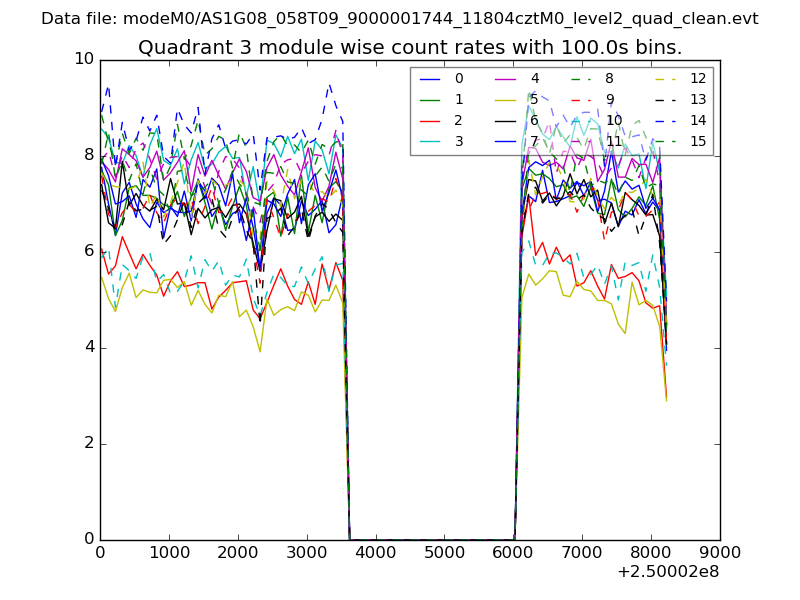 |
 |
| Parameter | Plot |
|---|---|
| CZT HV Monitor | 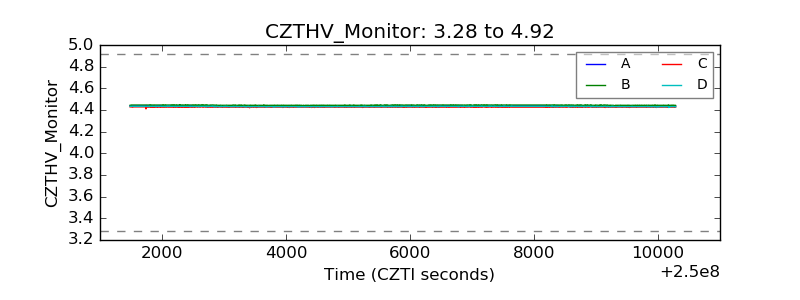 |
| D_VDD | 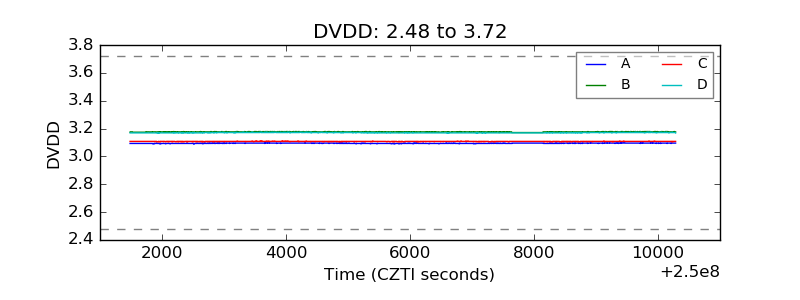 |
| Temperature 1 | 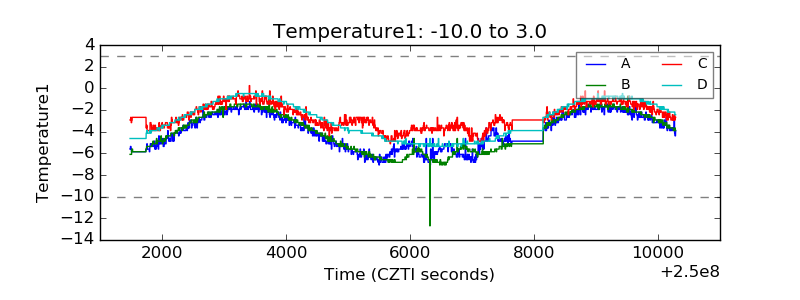 |
| Veto HV Monitor | 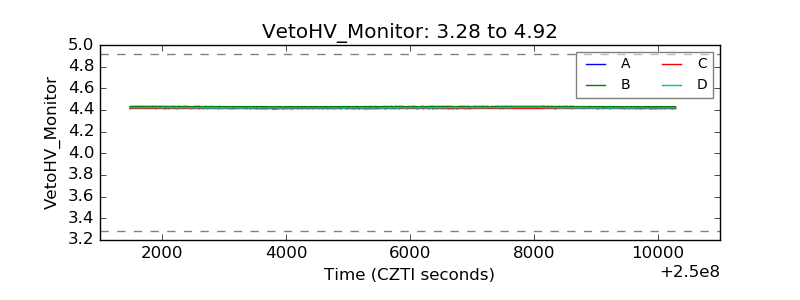 |
| Veto LLD | 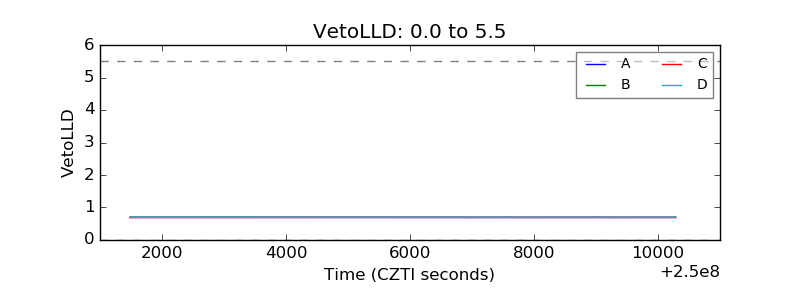 |
| Alpha Counter | 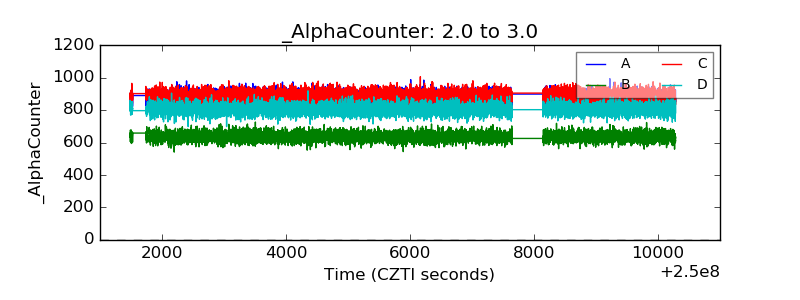 |
| _CPM_Rate | 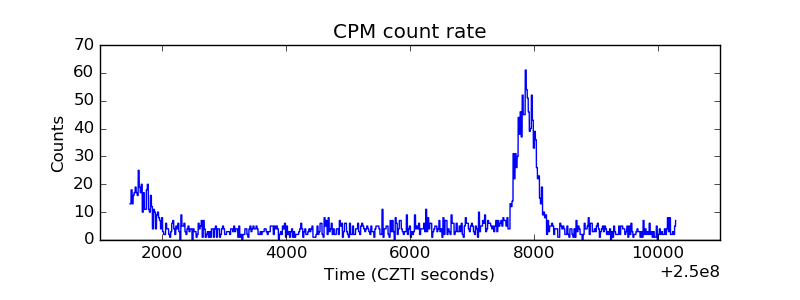 |
| CZT Counter | 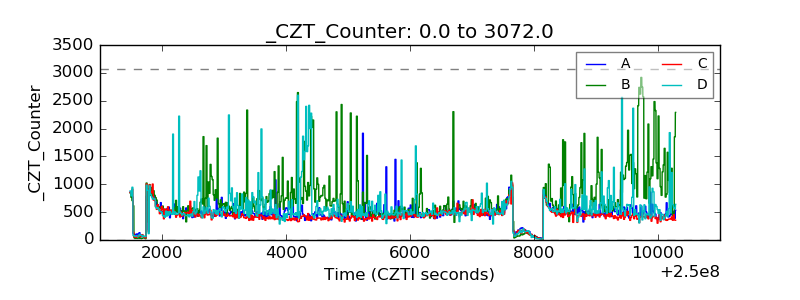 |
| +2.5 Volts monitor |  |
| +5 Volts monitor | 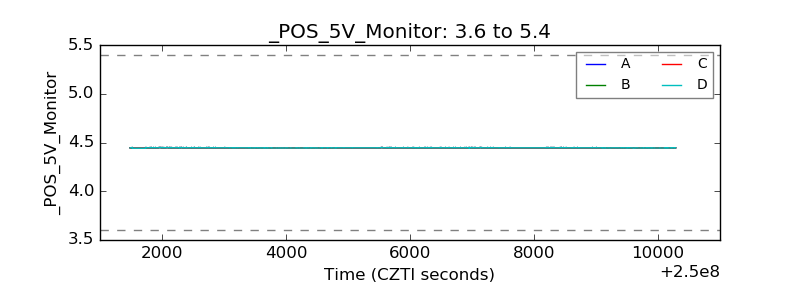 |
| _ROLL_ROT | 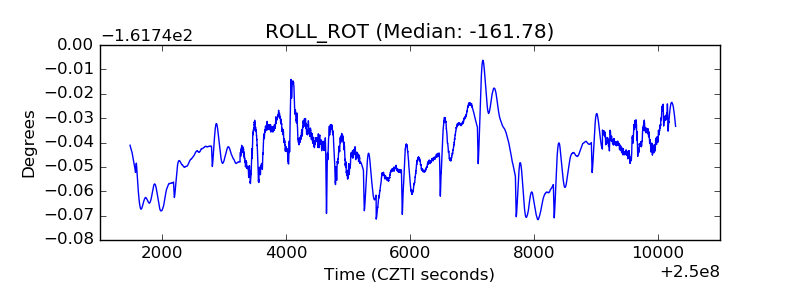 |
| _Roll_DEC | 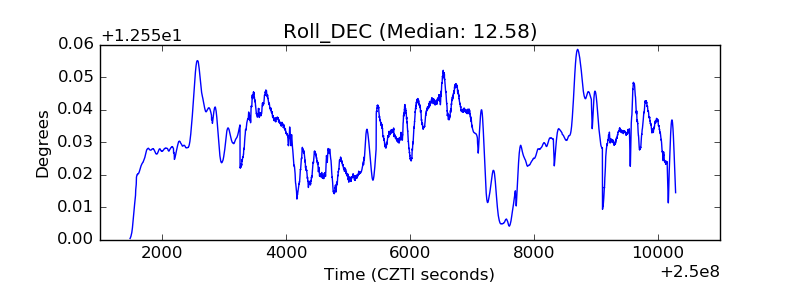 |
| _Roll_RA | 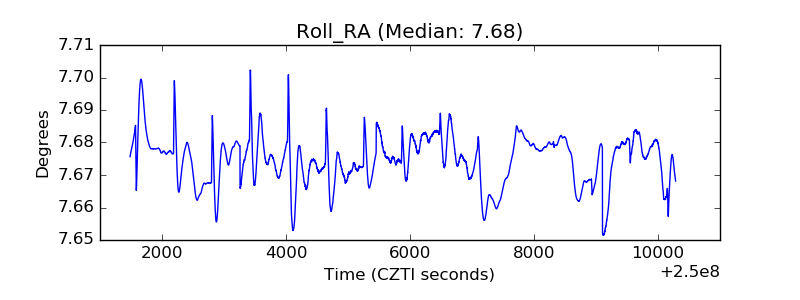 |
| Veto Counter | 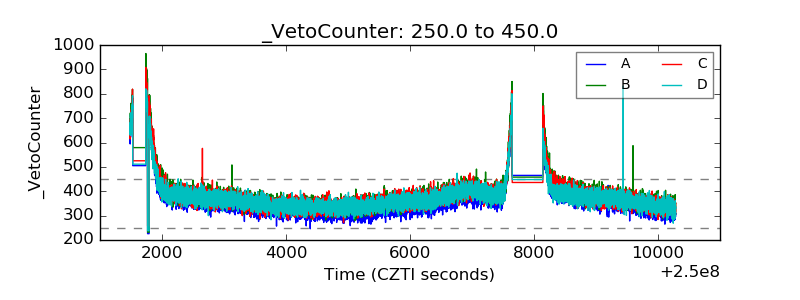 |