| Param | Original file | Final file |
|---|---|---|
| Filename | modeM0/AS1A04_022T04_9000001746_11804cztM0_level2.evt | modeM0/AS1A04_022T04_9000001746_11804cztM0_level2_quad_clean.evt |
| Size (bytes) | 328,374,720 | 49,268,160 |
| Size | 313.2 MB | 47.0 MB |
| Events in quadrant A | 2,190,557 | 298,286 |
| Events in quadrant B | 2,660,355 | 296,863 |
| Events in quadrant C | 2,003,009 | 303,288 |
| Events in quadrant D | 2,790,115 | 282,793 |
| Mode SS | |||
|---|---|---|---|
| Quadrant | BADHDUFLAG | Total packets | Discarded packets |
| A | 0 | 90 | 0 |
| B | 0 | 90 | 0 |
| C | 0 | 90 | 0 |
| D | 0 | 90 | 0 |
| Mode M9 | |||
|---|---|---|---|
| Quadrant | BADHDUFLAG | Total packets | Discarded packets |
| A | 0 | 7 | 0 |
| B | 0 | 7 | 0 |
| C | 0 | 7 | 0 |
| D | 0 | 7 | 0 |
| Mode M0 | |||
|---|---|---|---|
| Quadrant | BADHDUFLAG | Total packets | Discarded packets |
| A | 0 | 9399 | 2 |
| B | 0 | 10711 | 1 |
| C | 0 | 9016 | 1 |
| D | 0 | 11201 | 1 |
| Quadrant | Total seconds | Saturated seconds | Saturation percentage |
|---|---|---|---|
| A | 4409 | 65 | 1.474257% |
| B | 4409 | 138 | 3.129961% |
| C | 4409 | 37 | 0.839193% |
| D | 4409 | 226 | 5.125879% |
Noise dominated data is calculated using 1-second bins in cleaned event files. If a bin has >2000 counts, and if more than 50% of those come from <1% of pixels, then it is considered to be noise-dominated and hence unusable.
| Quadrant | # 1 sec bins | Bins with >0 counts | Bins with >2000 counts | High rate bins dominated by noise | Noise dominated (total time) | Noise dominated (detector-on time) | Marked lightcurve |
|---|---|---|---|---|---|---|---|
| A | 5085 | 4411 | 1 | 1 | 0.02% | 0.02% | 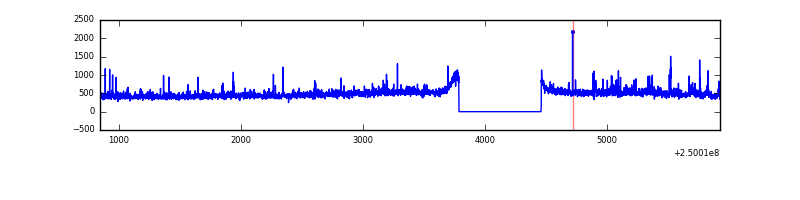 |
| B | 5085 | 4411 | 44 | 44 | 0.87% | 1.00% | 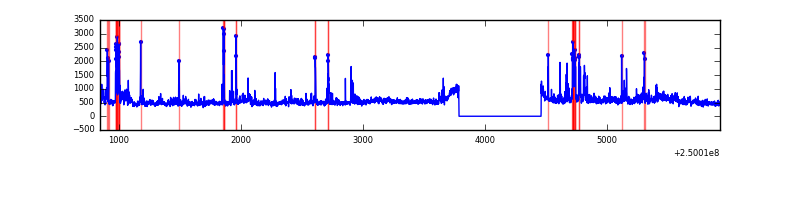 |
| C | 5085 | 4411 | 0 | 0 | 0.00% | 0.00% | 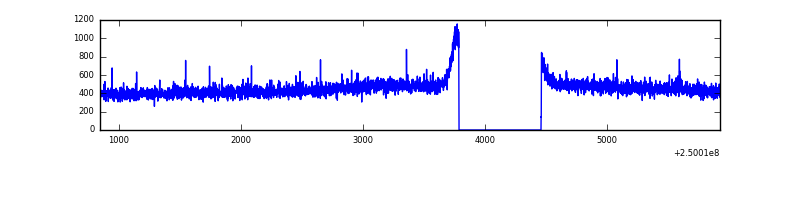 |
| D | 5085 | 4411 | 157 | 157 | 3.09% | 3.56% | 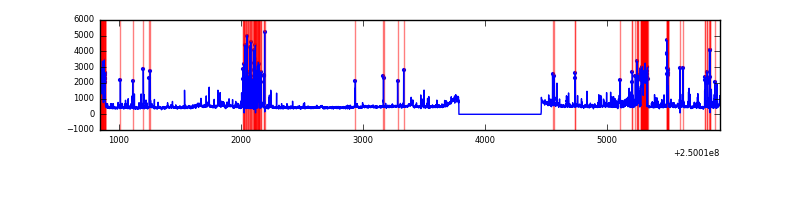 |
Top three noisy pixels from each quadrant. If the there are fewer than three noisy pixels in the level2.evt file, extra rows are filled as -1
| Pixel properties | Quadrant properties | ||||||
|---|---|---|---|---|---|---|---|
| Quadrant | DetID | PixID | Counts | Sigma | Mean | Median | Sigma |
| A | 1 | 162 | 64577 | 590.54 | 524 | 513 | 108.5 |
| A | 1 | 178 | 34814 | 316.18 | 524 | 513 | 108.5 |
| A | 1 | 161 | 29447 | 266.71 | 524 | 513 | 108.5 |
| B | 4 | 239 | 304576 | 2994.02 | 522 | 507 | 101.6 |
| B | 10 | 16 | 109819 | 1076.34 | 522 | 507 | 101.6 |
| B | 15 | 185 | 92426 | 905.08 | 522 | 507 | 101.6 |
| C | 13 | 61 | 3849 | 27.35 | 512 | 515 | 121.9 |
| C | 1 | 16 | 2719 | 18.08 | 512 | 515 | 121.9 |
| C | 8 | 208 | 2381 | 15.31 | 512 | 515 | 121.9 |
| D | 1 | 52 | 523607 | 4287.03 | 500 | 486 | 122.0 |
| D | 9 | 85 | 154458 | 1261.82 | 500 | 486 | 122.0 |
| D | 2 | 136 | 50244 | 407.77 | 500 | 486 | 122.0 |
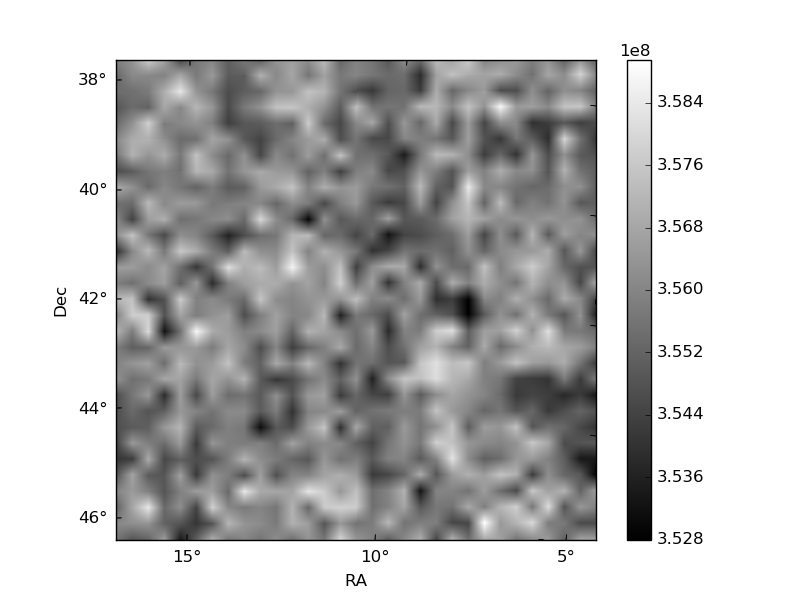
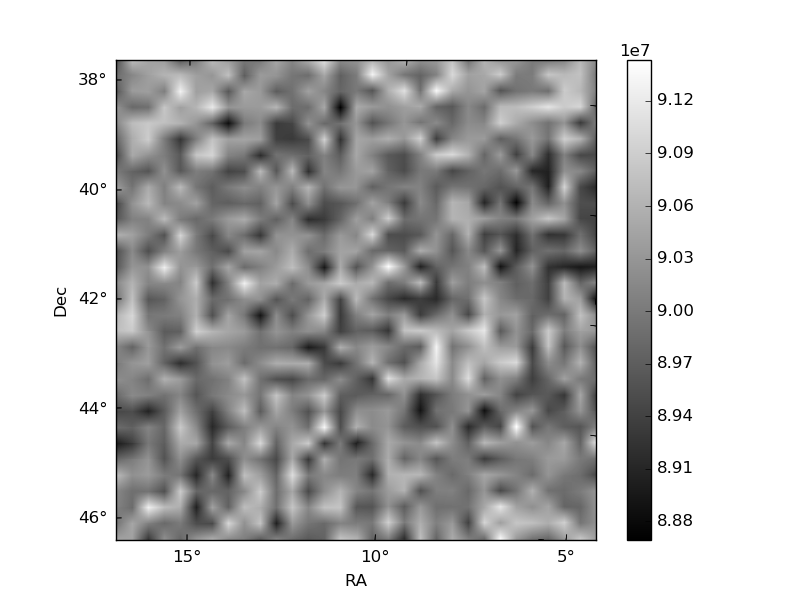
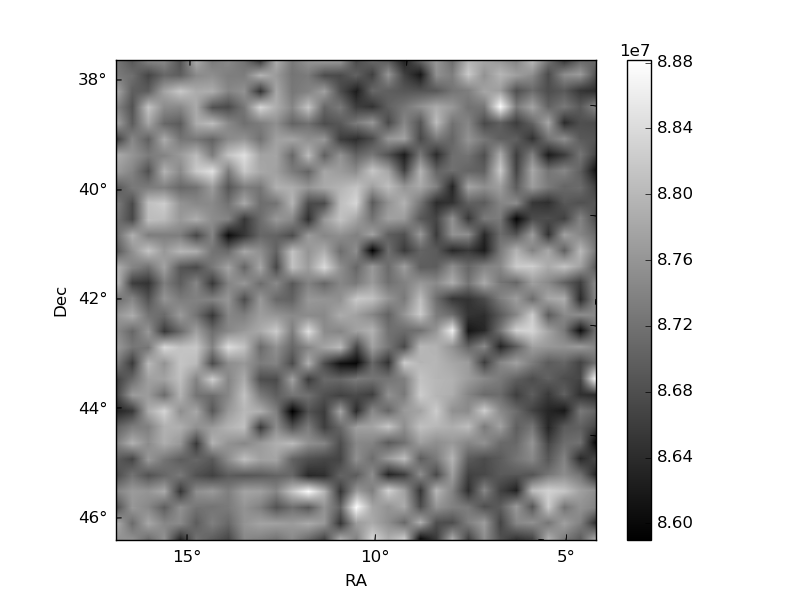
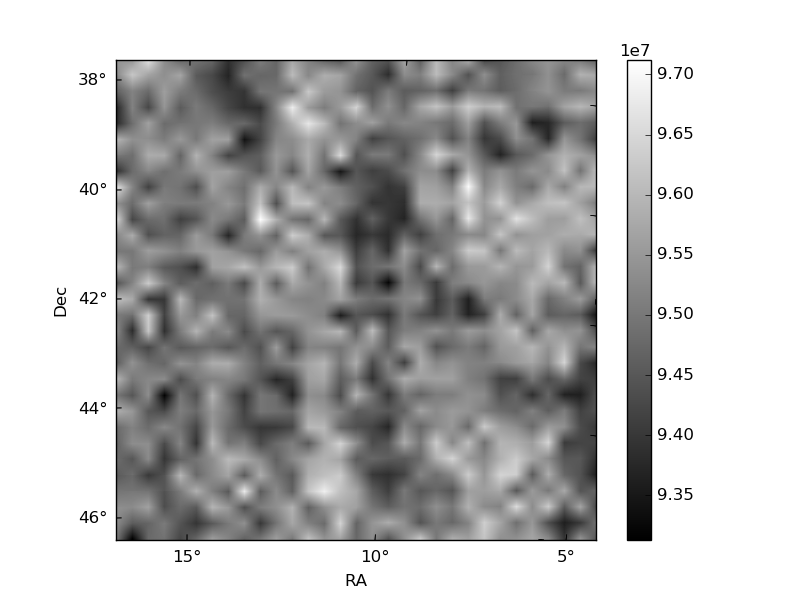
Histogram calculated using DETX and DETY for each event in the final _common_clean file
| Quadrant A | 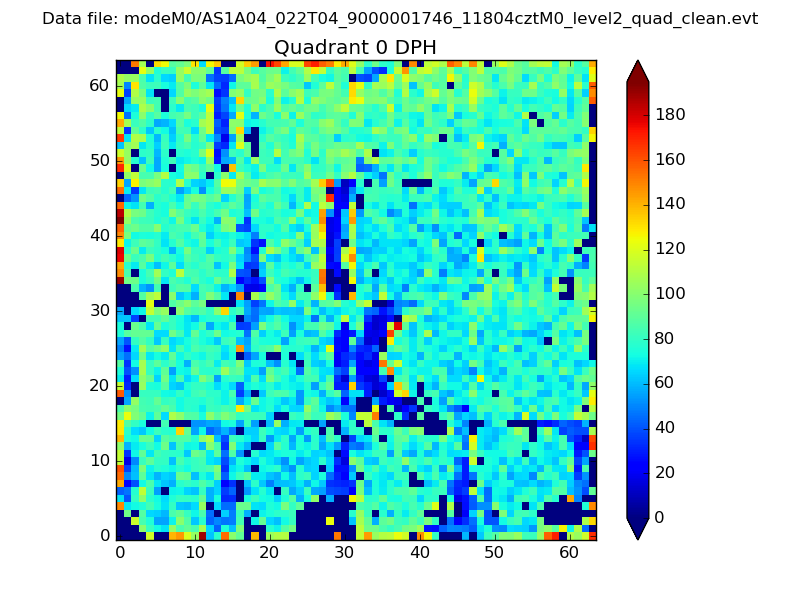 |
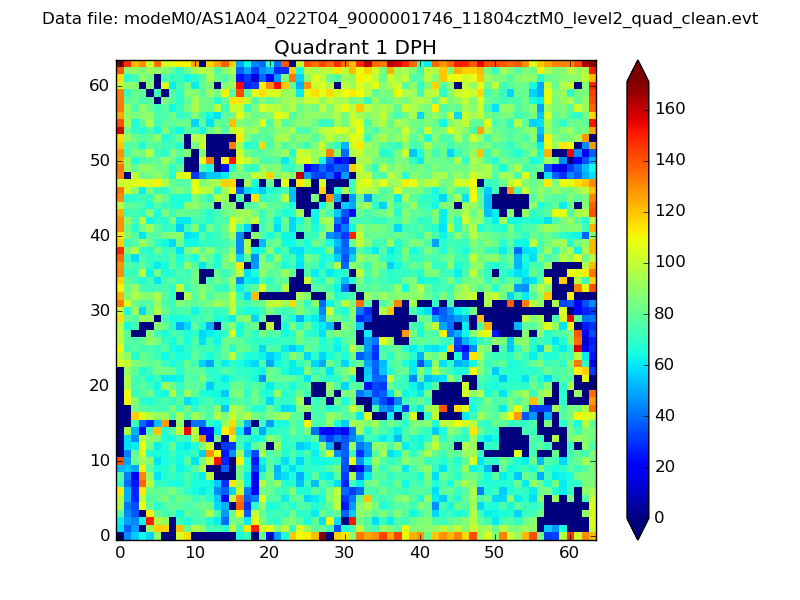 |
Quadrant B |
|---|---|---|---|
| Quadrant D | 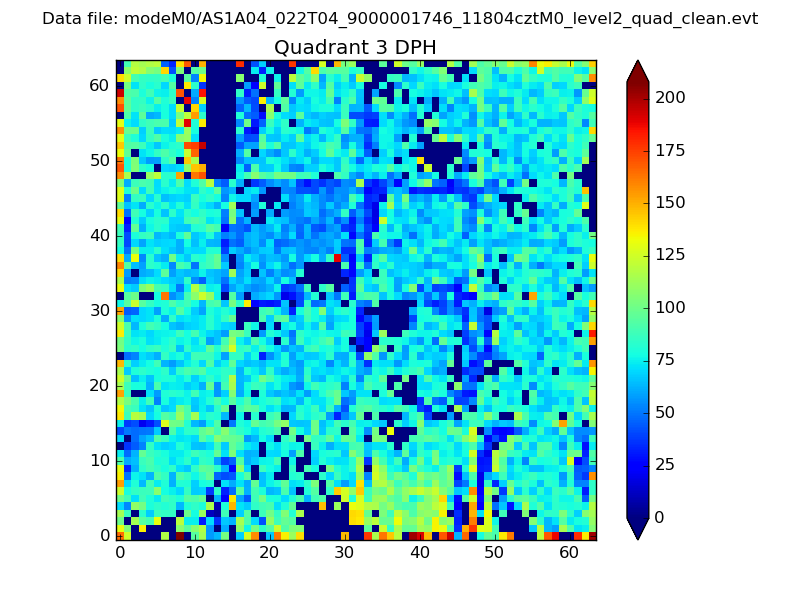 |
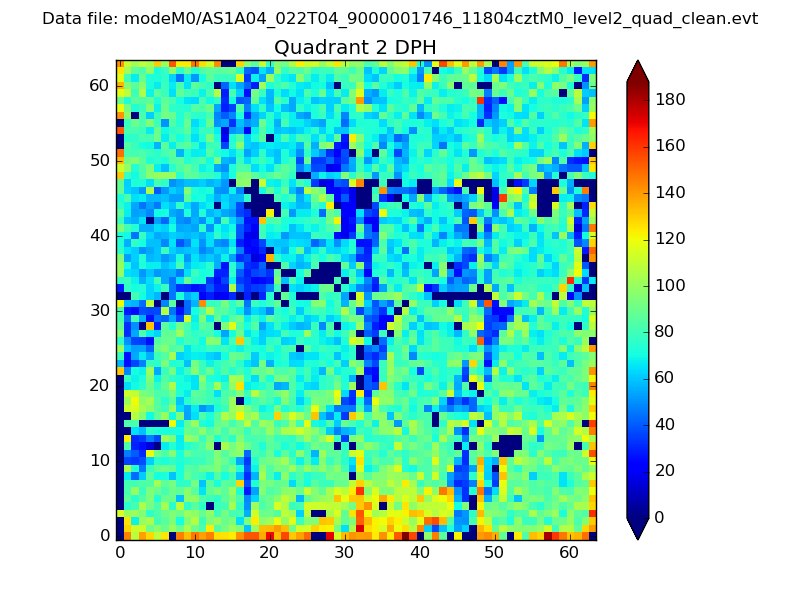 |
Quadrant C |
| Plot type | Count rate plots | Images |
|---|---|---|
| Comparison with Poisson distribution Blue bars denote a histogram of data divided into 1 sec bins. Red curve is a Poisson curve with rate = median count rate of data. |
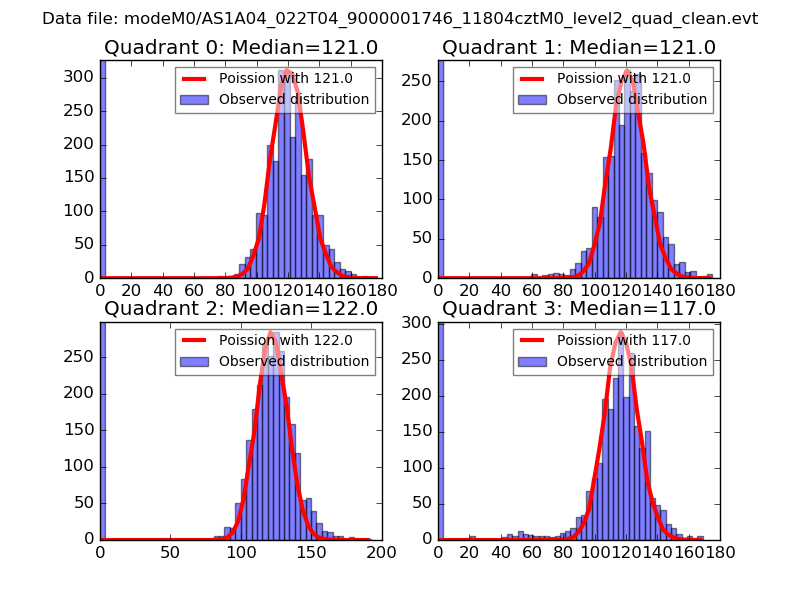 |
 |
| Quadrant-wise count rates Data is divided into 100 sec bins |
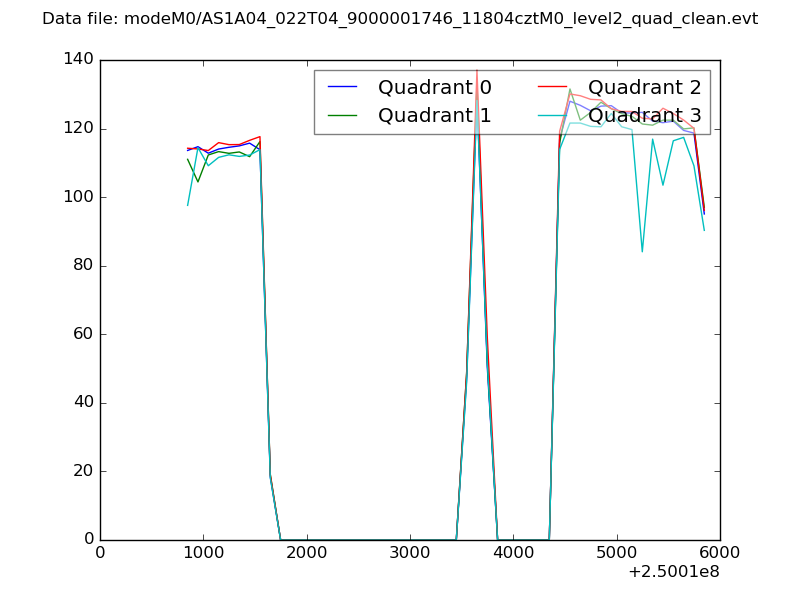 |
|
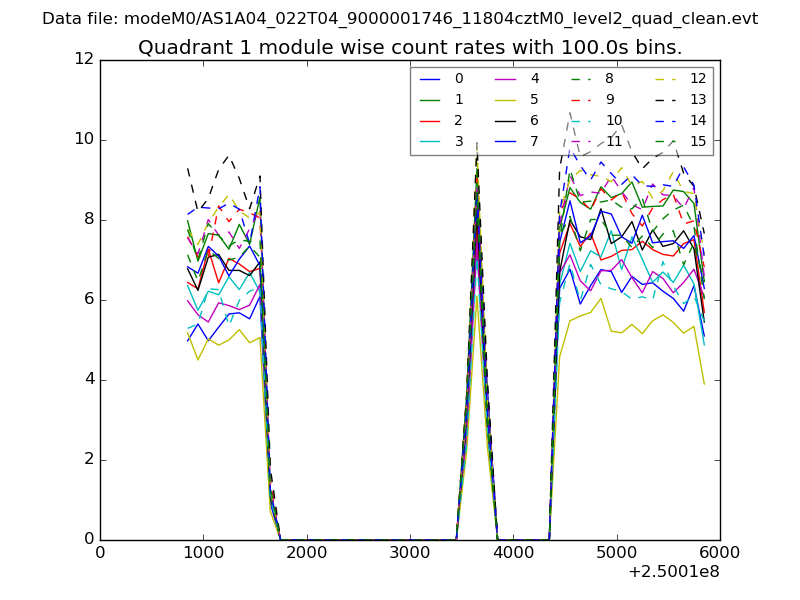
| Module-wise count rates for Quadrant A Data is divided into 100 sec bins |
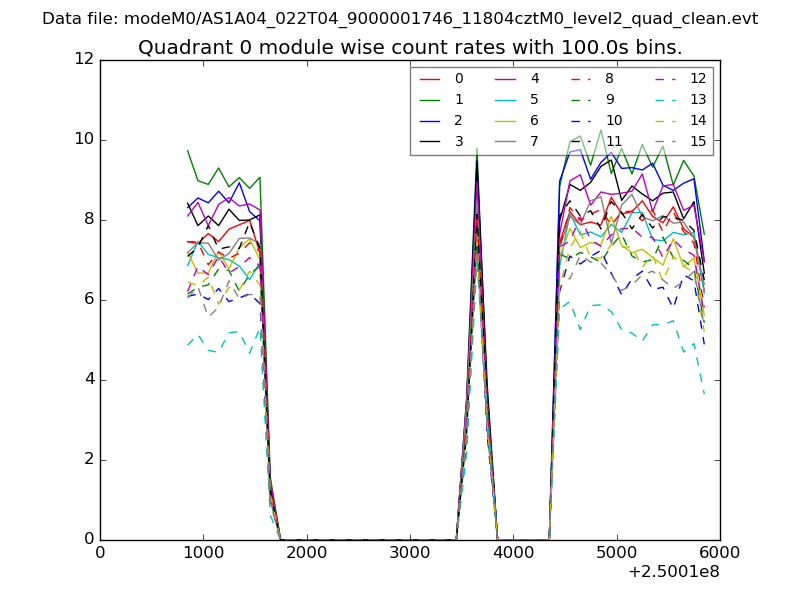 |
 |
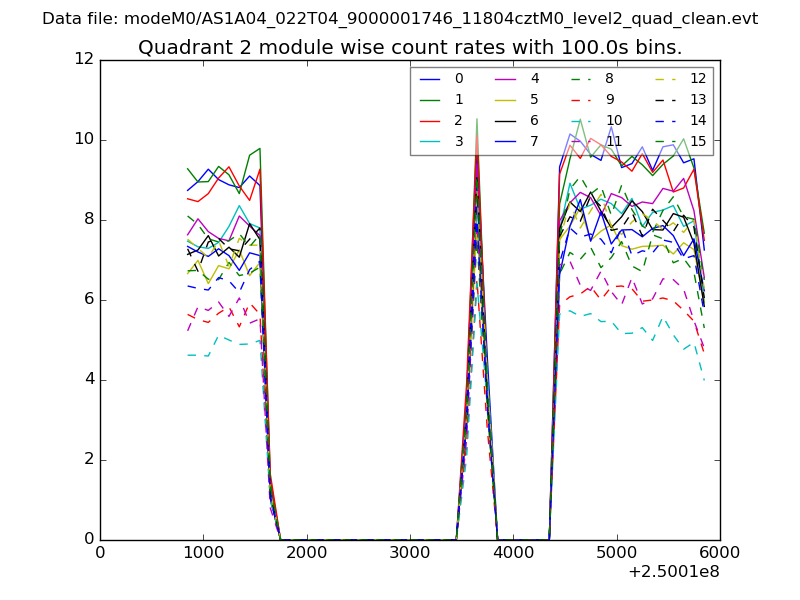
| Module-wise count rates for Quadrant B Data is divided into 100 sec bins |
 |
 |
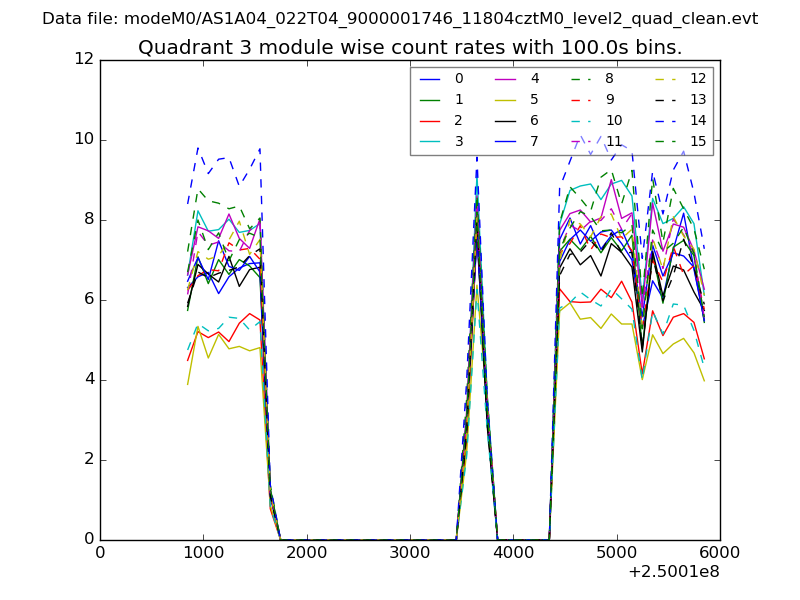
| Module-wise count rates for Quadrant C Data is divided into 100 sec bins |
 |
 |
| Module-wise count rates for Quadrant D Data is divided into 100 sec bins |
 |
 |
| Parameter | Plot |
|---|---|
| CZT HV Monitor | 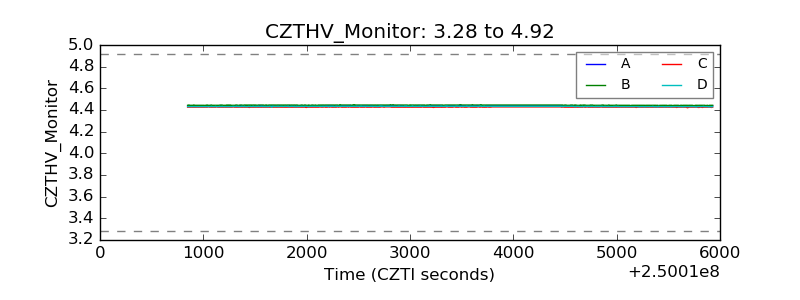 |
| D_VDD | 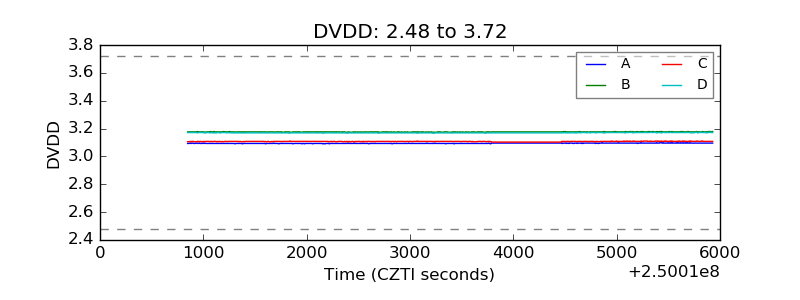 |
| Temperature 1 |  |
| Veto HV Monitor | 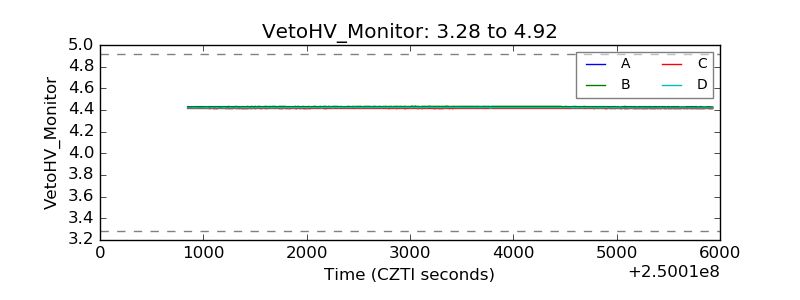 |
| Veto LLD | 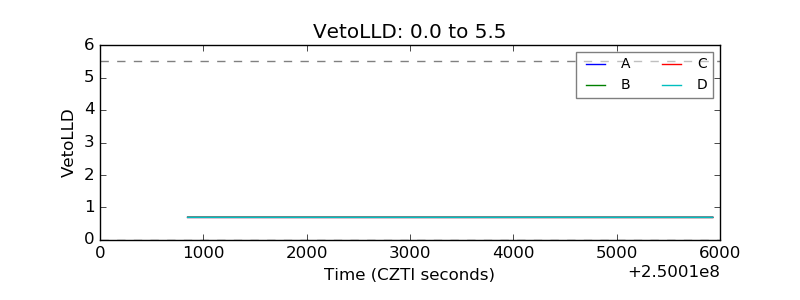 |
| Alpha Counter | 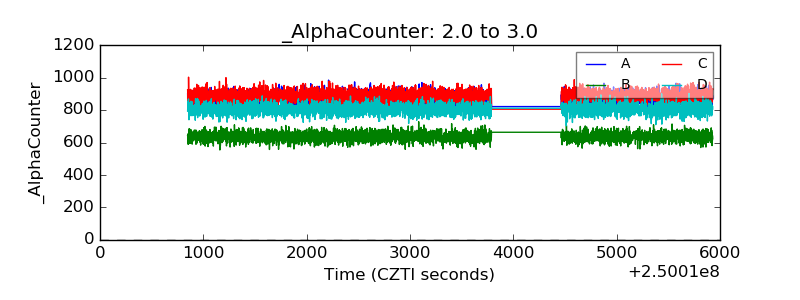 |
| _CPM_Rate | 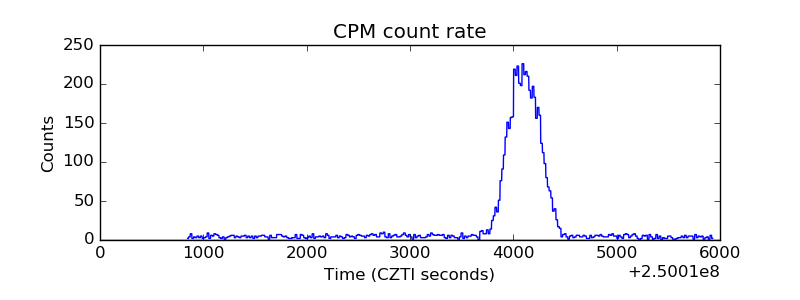 |
| CZT Counter | 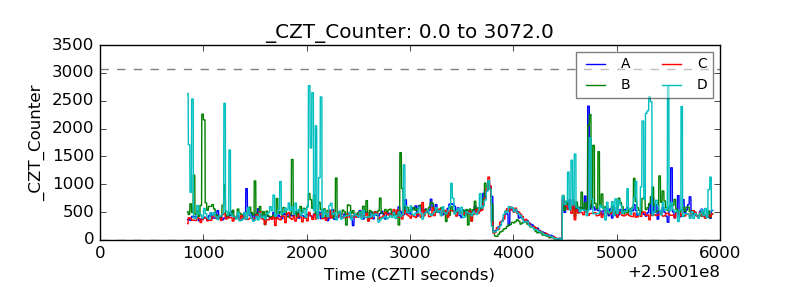 |
| +2.5 Volts monitor |  |
| +5 Volts monitor |  |
| _ROLL_ROT | 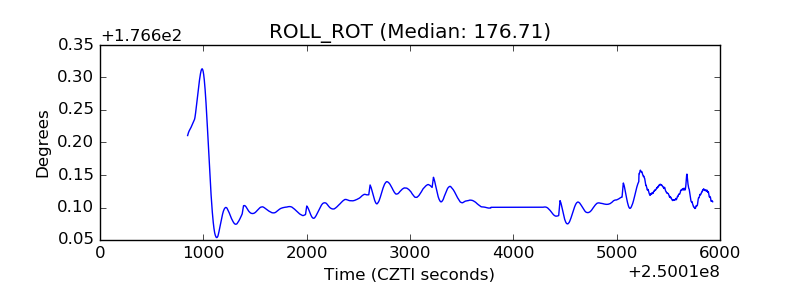 |
| _Roll_DEC |  |
| _Roll_RA | 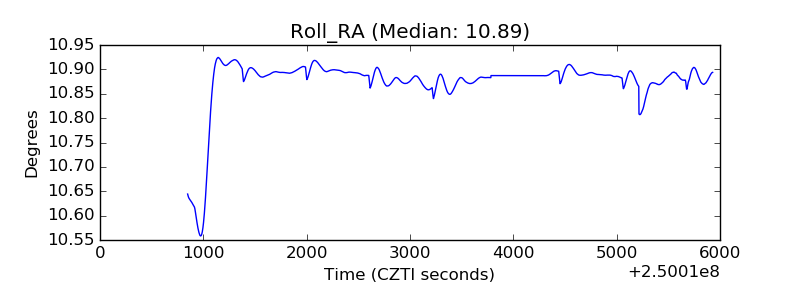 |
| Veto Counter | 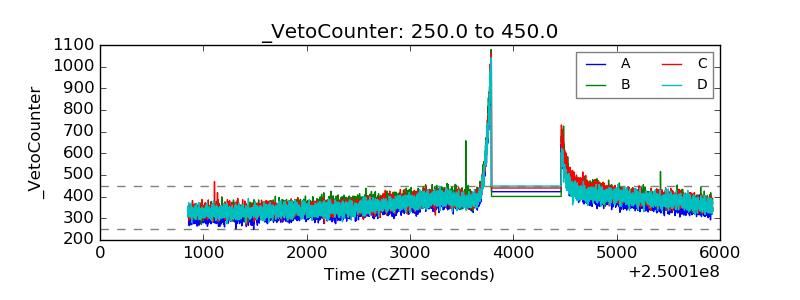 |