| Param | Original file | Final file |
|---|---|---|
| Filename | modeM0/AS1A04_022T04_9000001746_11806cztM0_level2.evt | modeM0/AS1A04_022T04_9000001746_11806cztM0_level2_quad_clean.evt |
| Size (bytes) | 499,901,760 | 91,719,360 |
| Size | 476.7 MB | 87.5 MB |
| Events in quadrant A | 3,270,411 | 586,234 |
| Events in quadrant B | 4,541,463 | 577,043 |
| Events in quadrant C | 3,012,416 | 598,796 |
| Events in quadrant D | 3,869,682 | 557,667 |
| Mode SS | |||
|---|---|---|---|
| Quadrant | BADHDUFLAG | Total packets | Discarded packets |
| A | 0 | 138 | 0 |
| B | 0 | 138 | 0 |
| C | 0 | 138 | 0 |
| D | 0 | 138 | 0 |
| Mode M9 | |||
|---|---|---|---|
| Quadrant | BADHDUFLAG | Total packets | Discarded packets |
| A | 0 | 18 | 0 |
| B | 0 | 18 | 0 |
| C | 0 | 18 | 0 |
| D | 0 | 18 | 0 |
| Mode M0 | |||
|---|---|---|---|
| Quadrant | BADHDUFLAG | Total packets | Discarded packets |
| A | 0 | 14176 | 3 |
| B | 0 | 18040 | 2 |
| C | 0 | 13551 | 2 |
| D | 0 | 16077 | 2 |
| Quadrant | Total seconds | Saturated seconds | Saturation percentage |
|---|---|---|---|
| A | 6554 | 85 | 1.296918% |
| B | 6554 | 292 | 4.455294% |
| C | 6554 | 54 | 0.823924% |
| D | 6554 | 253 | 3.860238% |
Noise dominated data is calculated using 1-second bins in cleaned event files. If a bin has >2000 counts, and if more than 50% of those come from <1% of pixels, then it is considered to be noise-dominated and hence unusable.
| Quadrant | # 1 sec bins | Bins with >0 counts | Bins with >2000 counts | High rate bins dominated by noise | Noise dominated (total time) | Noise dominated (detector-on time) | Marked lightcurve |
|---|---|---|---|---|---|---|---|
| A | 8475 | 6557 | 2 | 2 | 0.02% | 0.03% | 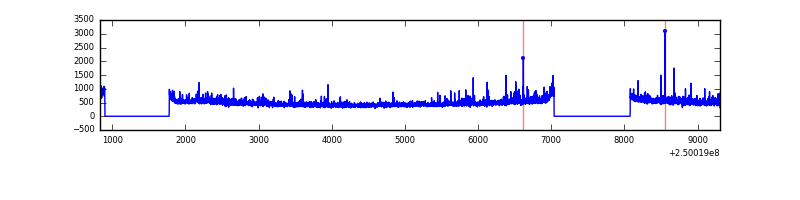 |
| B | 8475 | 6557 | 133 | 133 | 1.57% | 2.03% | 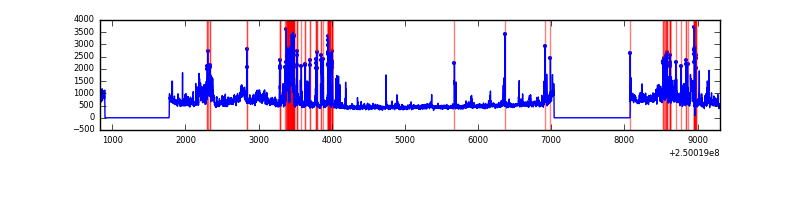 |
| C | 8475 | 6557 | 2 | 2 | 0.02% | 0.03% | 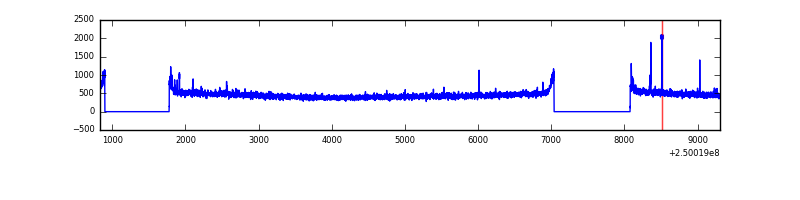 |
| D | 8475 | 6557 | 148 | 148 | 1.75% | 2.26% | 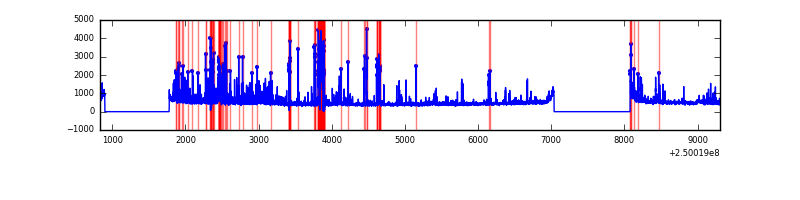 |
Top three noisy pixels from each quadrant. If the there are fewer than three noisy pixels in the level2.evt file, extra rows are filled as -1
| Pixel properties | Quadrant properties | ||||||
|---|---|---|---|---|---|---|---|
| Quadrant | DetID | PixID | Counts | Sigma | Mean | Median | Sigma |
| A | 1 | 162 | 105662 | 665.39 | 771 | 754 | 157.7 |
| A | 1 | 178 | 62942 | 394.43 | 771 | 754 | 157.7 |
| A | 1 | 161 | 53446 | 334.2 | 771 | 754 | 157.7 |
| B | 4 | 239 | 736796 | 5007.66 | 765 | 744 | 147.0 |
| B | 10 | 16 | 313383 | 2127.01 | 765 | 744 | 147.0 |
| B | 15 | 185 | 270344 | 1834.19 | 765 | 744 | 147.0 |
| C | 1 | 16 | 19156 | 103.3 | 761 | 765 | 178.0 |
| C | 8 | 208 | 17053 | 91.49 | 761 | 765 | 178.0 |
| C | 13 | 61 | 5624 | 27.29 | 761 | 765 | 178.0 |
| D | 1 | 52 | 609626 | 3391.6 | 744 | 723 | 179.5 |
| D | 13 | 104 | 82408 | 454.99 | 744 | 723 | 179.5 |
| D | 10 | 253 | 74993 | 413.69 | 744 | 723 | 179.5 |
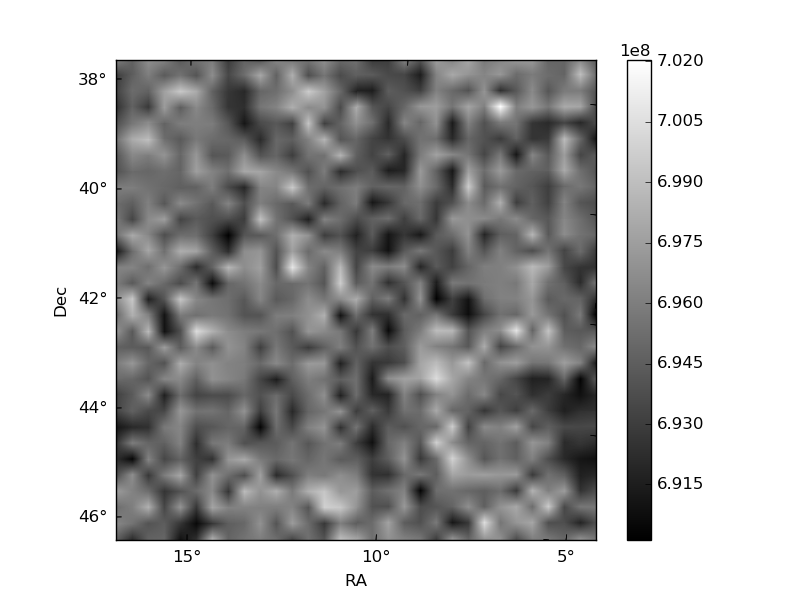
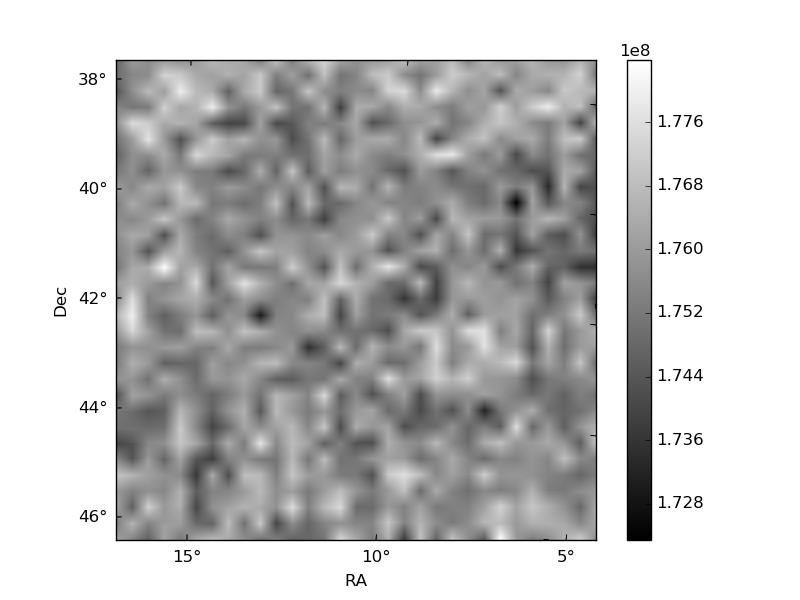
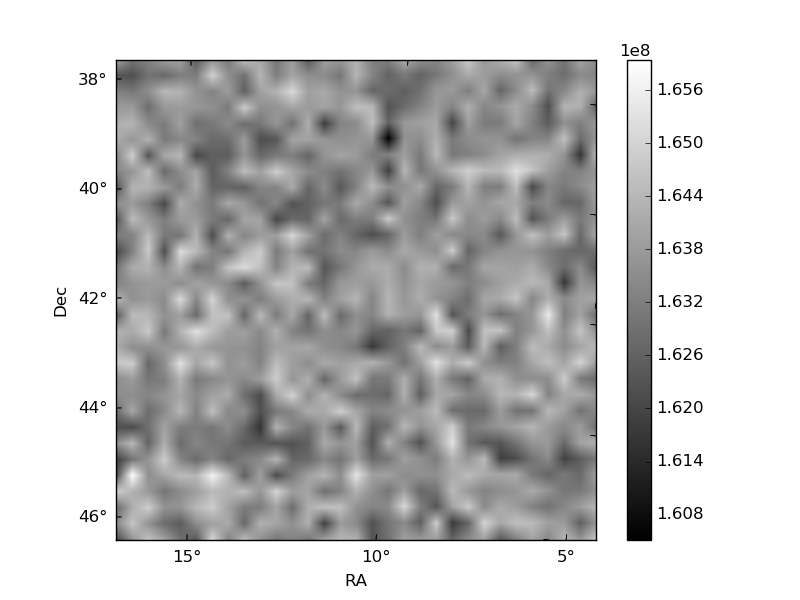
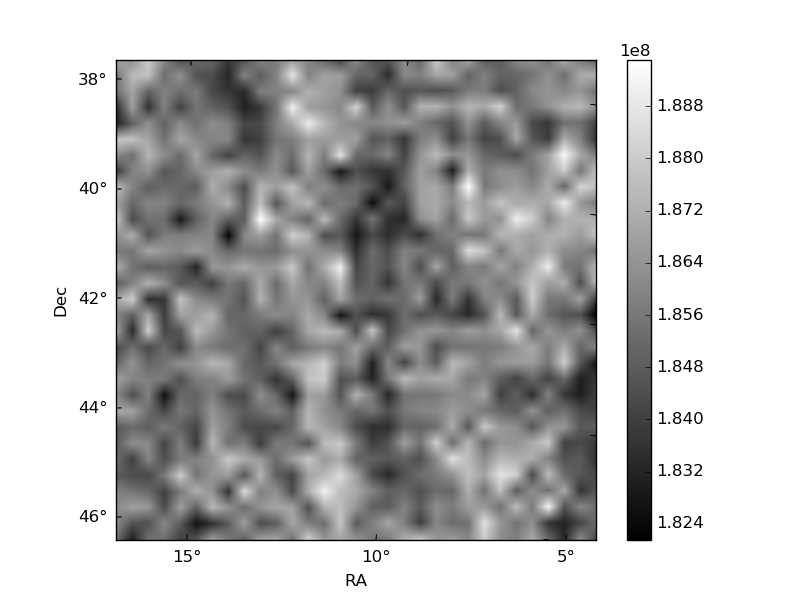
Histogram calculated using DETX and DETY for each event in the final _common_clean file
| Quadrant A | 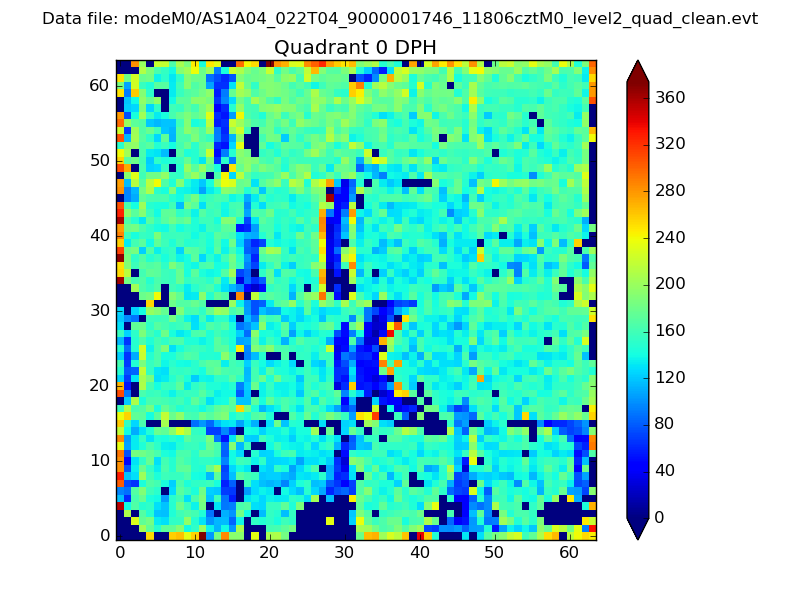 |
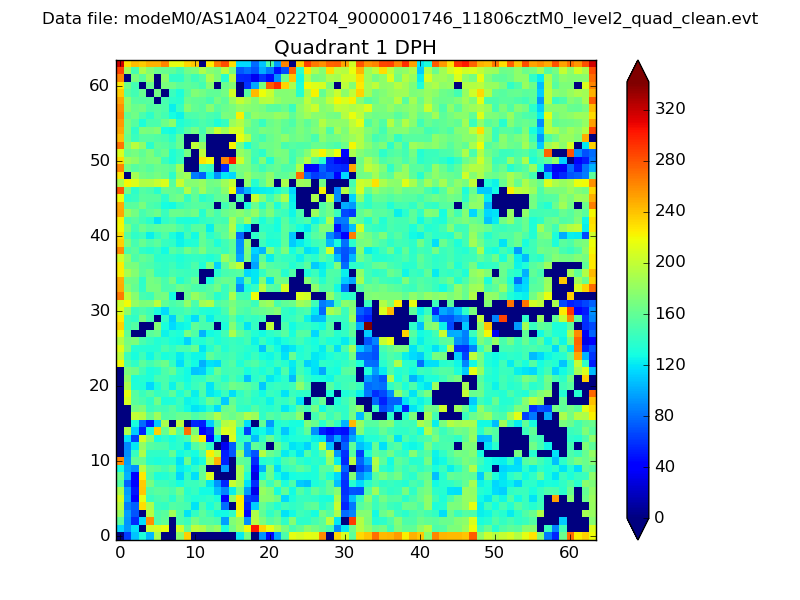 |
Quadrant B |
|---|---|---|---|
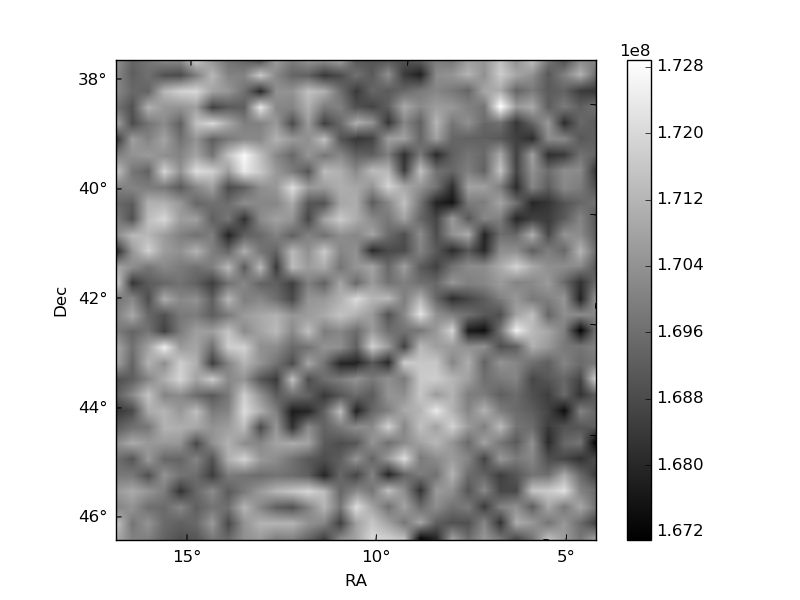
| Quadrant D | 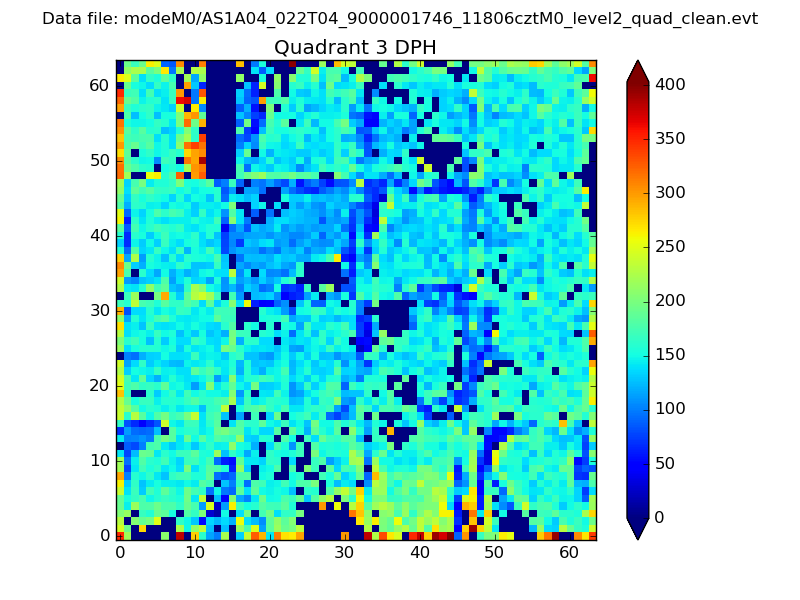 |
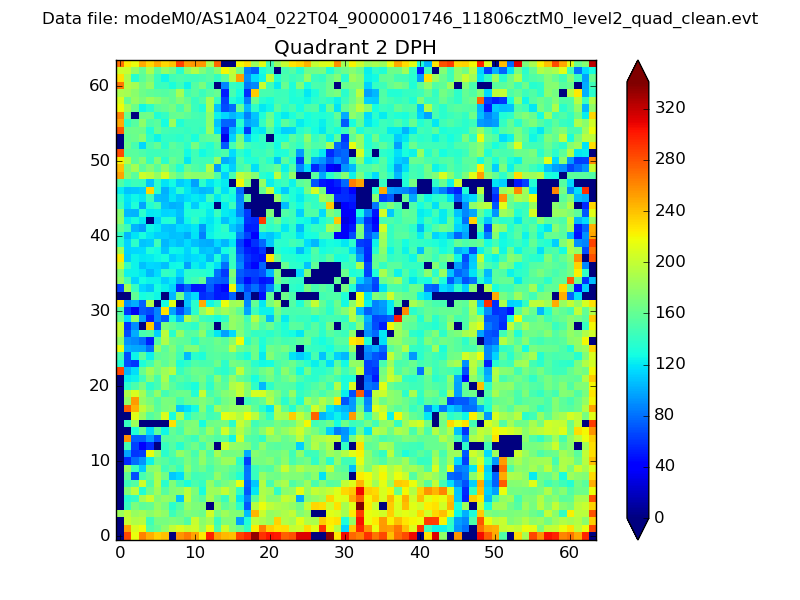 |
Quadrant C |
| Plot type | Count rate plots | Images |
|---|---|---|
| Comparison with Poisson distribution Blue bars denote a histogram of data divided into 1 sec bins. Red curve is a Poisson curve with rate = median count rate of data. |
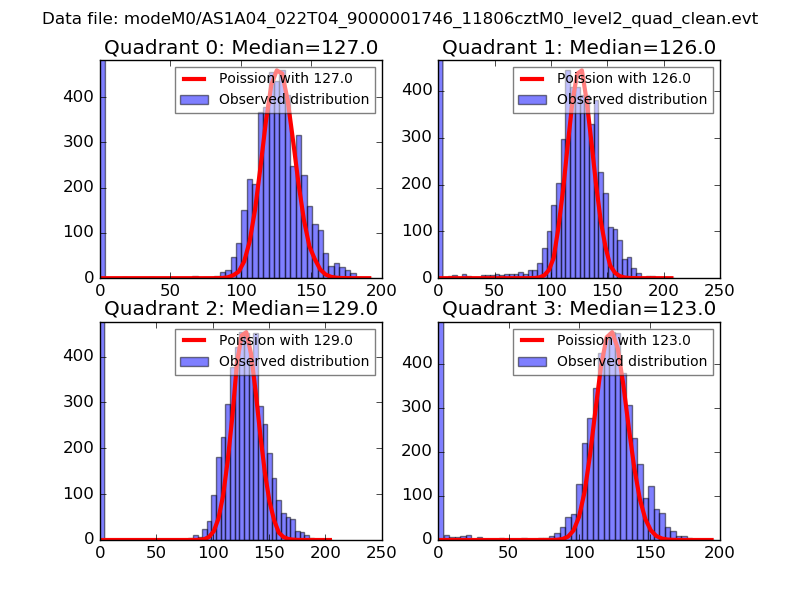 |
 |
| Quadrant-wise count rates Data is divided into 100 sec bins |
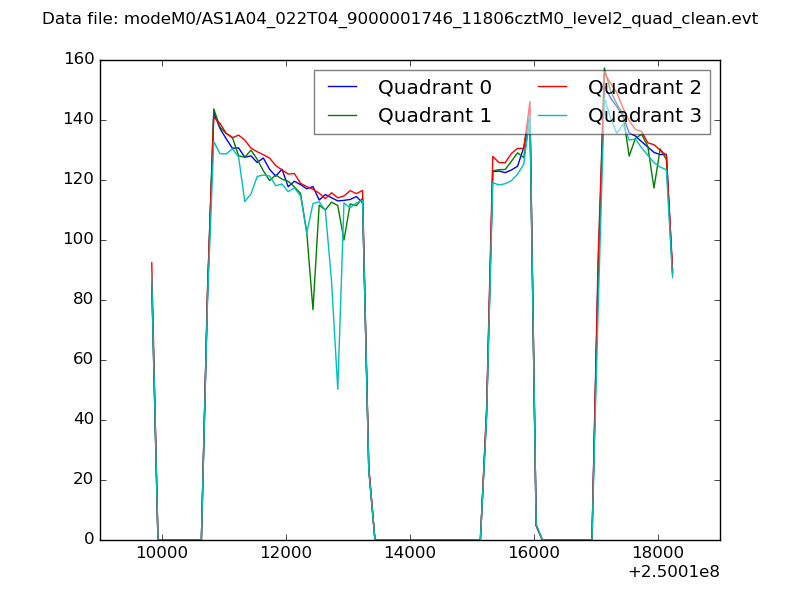 |
|
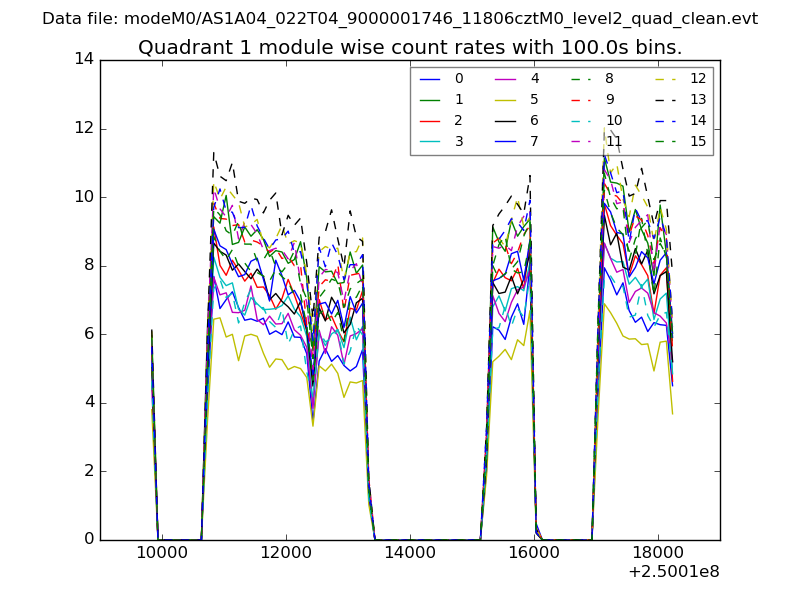
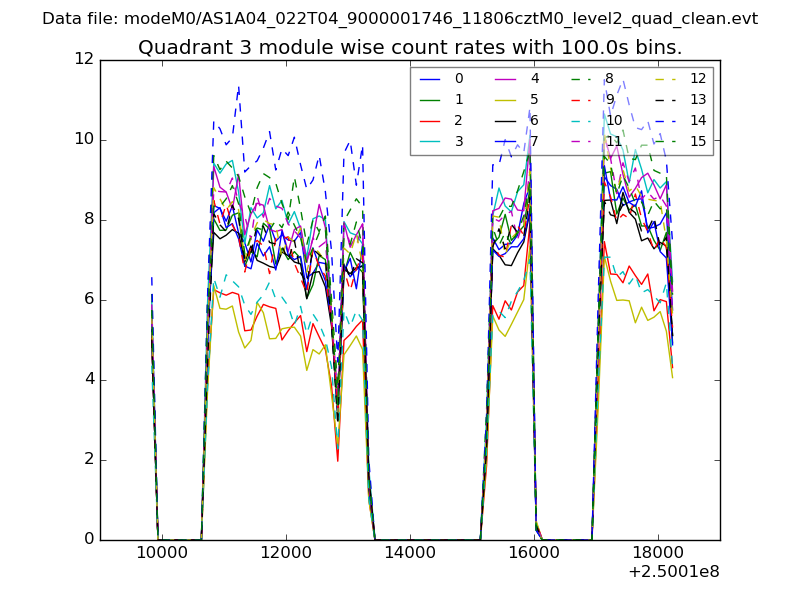
| Module-wise count rates for Quadrant A Data is divided into 100 sec bins |
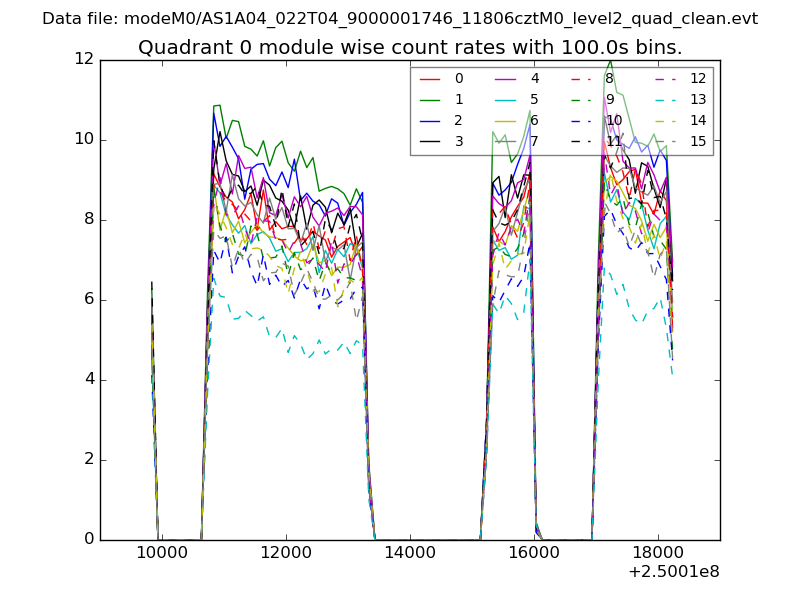 |
 |
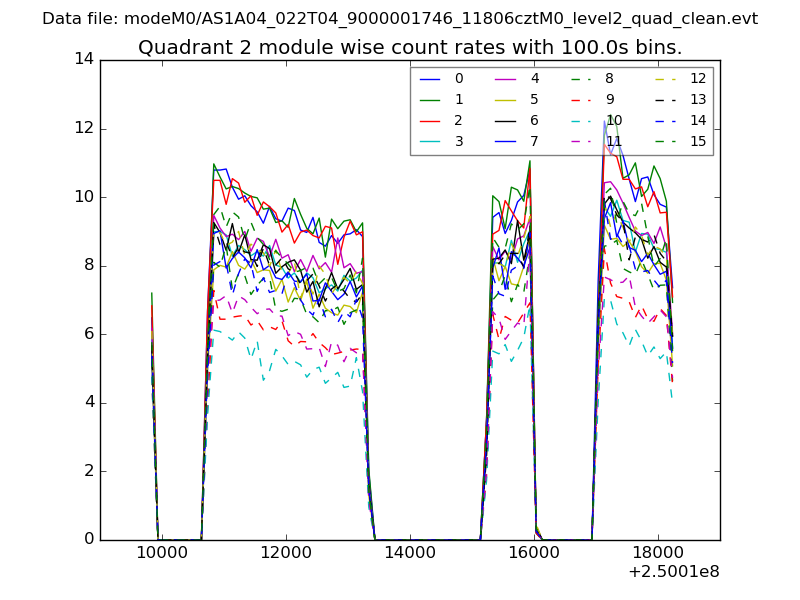
| Module-wise count rates for Quadrant B Data is divided into 100 sec bins |
 |
 |
| Module-wise count rates for Quadrant C Data is divided into 100 sec bins |
 |
 |
| Module-wise count rates for Quadrant D Data is divided into 100 sec bins |
 |
 |
| Parameter | Plot |
|---|---|
| CZT HV Monitor | 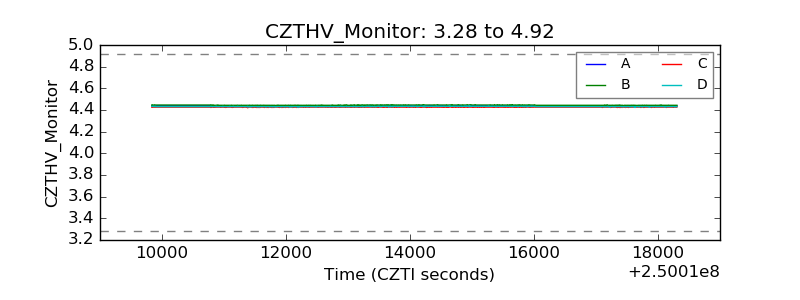 |
| D_VDD | 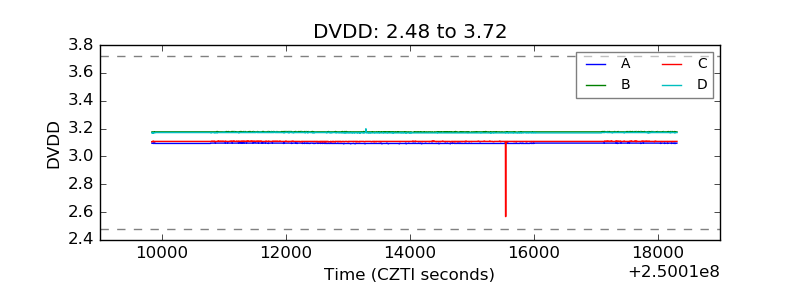 |
| Temperature 1 | 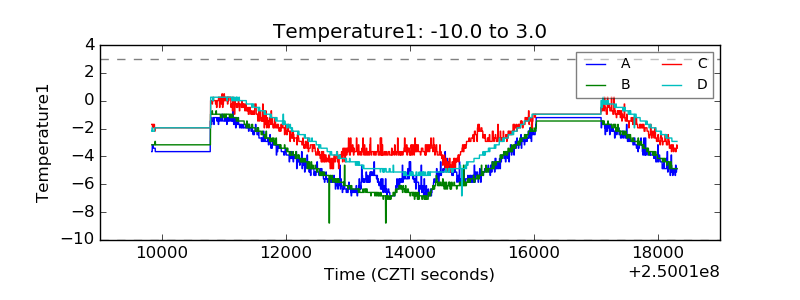 |
| Veto HV Monitor | 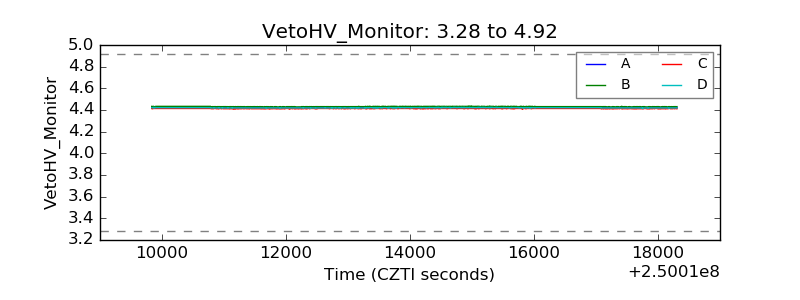 |
| Veto LLD | 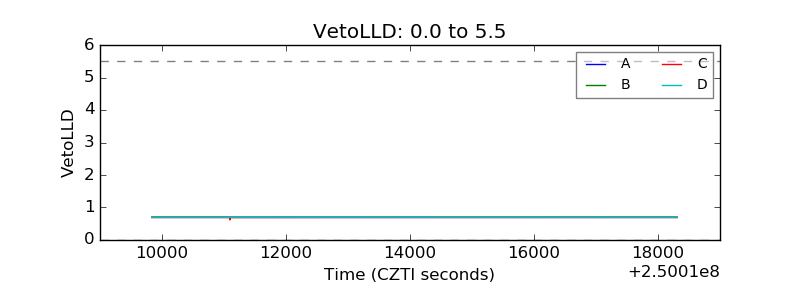 |
| Alpha Counter | 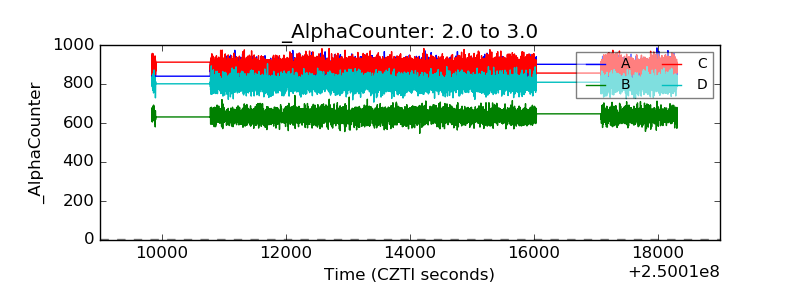 |
| _CPM_Rate | 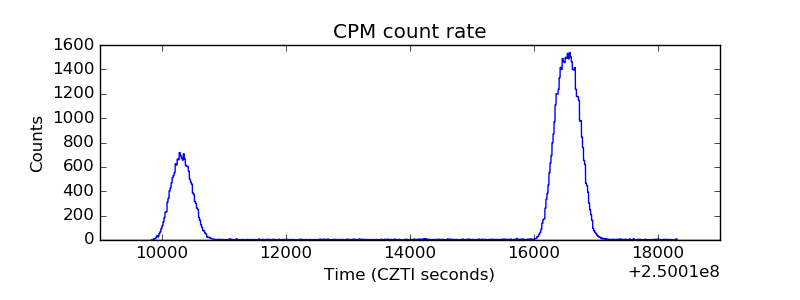 |
| CZT Counter | 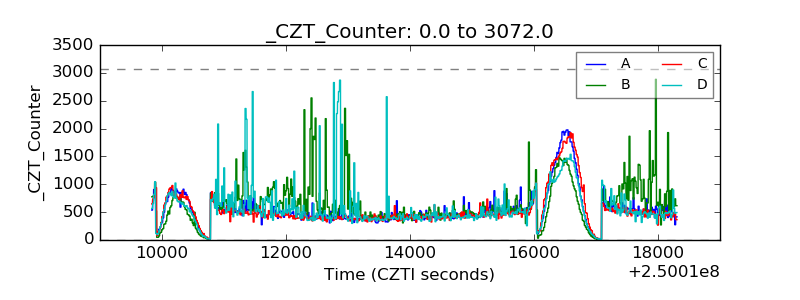 |
| +2.5 Volts monitor |  |
| +5 Volts monitor |  |
| _ROLL_ROT | 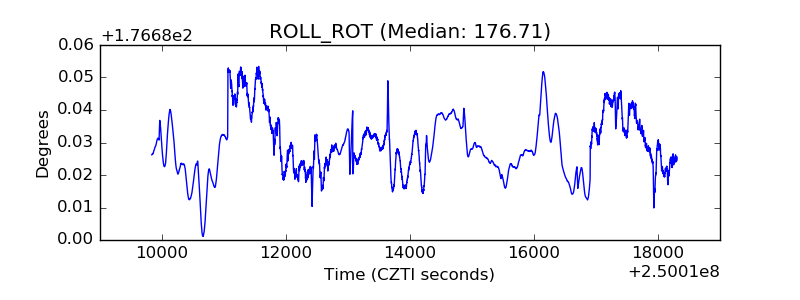 |
| _Roll_DEC | 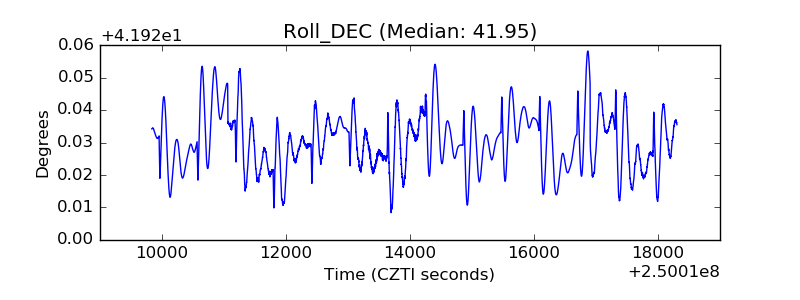 |
| _Roll_RA | 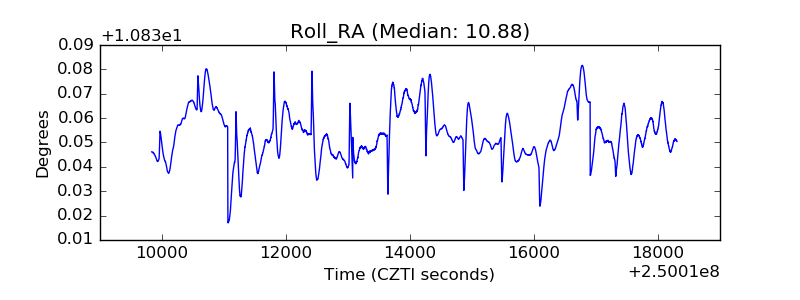 |
| Veto Counter | 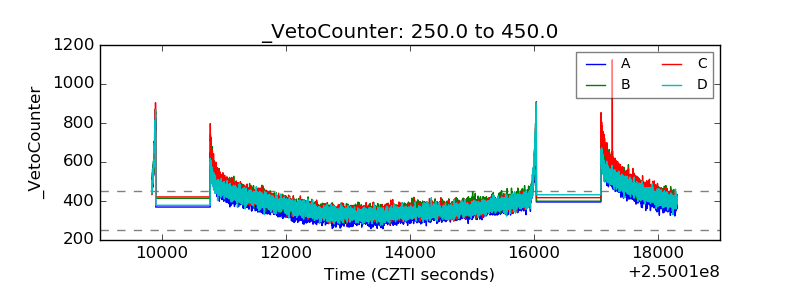 |