| Param | Original file | Final file |
|---|---|---|
| Filename | modeM0/AS1A04_022T04_9000001746_11810cztM0_level2.evt | modeM0/AS1A04_022T04_9000001746_11810cztM0_level2_quad_clean.evt |
| Size (bytes) | 480,412,800 | 86,296,320 |
| Size | 458.2 MB | 82.3 MB |
| Events in quadrant A | 3,204,892 | 552,509 |
| Events in quadrant B | 4,497,146 | 548,786 |
| Events in quadrant C | 2,958,663 | 561,937 |
| Events in quadrant D | 3,468,266 | 517,692 |
| Mode SS | |||
|---|---|---|---|
| Quadrant | BADHDUFLAG | Total packets | Discarded packets |
| A | 0 | 124 | 0 |
| B | 0 | 124 | 0 |
| C | 0 | 124 | 0 |
| D | 0 | 124 | 0 |
| Mode M9 | |||
|---|---|---|---|
| Quadrant | BADHDUFLAG | Total packets | Discarded packets |
| A | 0 | 23 | 0 |
| B | 0 | 23 | 0 |
| C | 0 | 23 | 0 |
| D | 0 | 24 | 0 |
| Mode M0 | |||
|---|---|---|---|
| Quadrant | BADHDUFLAG | Total packets | Discarded packets |
| A | 0 | 13470 | 3 |
| B | 0 | 17415 | 2 |
| C | 0 | 12768 | 2 |
| D | 0 | 14551 | 2 |
| Quadrant | Total seconds | Saturated seconds | Saturation percentage |
|---|---|---|---|
| A | 6193 | 29 | 0.468271% |
| B | 6193 | 323 | 5.215566% |
| C | 6193 | 7 | 0.113031% |
| D | 6193 | 75 | 1.211045% |
Noise dominated data is calculated using 1-second bins in cleaned event files. If a bin has >2000 counts, and if more than 50% of those come from <1% of pixels, then it is considered to be noise-dominated and hence unusable.
| Quadrant | # 1 sec bins | Bins with >0 counts | Bins with >2000 counts | High rate bins dominated by noise | Noise dominated (total time) | Noise dominated (detector-on time) | Marked lightcurve |
|---|---|---|---|---|---|---|---|
| A | 7554 | 6195 | 0 | 0 | 0.00% | 0.00% | 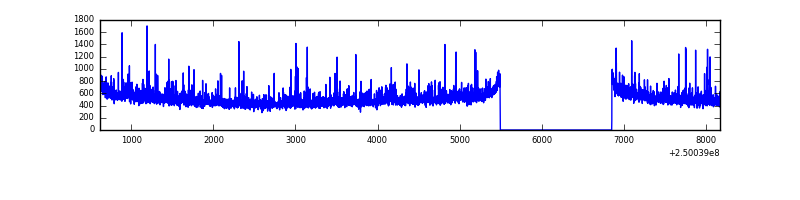 |
| B | 7554 | 6194 | 159 | 159 | 2.10% | 2.57% | 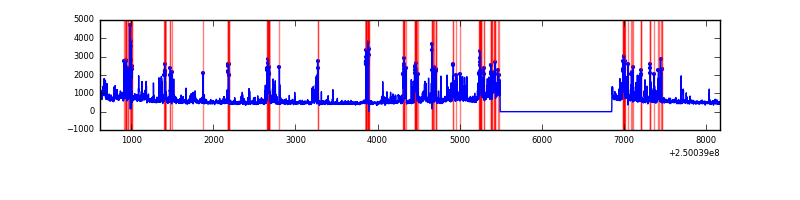 |
| C | 7554 | 6195 | 0 | 0 | 0.00% | 0.00% | 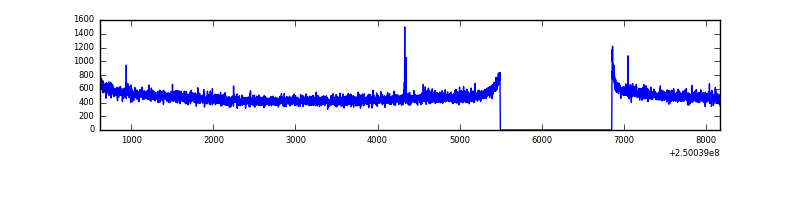 |
| D | 7554 | 6195 | 46 | 46 | 0.61% | 0.74% | 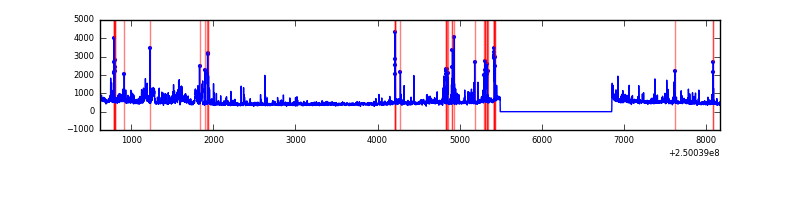 |
Top three noisy pixels from each quadrant. If the there are fewer than three noisy pixels in the level2.evt file, extra rows are filled as -1
| Pixel properties | Quadrant properties | ||||||
|---|---|---|---|---|---|---|---|
| Quadrant | DetID | PixID | Counts | Sigma | Mean | Median | Sigma |
| A | 1 | 162 | 105928 | 682.79 | 763 | 750 | 154.0 |
| A | 1 | 178 | 53761 | 344.14 | 763 | 750 | 154.0 |
| A | 1 | 161 | 47336 | 302.43 | 763 | 750 | 154.0 |
| B | 4 | 239 | 875628 | 6149.53 | 763 | 745 | 142.3 |
| B | 15 | 185 | 315948 | 2215.55 | 763 | 745 | 142.3 |
| B | 10 | 16 | 163698 | 1145.39 | 763 | 745 | 142.3 |
| C | 13 | 61 | 5502 | 27.08 | 755 | 760 | 175.1 |
| C | 1 | 16 | 5420 | 26.61 | 755 | 760 | 175.1 |
| C | 14 | 234 | 5084 | 24.69 | 755 | 760 | 175.1 |
| D | 1 | 52 | 238866 | 1350.91 | 735 | 716 | 176.3 |
| D | 13 | 104 | 80039 | 449.96 | 735 | 716 | 176.3 |
| D | 10 | 199 | 77829 | 437.42 | 735 | 716 | 176.3 |
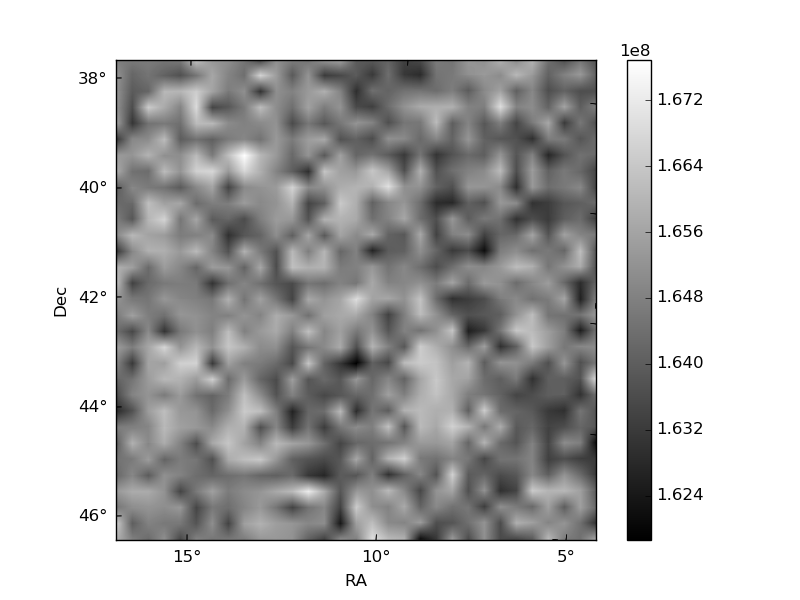
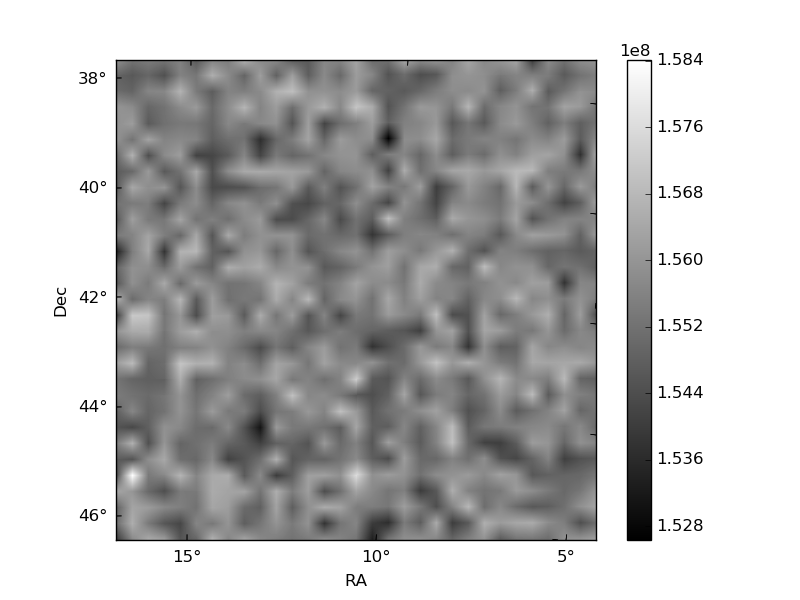
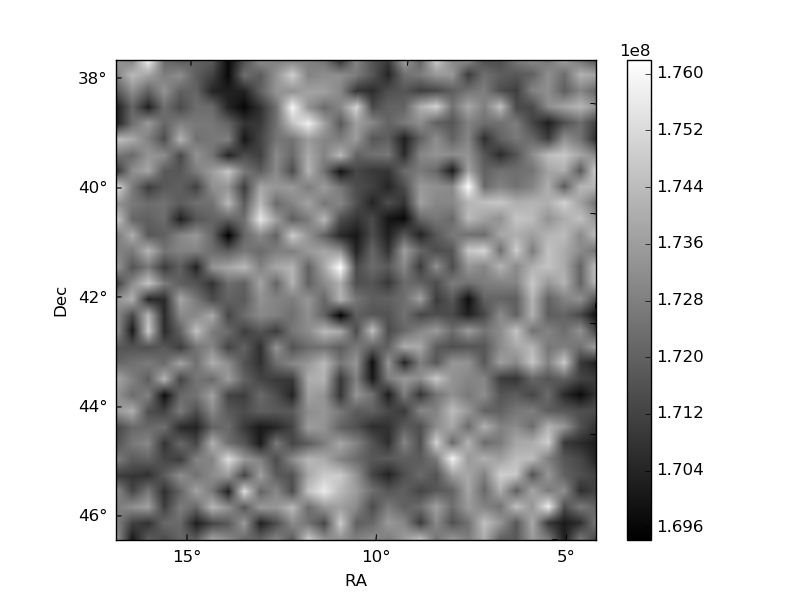
Histogram calculated using DETX and DETY for each event in the final _common_clean file
| Quadrant A | 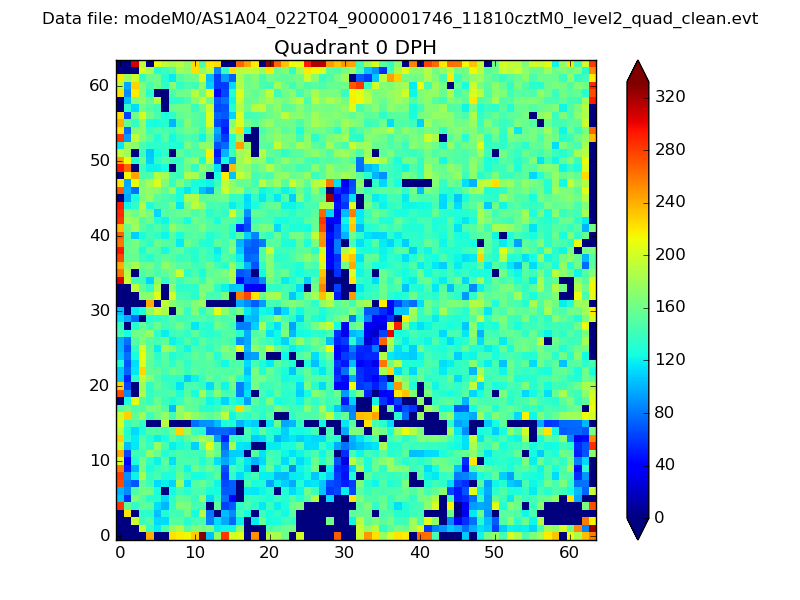 |
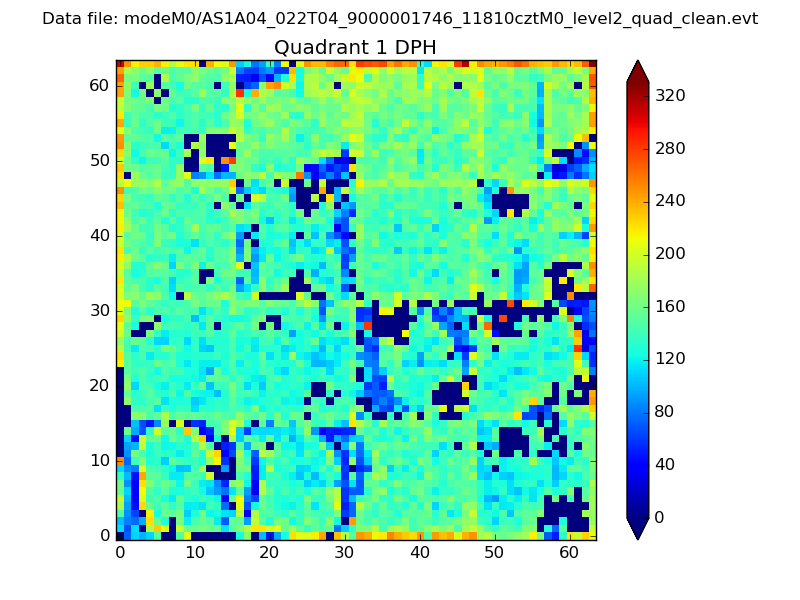 |
Quadrant B |
|---|---|---|---|
| Quadrant D | 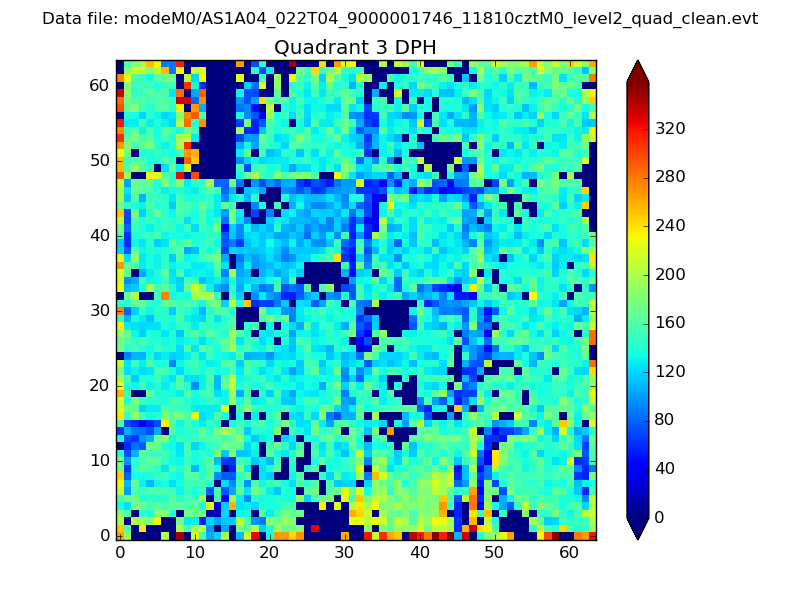 |
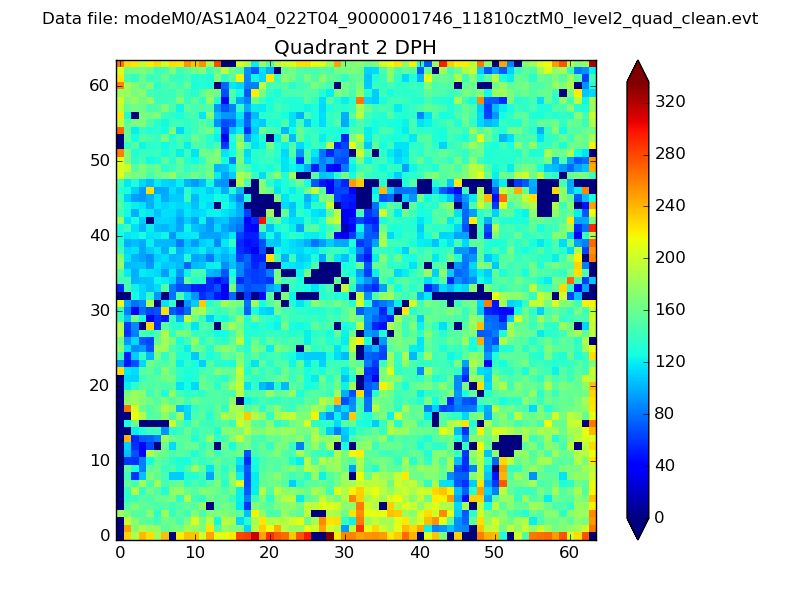 |
Quadrant C |
| Plot type | Count rate plots | Images |
|---|---|---|
| Comparison with Poisson distribution Blue bars denote a histogram of data divided into 1 sec bins. Red curve is a Poisson curve with rate = median count rate of data. |
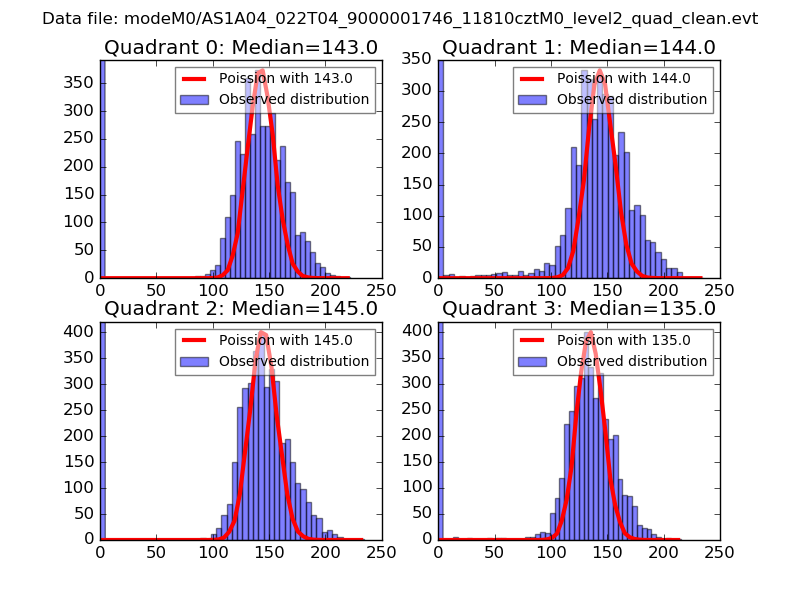 |
 |
| Quadrant-wise count rates Data is divided into 100 sec bins |
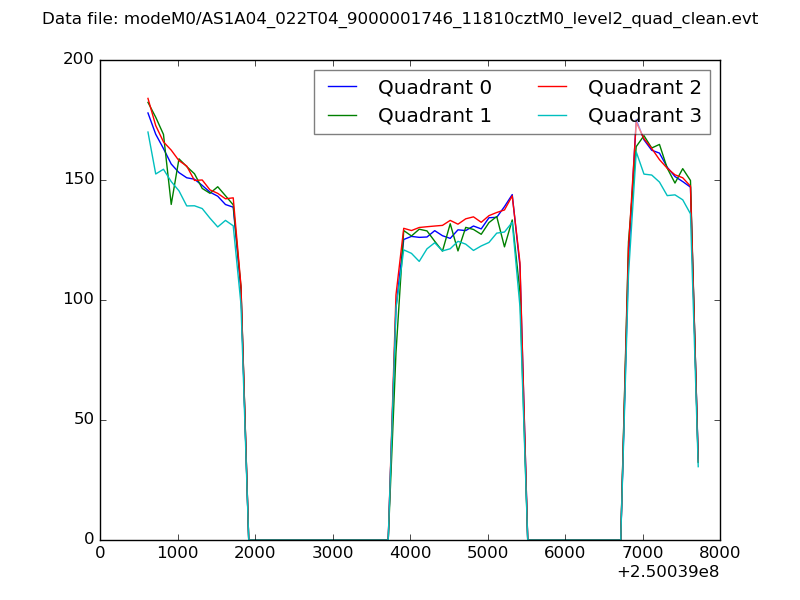 |
|
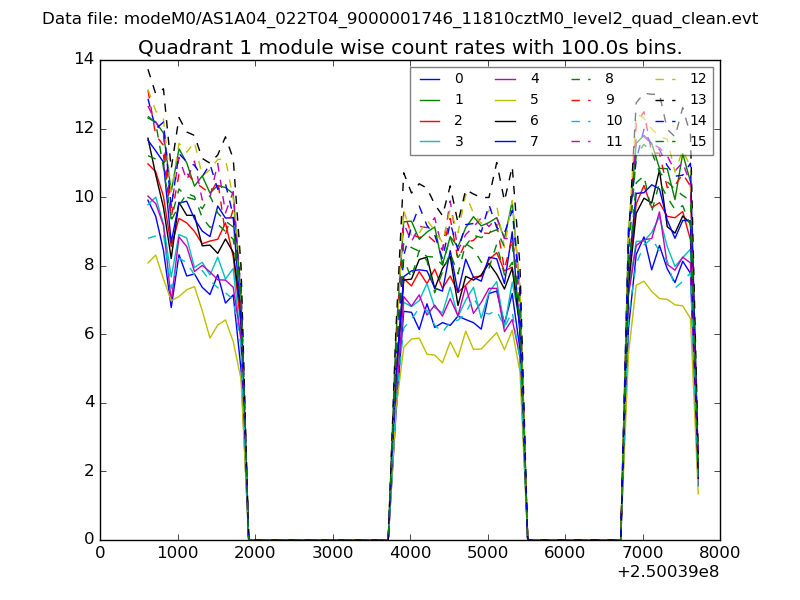
| Module-wise count rates for Quadrant A Data is divided into 100 sec bins |
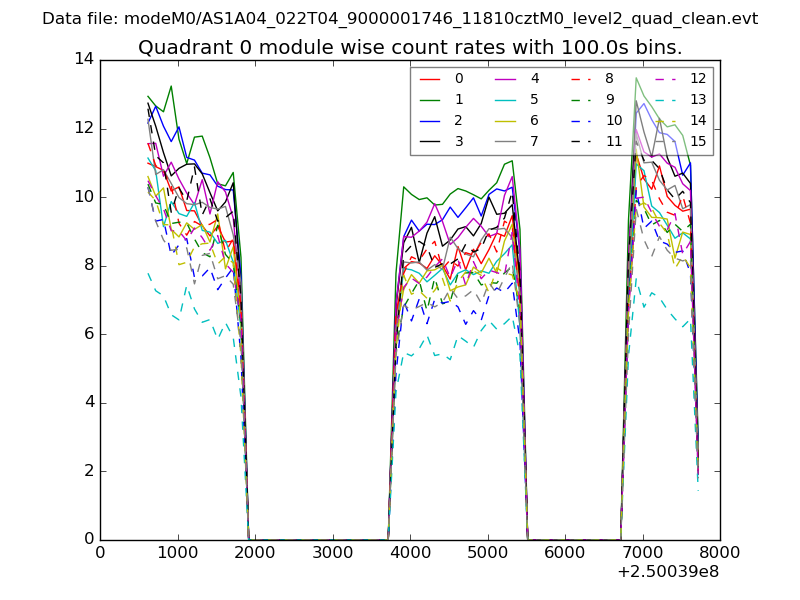 |
 |
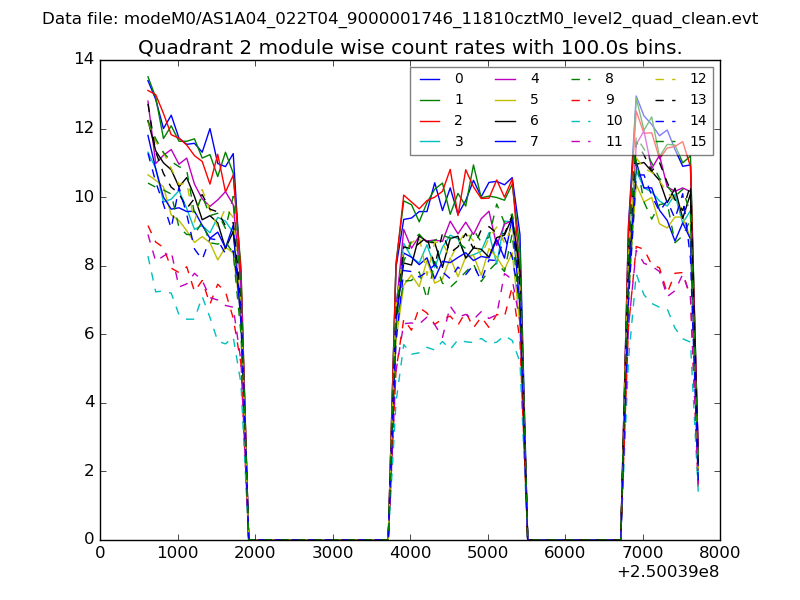
| Module-wise count rates for Quadrant B Data is divided into 100 sec bins |
 |
 |
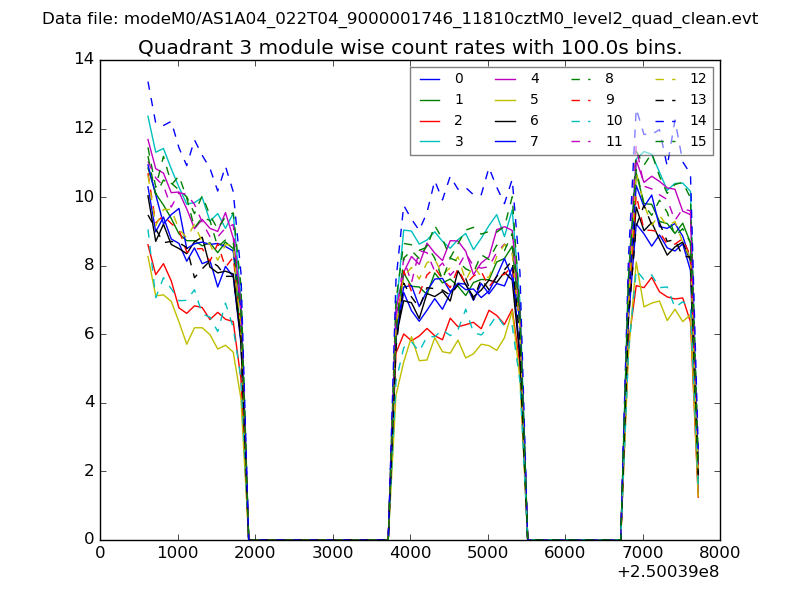
| Module-wise count rates for Quadrant C Data is divided into 100 sec bins |
 |
 |
| Module-wise count rates for Quadrant D Data is divided into 100 sec bins |
 |
 |
| Parameter | Plot |
|---|---|
| CZT HV Monitor | 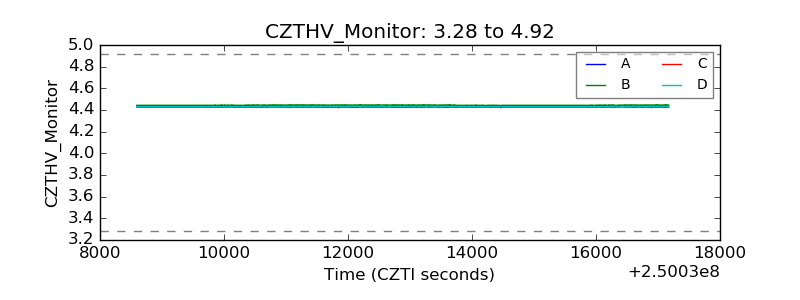 |
| D_VDD |  |
| Temperature 1 | 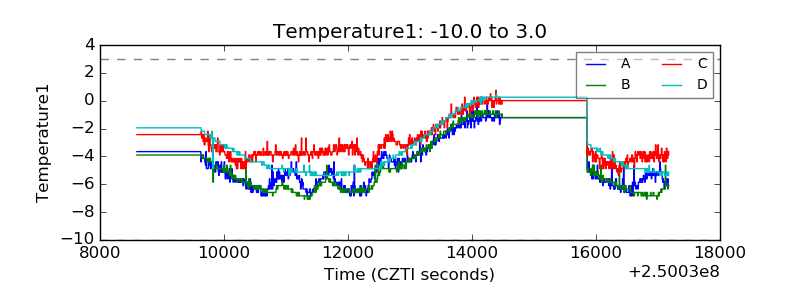 |
| Veto HV Monitor |  |
| Veto LLD | 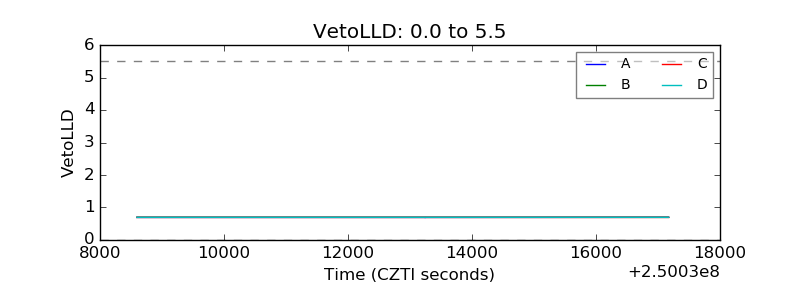 |
| Alpha Counter | 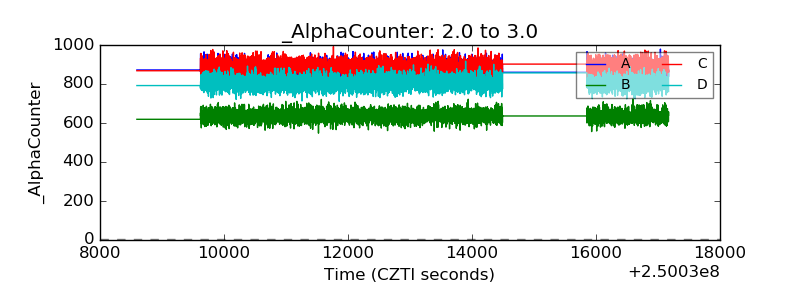 |
| _CPM_Rate | 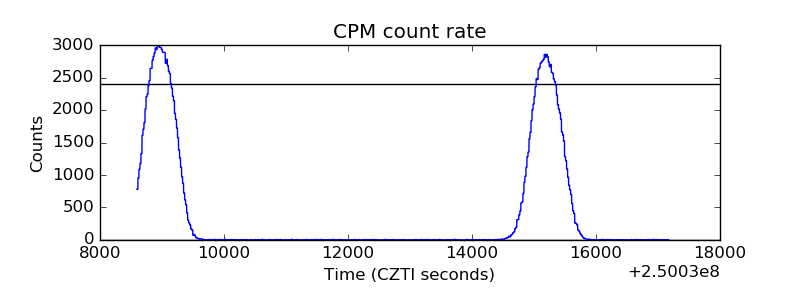 |
| CZT Counter | 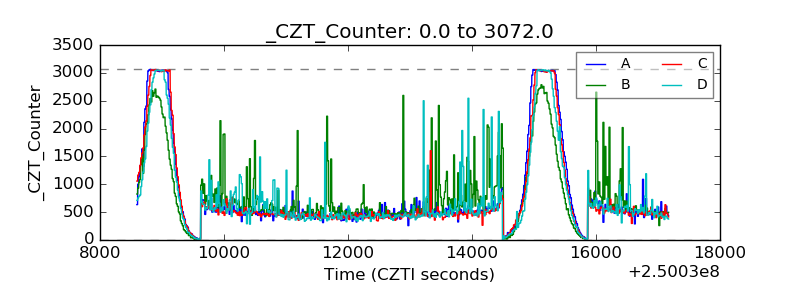 |
| +2.5 Volts monitor |  |
| +5 Volts monitor |  |
| _ROLL_ROT | 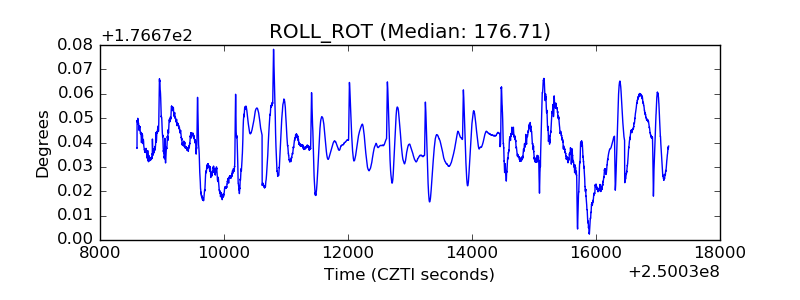 |
| _Roll_DEC | 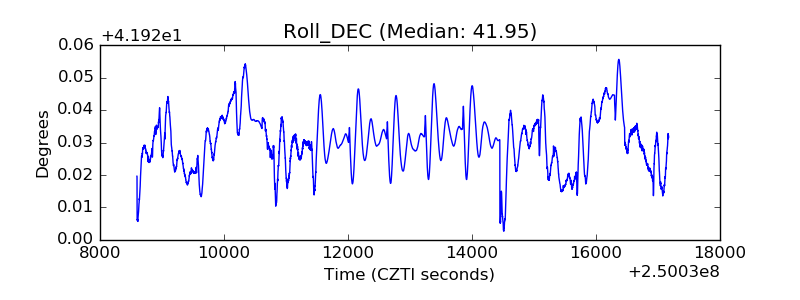 |
| _Roll_RA |  |
| Veto Counter | 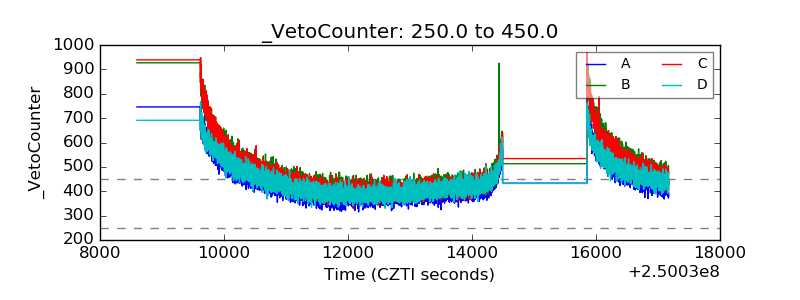 |