| Param | Original file | Final file |
|---|---|---|
| Filename | modeM0/AS1A04_022T04_9000001746_11811cztM0_level2.evt | modeM0/AS1A04_022T04_9000001746_11811cztM0_level2_quad_clean.evt |
| Size (bytes) | 479,185,920 | 78,618,240 |
| Size | 457.0 MB | 75.0 MB |
| Events in quadrant A | 3,236,864 | 490,461 |
| Events in quadrant B | 4,182,516 | 491,774 |
| Events in quadrant C | 3,050,980 | 497,110 |
| Events in quadrant D | 3,610,279 | 457,804 |
| Mode SS | |||
|---|---|---|---|
| Quadrant | BADHDUFLAG | Total packets | Discarded packets |
| A | 0 | 128 | 0 |
| B | 0 | 128 | 0 |
| C | 0 | 128 | 0 |
| D | 0 | 128 | 0 |
| Mode M9 | |||
|---|---|---|---|
| Quadrant | BADHDUFLAG | Total packets | Discarded packets |
| A | 0 | 15 | 0 |
| B | 0 | 15 | 0 |
| C | 0 | 15 | 0 |
| D | 0 | 16 | 0 |
| Mode M0 | |||
|---|---|---|---|
| Quadrant | BADHDUFLAG | Total packets | Discarded packets |
| A | 0 | 13582 | 3 |
| B | 0 | 16497 | 2 |
| C | 0 | 13150 | 2 |
| D | 0 | 15008 | 2 |
| Quadrant | Total seconds | Saturated seconds | Saturation percentage |
|---|---|---|---|
| A | 6358 | 52 | 0.817867% |
| B | 6358 | 239 | 3.759044% |
| C | 6358 | 29 | 0.456118% |
| D | 6358 | 154 | 2.422145% |
Noise dominated data is calculated using 1-second bins in cleaned event files. If a bin has >2000 counts, and if more than 50% of those come from <1% of pixels, then it is considered to be noise-dominated and hence unusable.
| Quadrant | # 1 sec bins | Bins with >0 counts | Bins with >2000 counts | High rate bins dominated by noise | Noise dominated (total time) | Noise dominated (detector-on time) | Marked lightcurve |
|---|---|---|---|---|---|---|---|
| A | 7719 | 6360 | 6 | 6 | 0.08% | 0.09% | 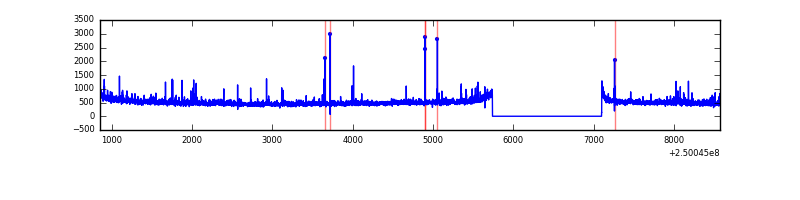 |
| B | 7719 | 6360 | 112 | 112 | 1.45% | 1.76% | 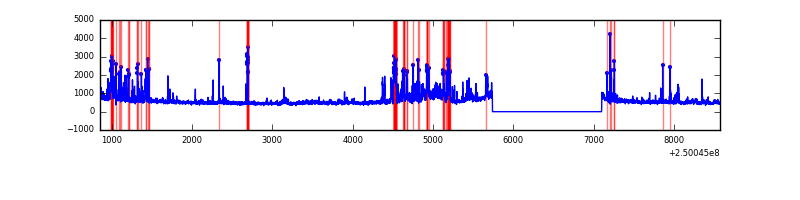 |
| C | 7719 | 6360 | 1 | 1 | 0.01% | 0.02% | 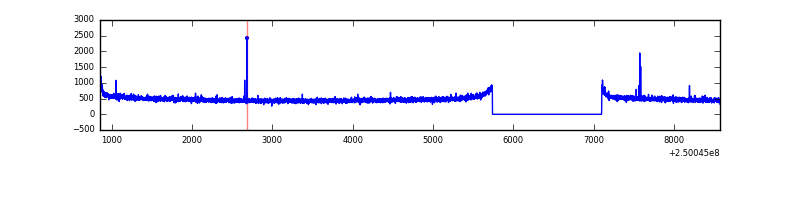 |
| D | 7719 | 6360 | 110 | 110 | 1.43% | 1.73% | 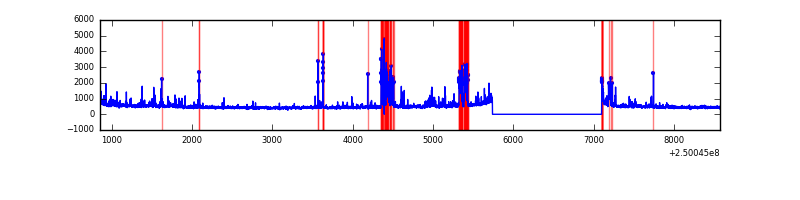 |
Top three noisy pixels from each quadrant. If the there are fewer than three noisy pixels in the level2.evt file, extra rows are filled as -1
| Pixel properties | Quadrant properties | ||||||
|---|---|---|---|---|---|---|---|
| Quadrant | DetID | PixID | Counts | Sigma | Mean | Median | Sigma |
| A | 1 | 162 | 74813 | 469.04 | 788 | 775 | 157.9 |
| A | 1 | 178 | 37499 | 232.65 | 788 | 775 | 157.9 |
| A | 1 | 161 | 32797 | 202.86 | 788 | 775 | 157.9 |
| B | 4 | 239 | 524243 | 3563.43 | 793 | 777 | 146.9 |
| B | 15 | 185 | 326671 | 2218.48 | 793 | 777 | 146.9 |
| B | 3 | 64 | 93711 | 632.64 | 793 | 777 | 146.9 |
| C | 1 | 16 | 7710 | 38.73 | 776 | 782 | 178.9 |
| C | 15 | 127 | 7206 | 35.92 | 776 | 782 | 178.9 |
| C | 8 | 208 | 6248 | 30.56 | 776 | 782 | 178.9 |
| D | 1 | 52 | 345324 | 1919.83 | 753 | 732 | 179.5 |
| D | 10 | 199 | 171614 | 952.04 | 753 | 732 | 179.5 |
| D | 8 | 195 | 84518 | 466.8 | 753 | 732 | 179.5 |
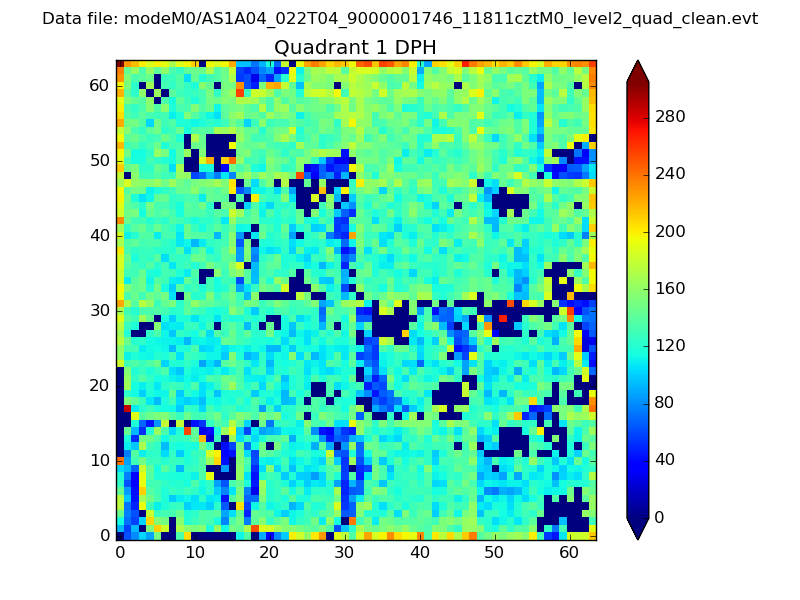
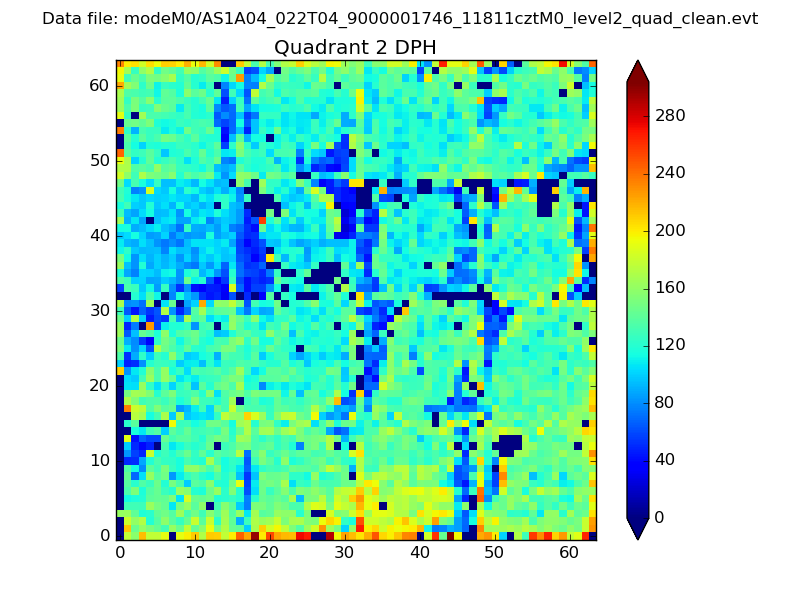
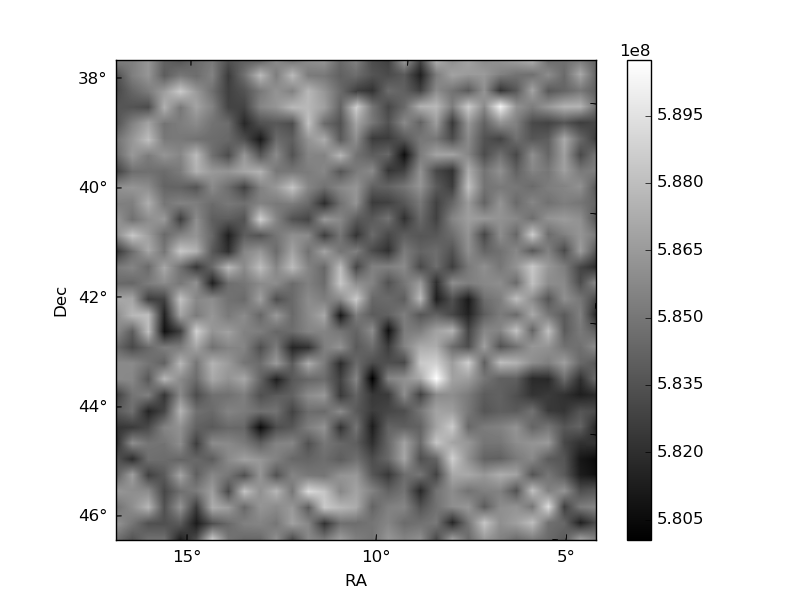
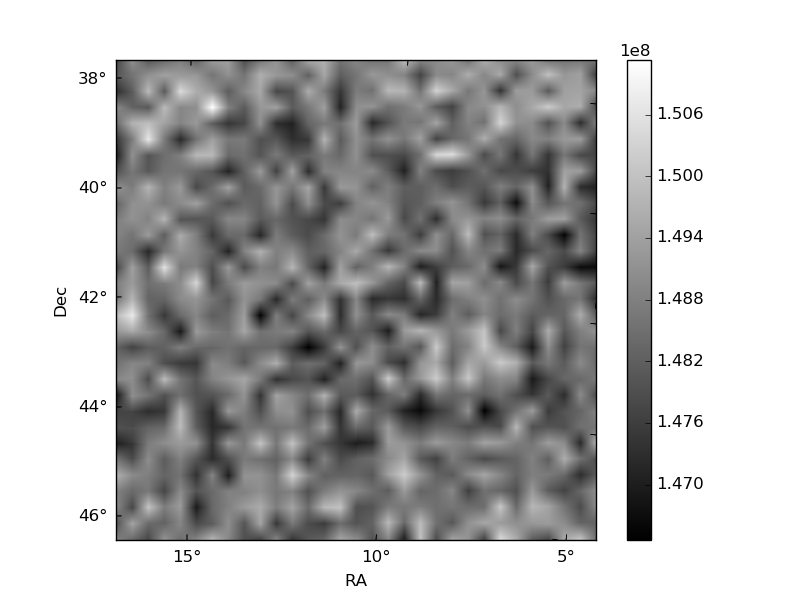
Histogram calculated using DETX and DETY for each event in the final _common_clean file
| Quadrant A |  |
 |
Quadrant B |
|---|---|---|---|
| Quadrant D | 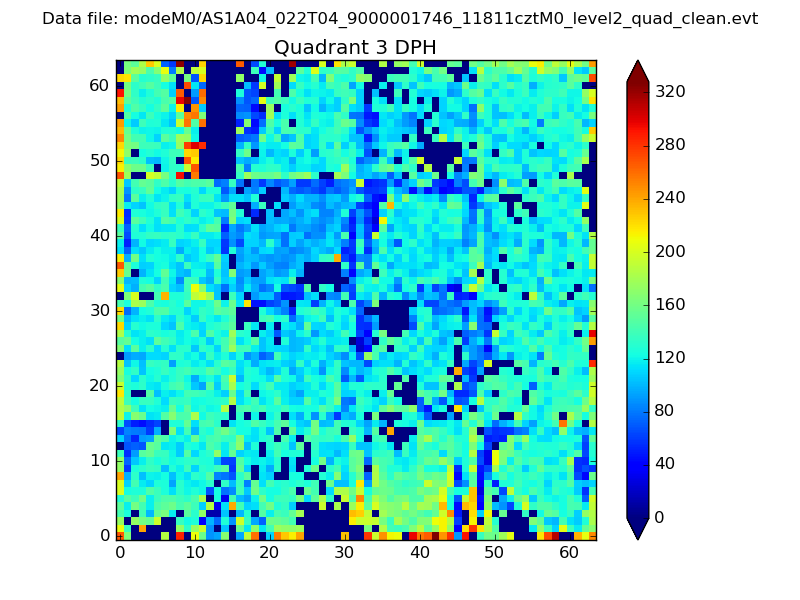 |
 |
Quadrant C |
| Plot type | Count rate plots | Images |
|---|---|---|
| Comparison with Poisson distribution Blue bars denote a histogram of data divided into 1 sec bins. Red curve is a Poisson curve with rate = median count rate of data. |
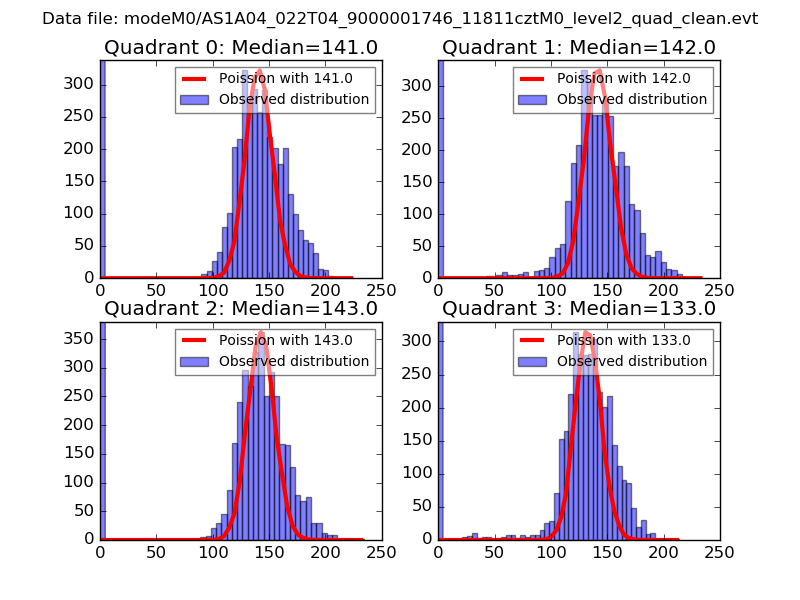 |
 |
| Quadrant-wise count rates Data is divided into 100 sec bins |
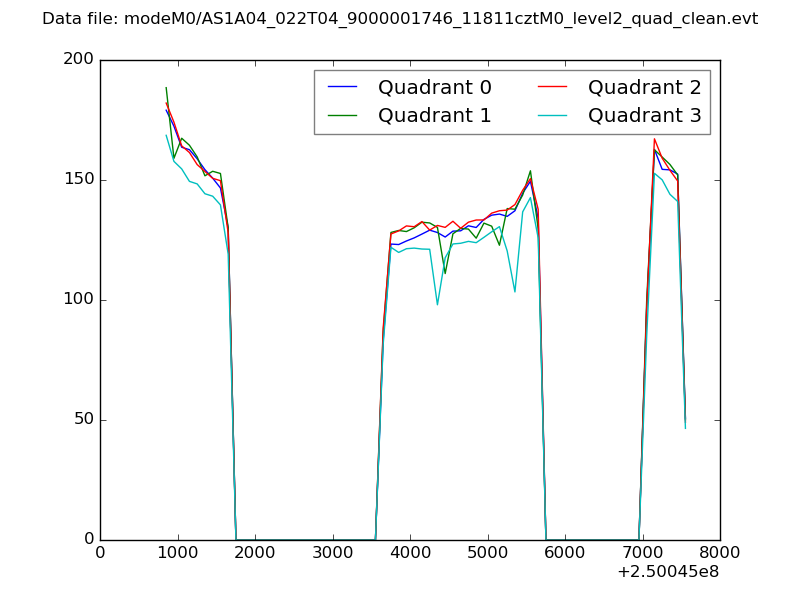 |
|
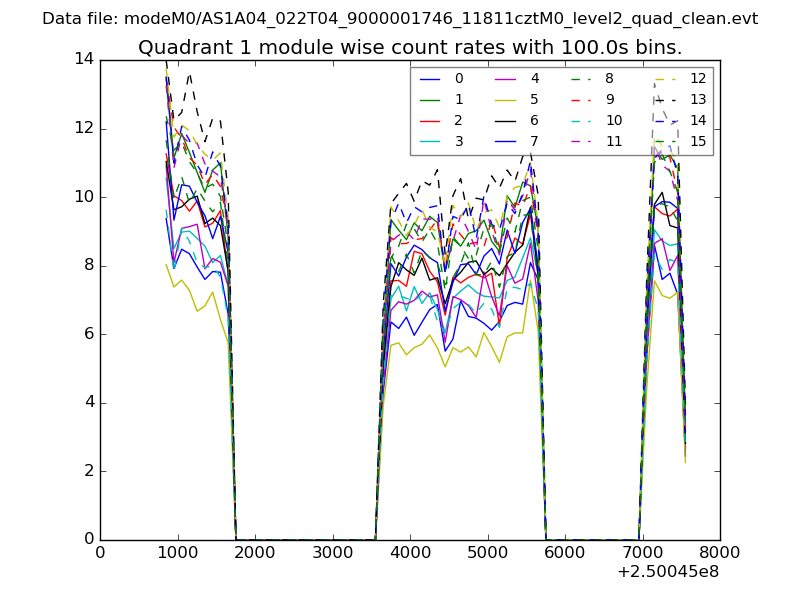
| Module-wise count rates for Quadrant A Data is divided into 100 sec bins |
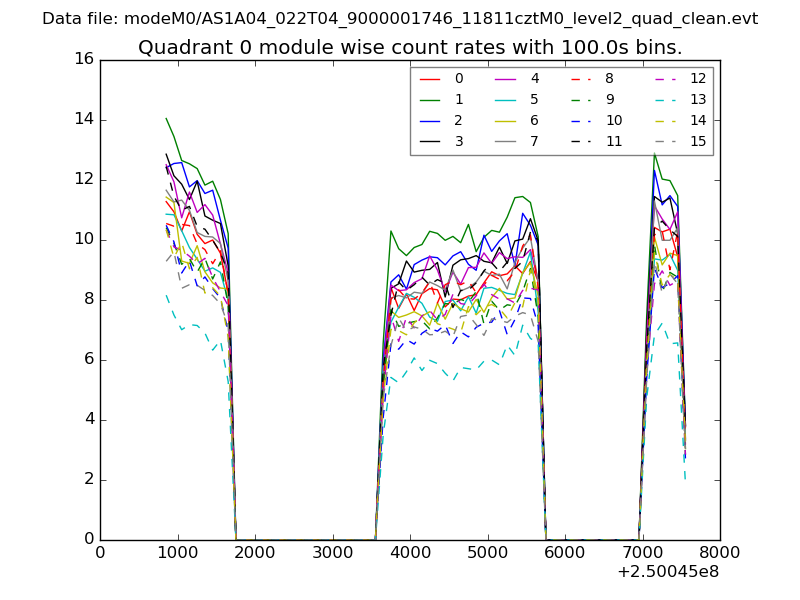 |
 |
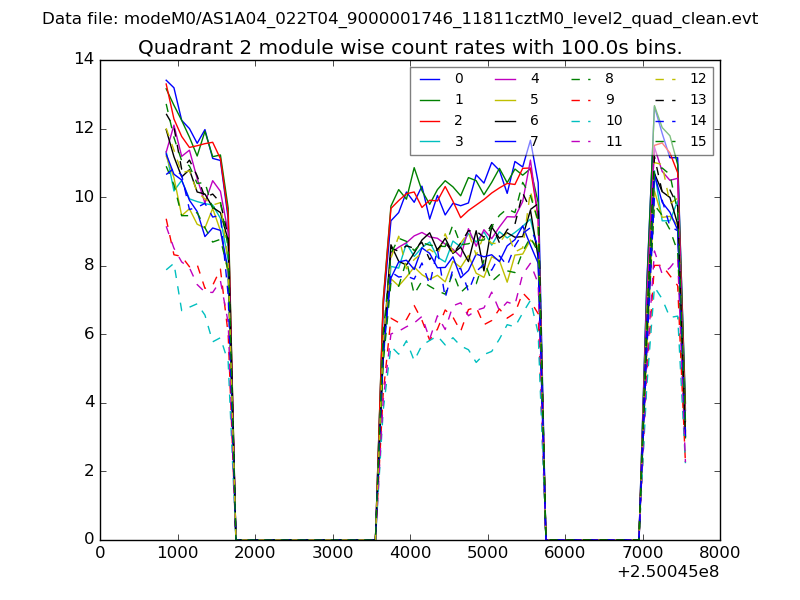
| Module-wise count rates for Quadrant B Data is divided into 100 sec bins |
 |
 |
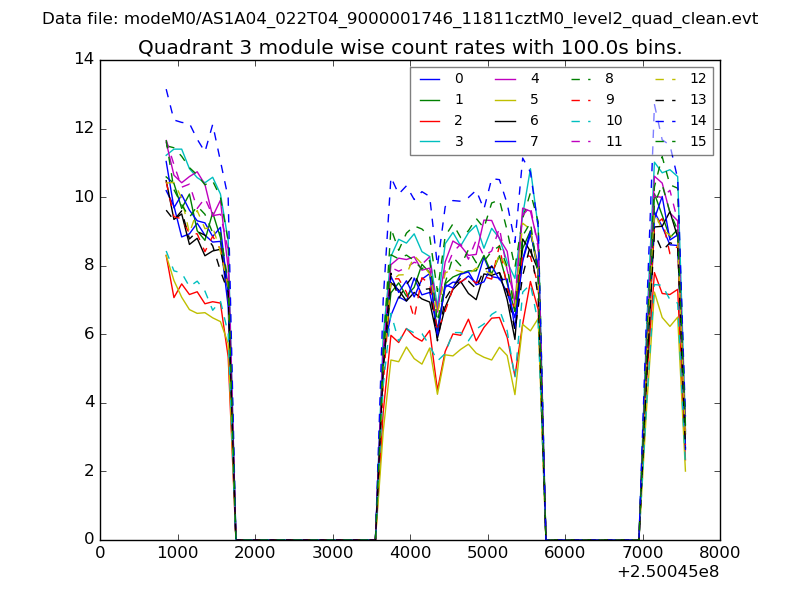
| Module-wise count rates for Quadrant C Data is divided into 100 sec bins |
 |
 |
| Module-wise count rates for Quadrant D Data is divided into 100 sec bins |
 |
 |
| Parameter | Plot |
|---|---|
| CZT HV Monitor | 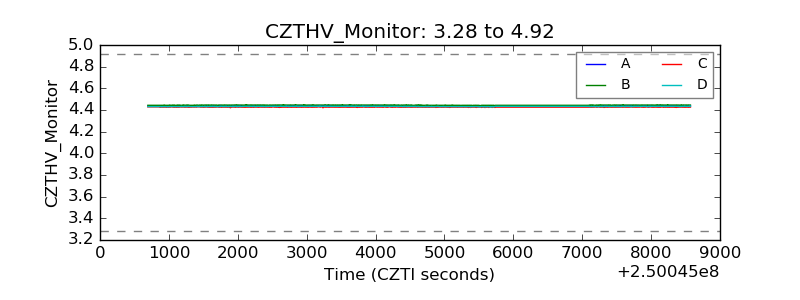 |
| D_VDD | 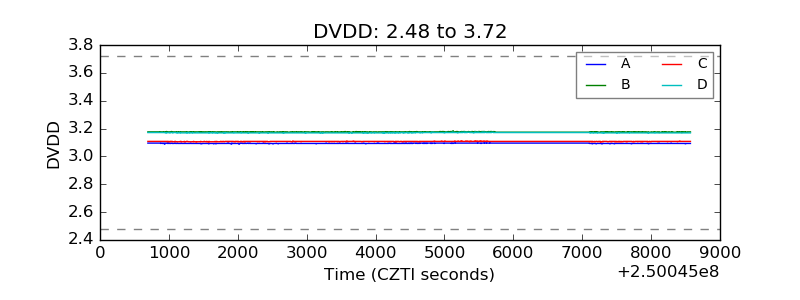 |
| Temperature 1 | 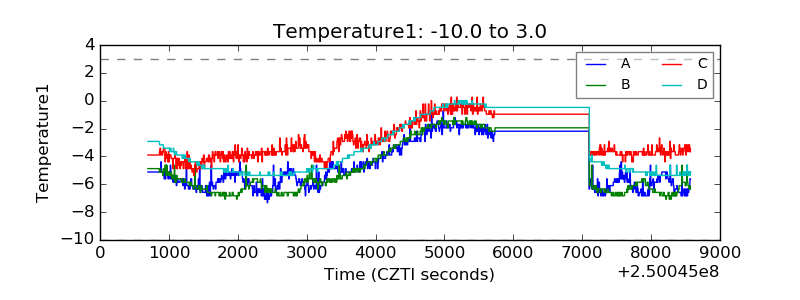 |
| Veto HV Monitor | 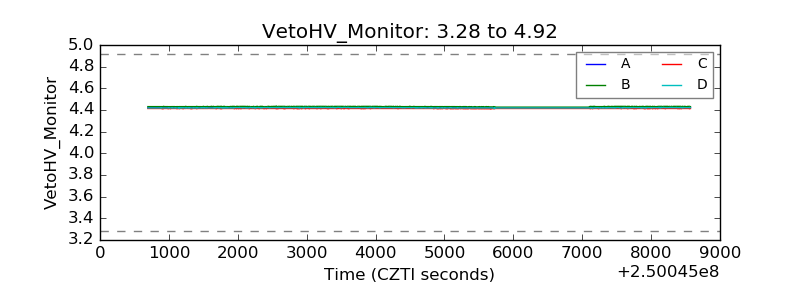 |
| Veto LLD | 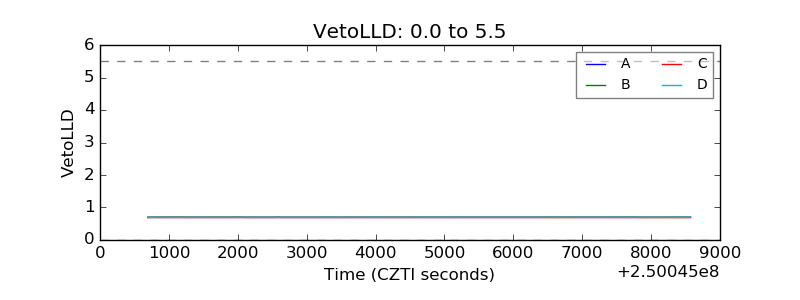 |
| Alpha Counter | 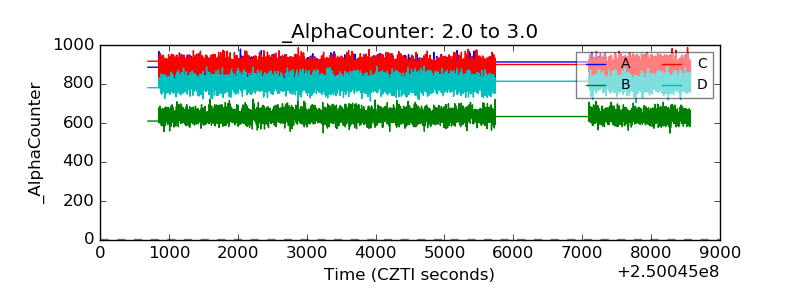 |
| _CPM_Rate | 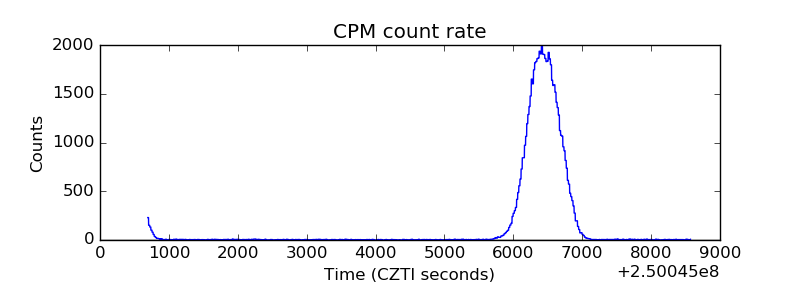 |
| CZT Counter | 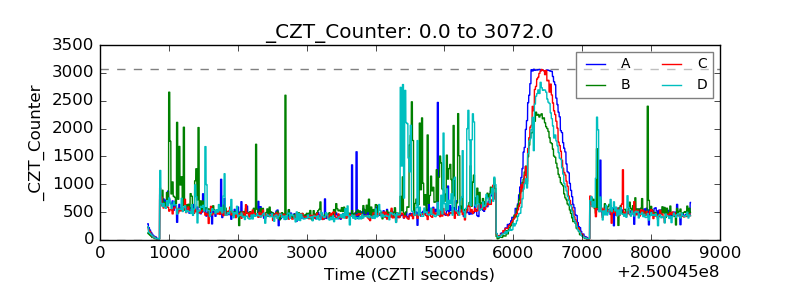 |
| +2.5 Volts monitor |  |
| +5 Volts monitor |  |
| _ROLL_ROT | 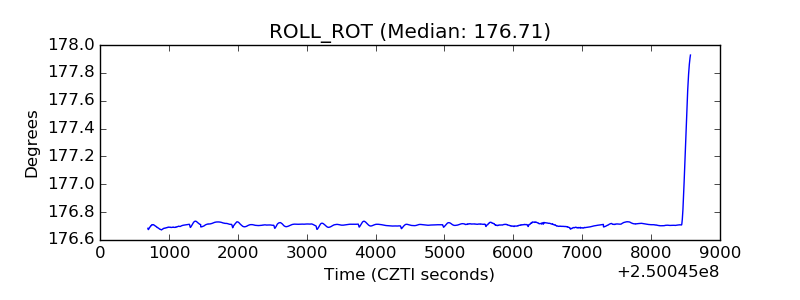 |
| _Roll_DEC | 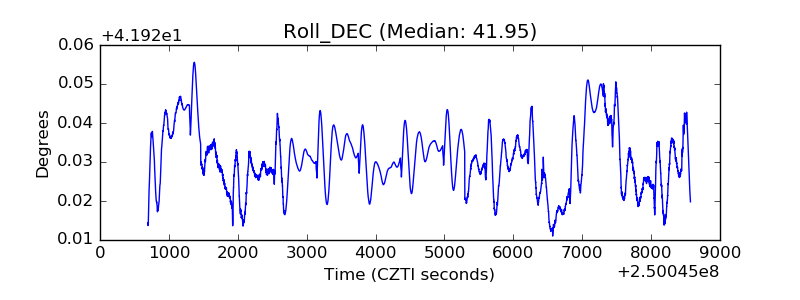 |
| _Roll_RA | 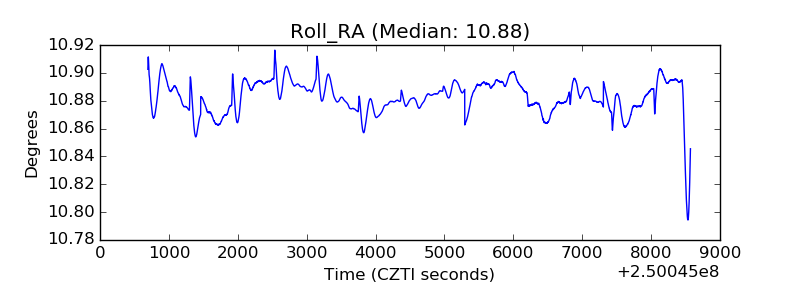 |
| Veto Counter | 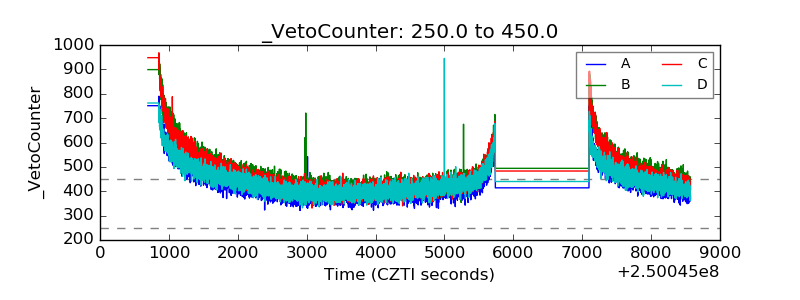 |