| Param | Original file | Final file |
|---|---|---|
| Filename | modeM0/AS1A04_022T04_9000001746_11812cztM0_level2.evt | modeM0/AS1A04_022T04_9000001746_11812cztM0_level2_quad_clean.evt |
| Size (bytes) | 472,481,280 | 70,686,720 |
| Size | 450.6 MB | 67.4 MB |
| Events in quadrant A | 3,327,413 | 425,969 |
| Events in quadrant B | 4,236,661 | 423,809 |
| Events in quadrant C | 3,065,243 | 431,674 |
| Events in quadrant D | 3,238,484 | 405,509 |
| Mode SS | |||
|---|---|---|---|
| Quadrant | BADHDUFLAG | Total packets | Discarded packets |
| A | 0 | 130 | 0 |
| B | 0 | 130 | 0 |
| C | 0 | 130 | 0 |
| D | 0 | 130 | 0 |
| Mode M9 | |||
|---|---|---|---|
| Quadrant | BADHDUFLAG | Total packets | Discarded packets |
| A | 0 | 17 | 0 |
| B | 0 | 17 | 0 |
| C | 0 | 17 | 0 |
| D | 0 | 18 | 0 |
| Mode M0 | |||
|---|---|---|---|
| Quadrant | BADHDUFLAG | Total packets | Discarded packets |
| A | 0 | 13967 | 3 |
| B | 0 | 16701 | 2 |
| C | 0 | 13442 | 2 |
| D | 0 | 14156 | 2 |
| Quadrant | Total seconds | Saturated seconds | Saturation percentage |
|---|---|---|---|
| A | 6504 | 72 | 1.107011% |
| B | 6504 | 282 | 4.335793% |
| C | 6504 | 28 | 0.430504% |
| D | 6504 | 51 | 0.784133% |
Noise dominated data is calculated using 1-second bins in cleaned event files. If a bin has >2000 counts, and if more than 50% of those come from <1% of pixels, then it is considered to be noise-dominated and hence unusable.
| Quadrant | # 1 sec bins | Bins with >0 counts | Bins with >2000 counts | High rate bins dominated by noise | Noise dominated (total time) | Noise dominated (detector-on time) | Marked lightcurve |
|---|---|---|---|---|---|---|---|
| A | 7765 | 6506 | 2 | 2 | 0.03% | 0.03% | 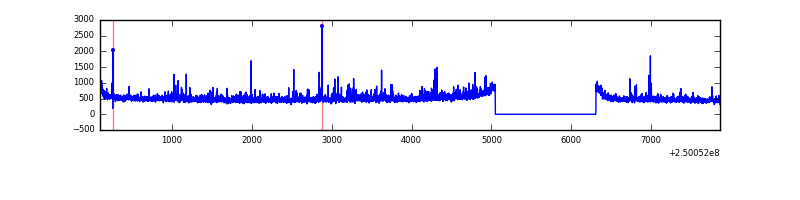 |
| B | 7765 | 6506 | 54 | 54 | 0.70% | 0.83% |  |
| C | 7765 | 6506 | 0 | 0 | 0.00% | 0.00% | 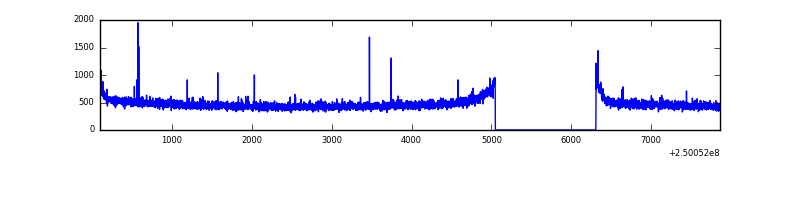 |
| D | 7765 | 6506 | 23 | 23 | 0.30% | 0.35% | 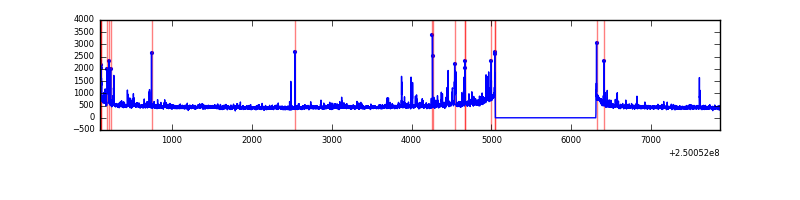 |
Top three noisy pixels from each quadrant. If the there are fewer than three noisy pixels in the level2.evt file, extra rows are filled as -1
| Pixel properties | Quadrant properties | ||||||
|---|---|---|---|---|---|---|---|
| Quadrant | DetID | PixID | Counts | Sigma | Mean | Median | Sigma |
| A | 1 | 162 | 91523 | 563.45 | 797 | 780 | 161.1 |
| A | 1 | 178 | 49034 | 299.62 | 797 | 780 | 161.1 |
| A | 1 | 161 | 42581 | 259.55 | 797 | 780 | 161.1 |
| B | 4 | 239 | 353921 | 2364.98 | 797 | 778 | 149.3 |
| B | 15 | 185 | 325828 | 2176.84 | 797 | 778 | 149.3 |
| B | 15 | 204 | 208205 | 1389.13 | 797 | 778 | 149.3 |
| C | 1 | 16 | 8268 | 41.63 | 781 | 787 | 179.7 |
| C | 15 | 127 | 7313 | 36.31 | 781 | 787 | 179.7 |
| C | 13 | 61 | 5679 | 27.22 | 781 | 787 | 179.7 |
| D | 1 | 52 | 87767 | 475.52 | 766 | 747 | 183.0 |
| D | 8 | 195 | 64332 | 347.46 | 766 | 747 | 183.0 |
| D | 10 | 199 | 53176 | 286.49 | 766 | 747 | 183.0 |
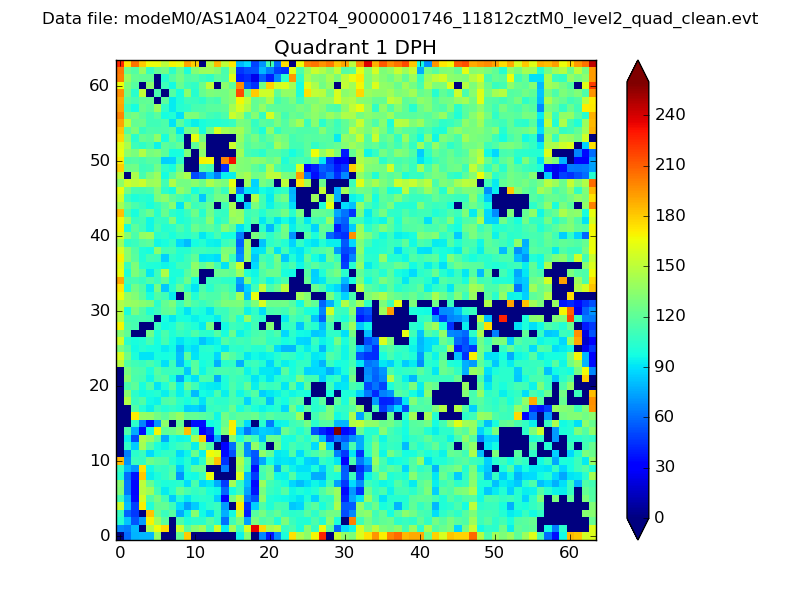
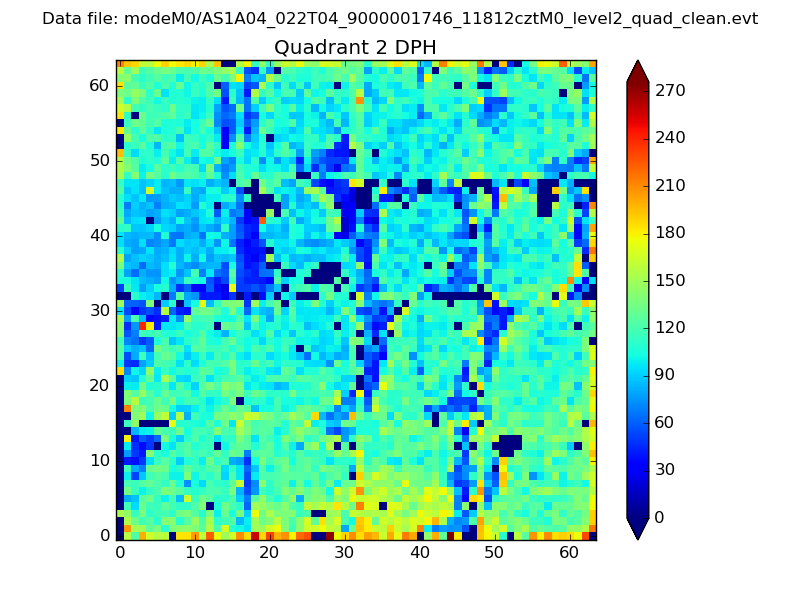
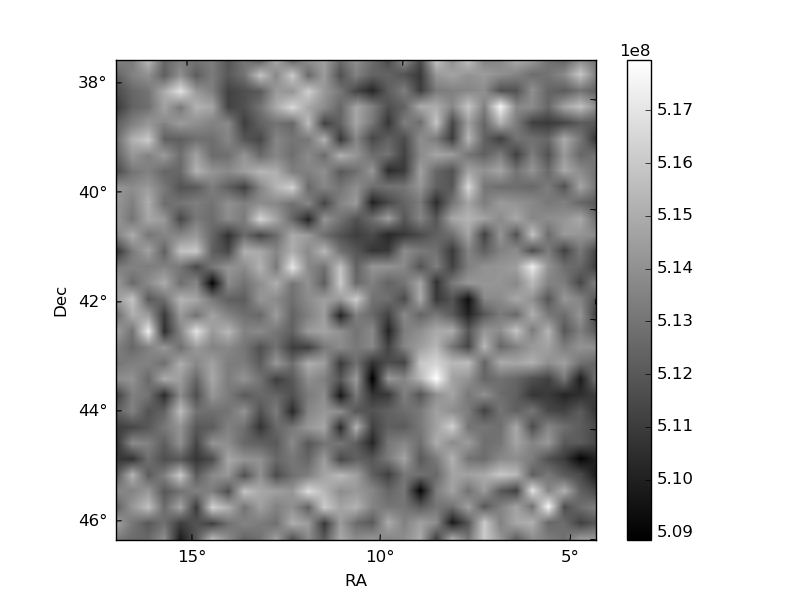
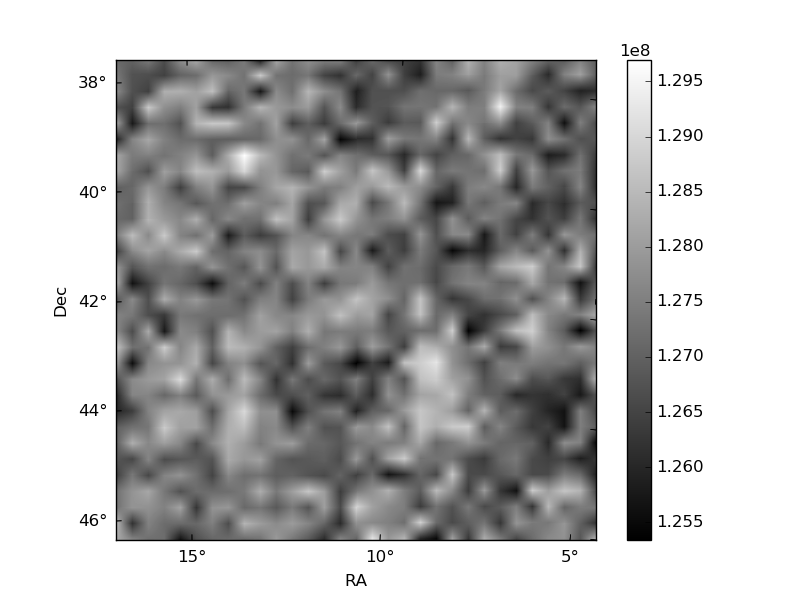
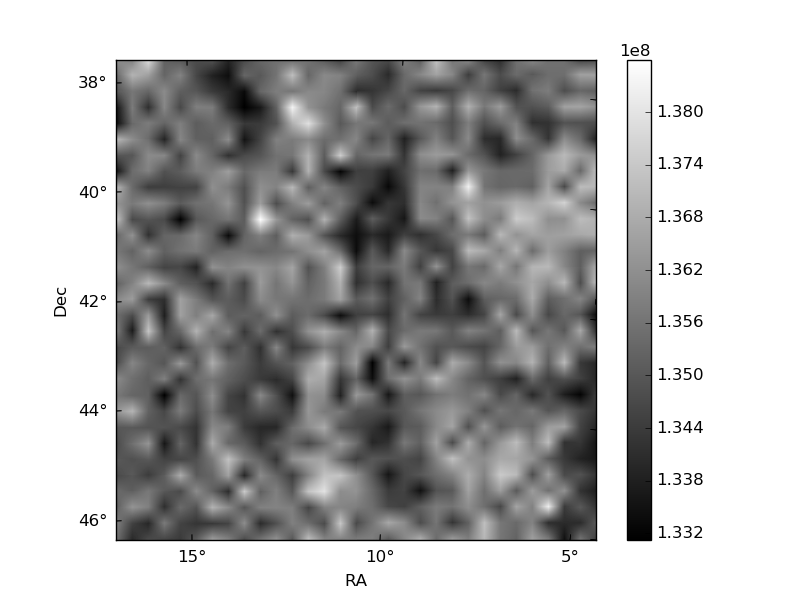
Histogram calculated using DETX and DETY for each event in the final _common_clean file
| Quadrant A | 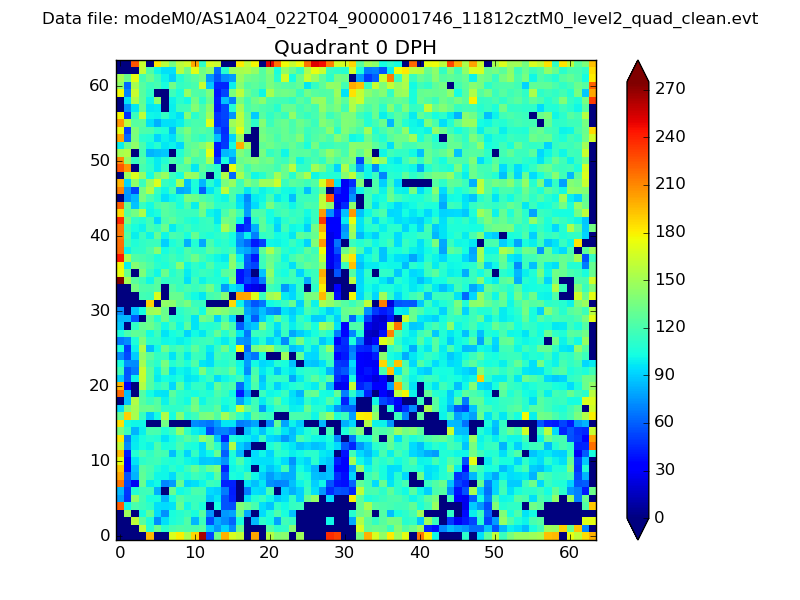 |
 |
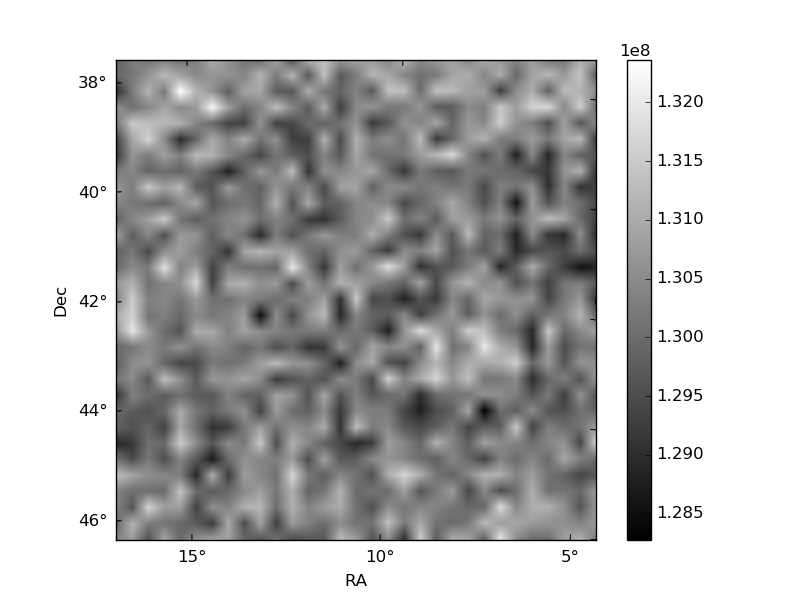
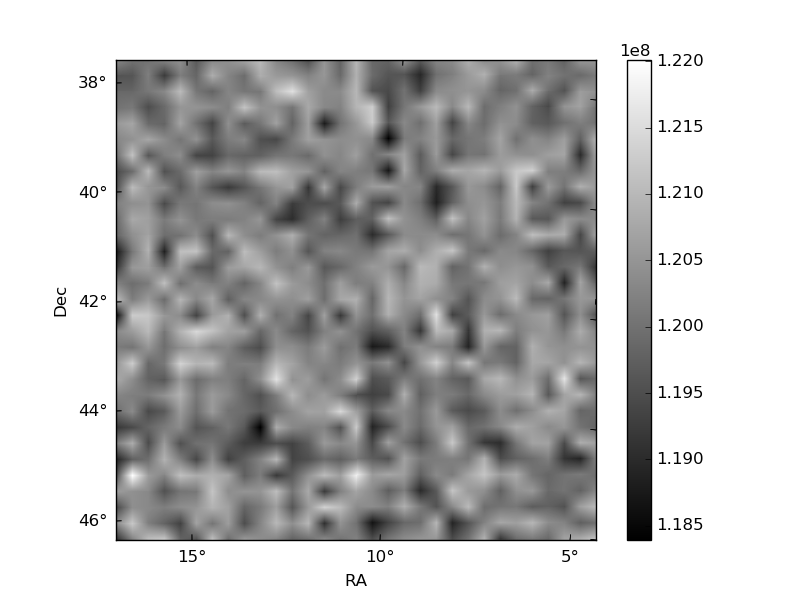
Quadrant B |
|---|---|---|---|
| Quadrant D | 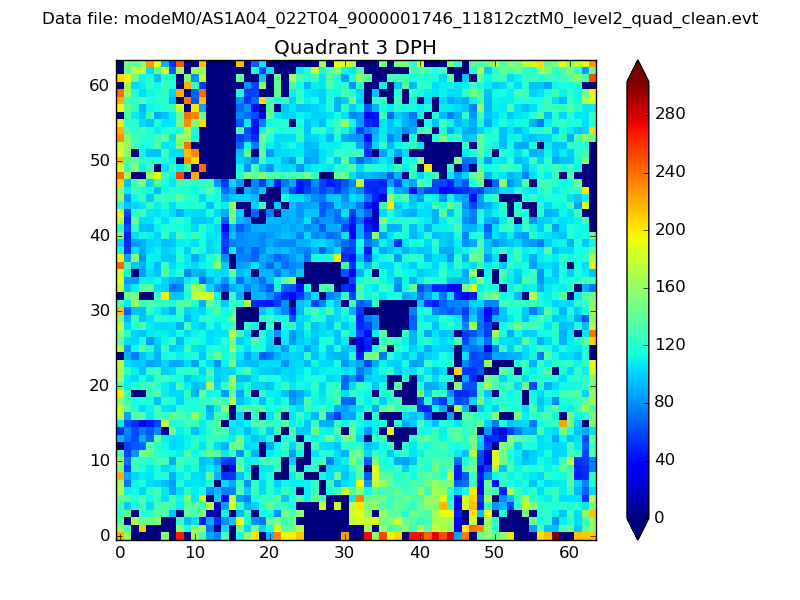 |
 |
Quadrant C |
| Plot type | Count rate plots | Images |
|---|---|---|
| Comparison with Poisson distribution Blue bars denote a histogram of data divided into 1 sec bins. Red curve is a Poisson curve with rate = median count rate of data. |
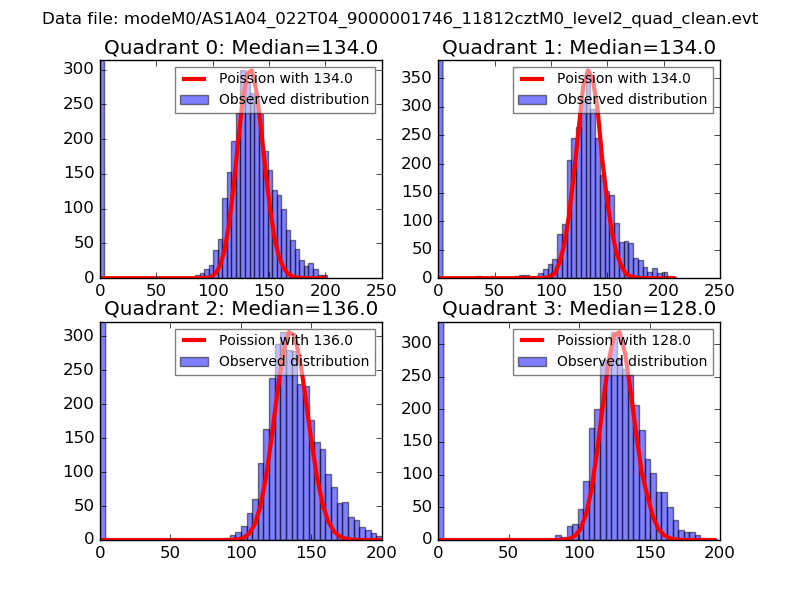 |
 |
| Quadrant-wise count rates Data is divided into 100 sec bins |
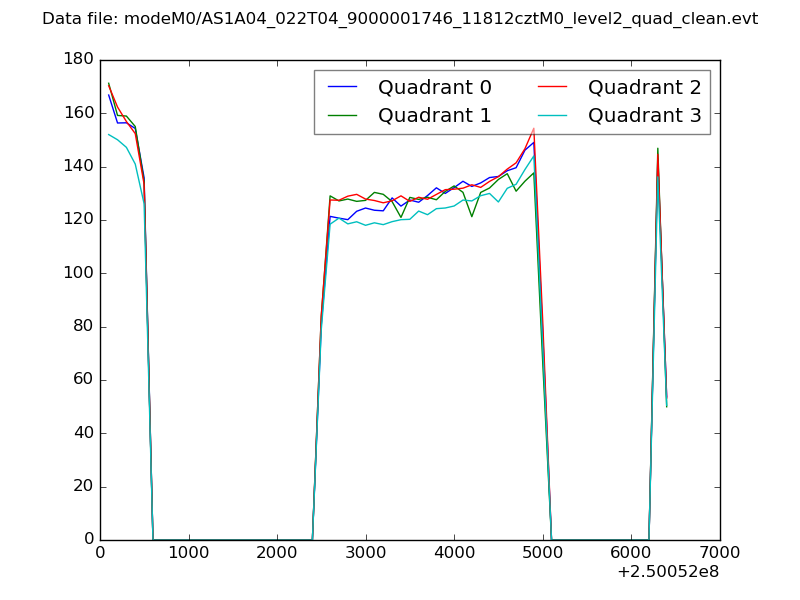 |
|
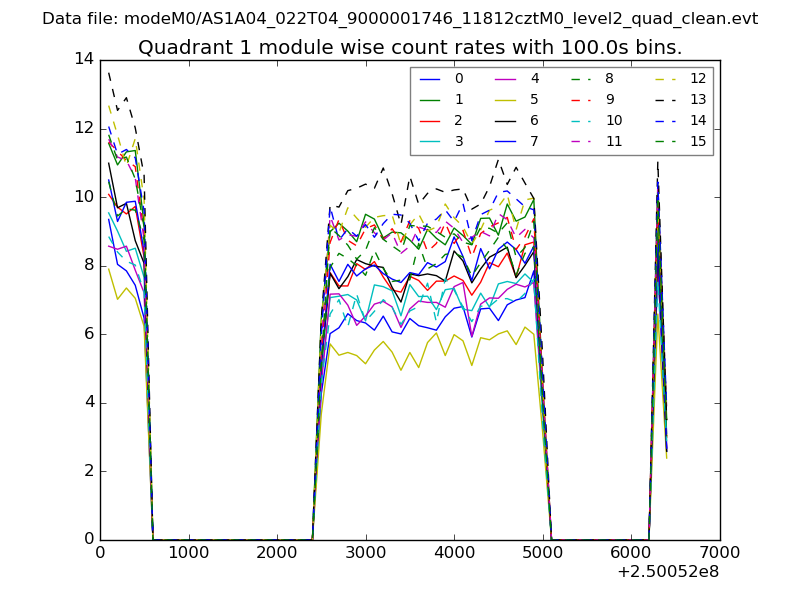
| Module-wise count rates for Quadrant A Data is divided into 100 sec bins |
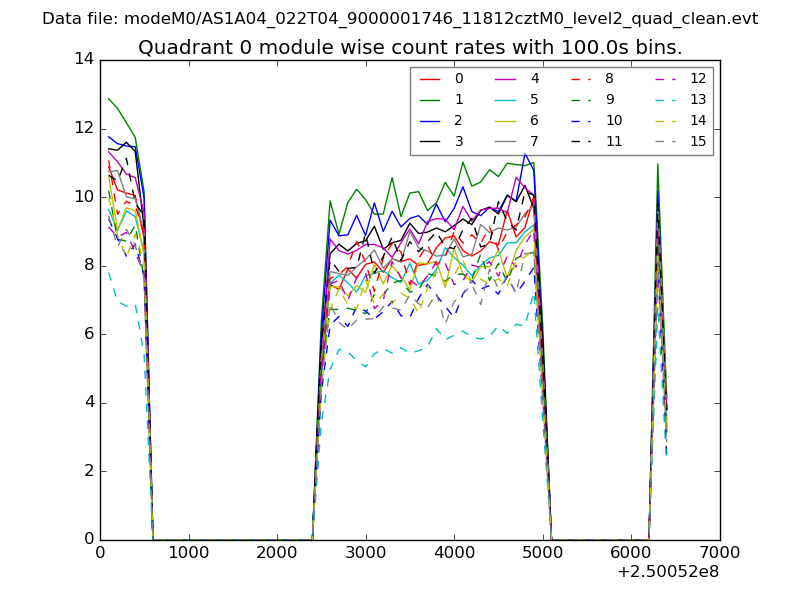 |
 |
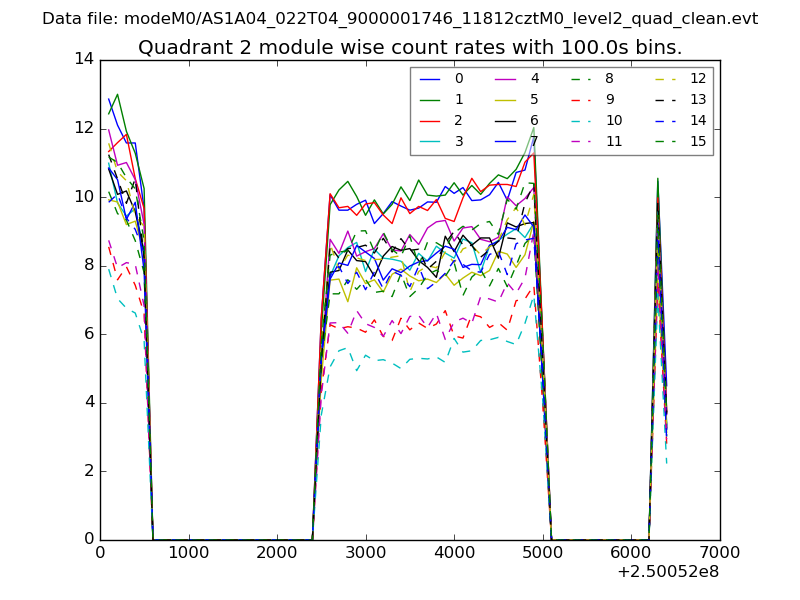
| Module-wise count rates for Quadrant B Data is divided into 100 sec bins |
 |
 |
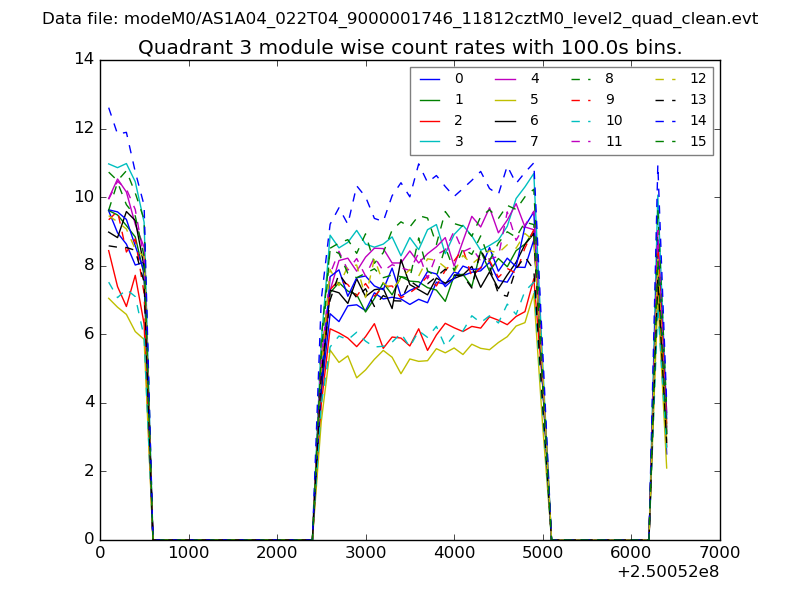
| Module-wise count rates for Quadrant C Data is divided into 100 sec bins |
 |
 |
| Module-wise count rates for Quadrant D Data is divided into 100 sec bins |
 |
 |
| Parameter | Plot |
|---|---|
| CZT HV Monitor | 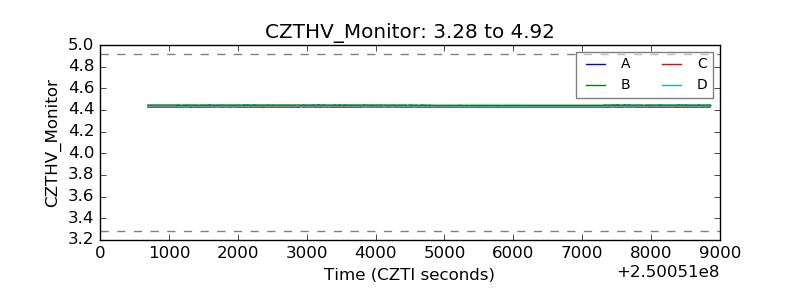 |
| D_VDD |  |
| Temperature 1 | 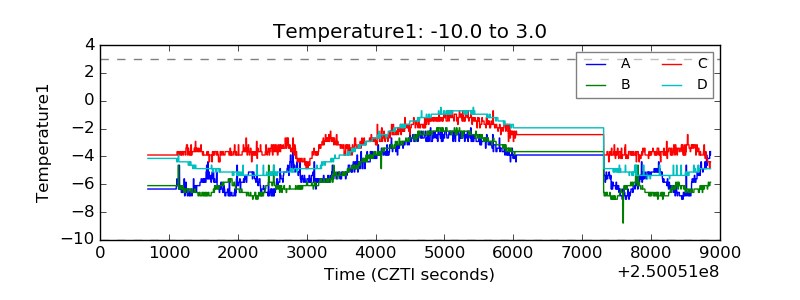 |
| Veto HV Monitor | 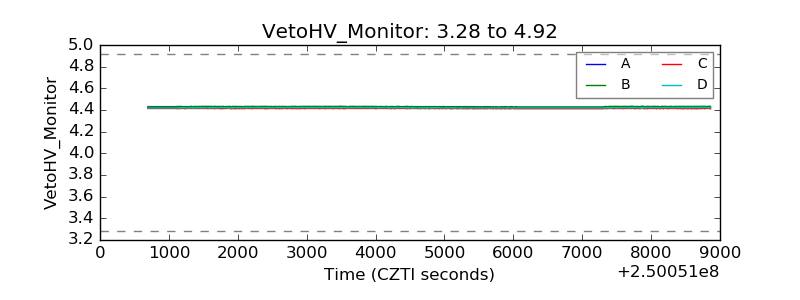 |
| Veto LLD | 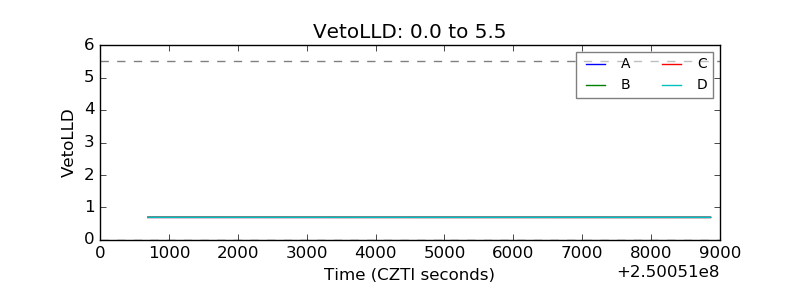 |
| Alpha Counter | 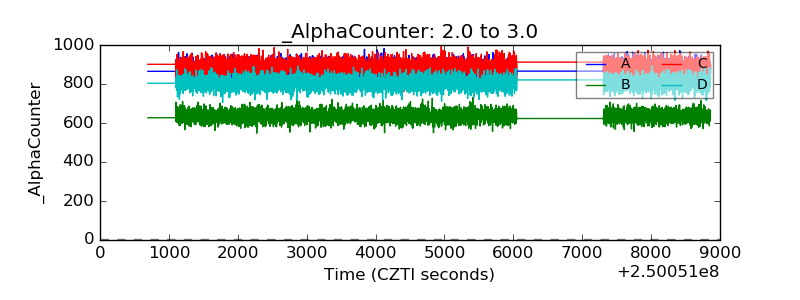 |
| _CPM_Rate | 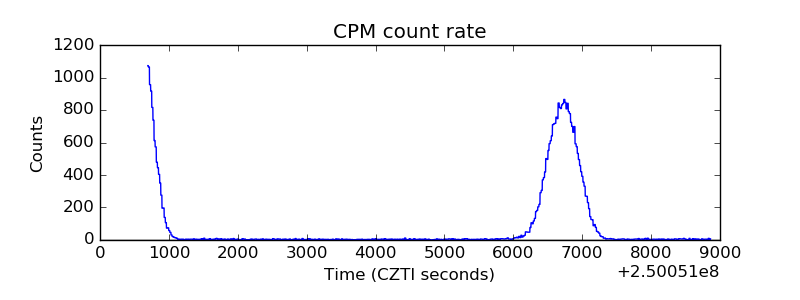 |
| CZT Counter | 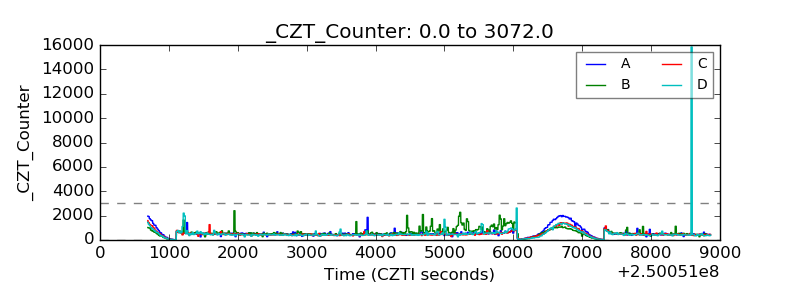 |
| +2.5 Volts monitor |  |
| +5 Volts monitor |  |
| _ROLL_ROT | 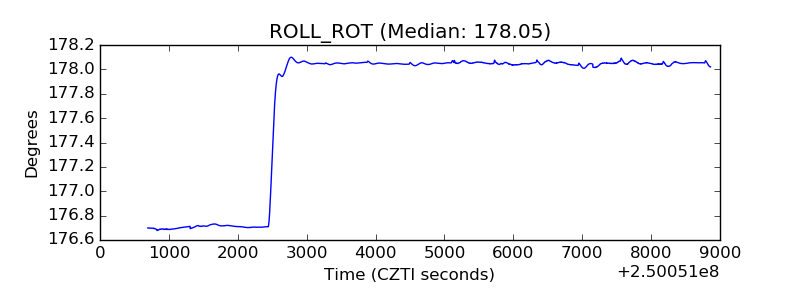 |
| _Roll_DEC | 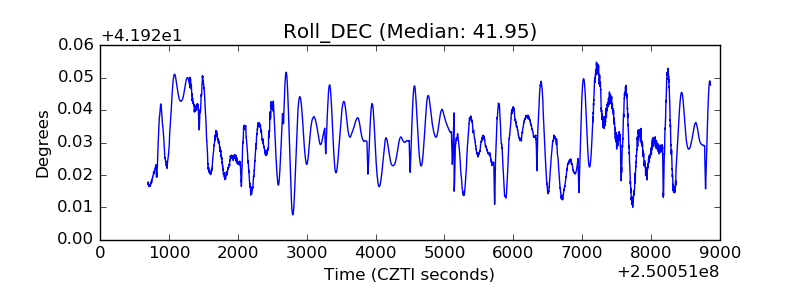 |
| _Roll_RA | 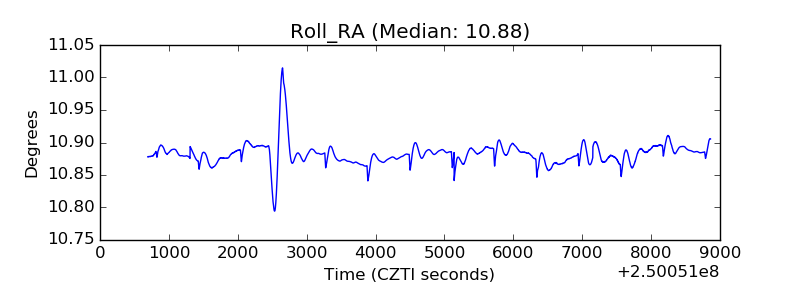 |
| Veto Counter | 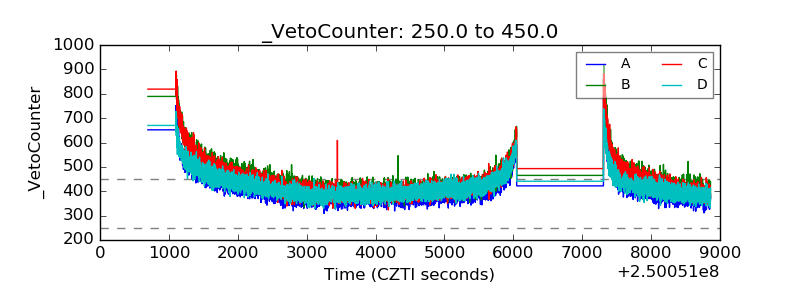 |