| Param | Original file | Final file |
|---|---|---|
| Filename | modeM0/AS1A04_022T04_9000001746_11813cztM0_level2.evt | modeM0/AS1A04_022T04_9000001746_11813cztM0_level2_quad_clean.evt |
| Size (bytes) | 482,437,440 | 71,844,480 |
| Size | 460.1 MB | 68.5 MB |
| Events in quadrant A | 3,322,012 | 428,974 |
| Events in quadrant B | 3,919,234 | 425,557 |
| Events in quadrant C | 3,143,154 | 432,609 |
| Events in quadrant D | 3,762,775 | 412,703 |
| Mode SS | |||
|---|---|---|---|
| Quadrant | BADHDUFLAG | Total packets | Discarded packets |
| A | 0 | 138 | 0 |
| B | 0 | 138 | 0 |
| C | 0 | 138 | 0 |
| D | 0 | 138 | 0 |
| Mode M9 | |||
|---|---|---|---|
| Quadrant | BADHDUFLAG | Total packets | Discarded packets |
| A | 0 | 14 | 0 |
| B | 0 | 14 | 0 |
| C | 0 | 14 | 0 |
| D | 0 | 15 | 0 |
| Mode M0 | |||
|---|---|---|---|
| Quadrant | BADHDUFLAG | Total packets | Discarded packets |
| A | 0 | 14311 | 3 |
| B | 0 | 15959 | 2 |
| C | 0 | 14050 | 2 |
| D | 0 | 15987 | 2 |
| Quadrant | Total seconds | Saturated seconds | Saturation percentage |
|---|---|---|---|
| A | 6823 | 112 | 1.641507% |
| B | 6823 | 254 | 3.722703% |
| C | 6823 | 62 | 0.908691% |
| D | 6823 | 220 | 3.224388% |
Noise dominated data is calculated using 1-second bins in cleaned event files. If a bin has >2000 counts, and if more than 50% of those come from <1% of pixels, then it is considered to be noise-dominated and hence unusable.
| Quadrant | # 1 sec bins | Bins with >0 counts | Bins with >2000 counts | High rate bins dominated by noise | Noise dominated (total time) | Noise dominated (detector-on time) | Marked lightcurve |
|---|---|---|---|---|---|---|---|
| A | 7779 | 6825 | 1 | 1 | 0.01% | 0.01% | 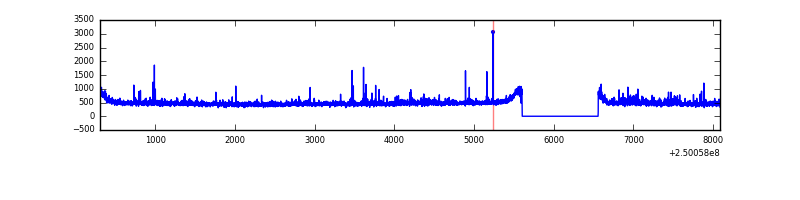 |
| B | 7779 | 6825 | 90 | 90 | 1.16% | 1.32% | 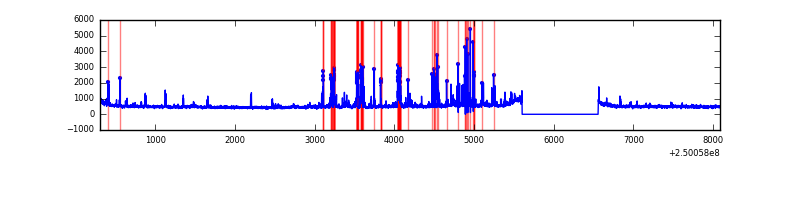 |
| C | 7779 | 6825 | 0 | 0 | 0.00% | 0.00% | 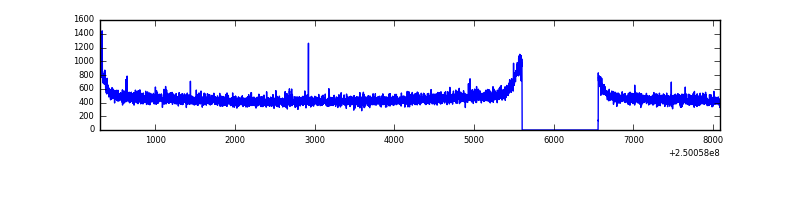 |
| D | 7779 | 6825 | 140 | 140 | 1.80% | 2.05% |  |
Top three noisy pixels from each quadrant. If the there are fewer than three noisy pixels in the level2.evt file, extra rows are filled as -1
| Pixel properties | Quadrant properties | ||||||
|---|---|---|---|---|---|---|---|
| Quadrant | DetID | PixID | Counts | Sigma | Mean | Median | Sigma |
| A | 1 | 162 | 70847 | 420.57 | 818 | 800 | 166.6 |
| A | 1 | 178 | 34745 | 203.81 | 818 | 800 | 166.6 |
| A | 1 | 161 | 30487 | 178.25 | 818 | 800 | 166.6 |
| B | 4 | 239 | 429460 | 2753.61 | 819 | 799 | 155.7 |
| B | 10 | 16 | 96467 | 614.55 | 819 | 799 | 155.7 |
| B | 15 | 185 | 45319 | 285.99 | 819 | 799 | 155.7 |
| C | 1 | 16 | 6754 | 31.93 | 803 | 807 | 186.2 |
| C | 13 | 61 | 5775 | 26.67 | 803 | 807 | 186.2 |
| C | 8 | 208 | 3269 | 13.22 | 803 | 807 | 186.2 |
| D | 10 | 199 | 406048 | 2127.82 | 786 | 764 | 190.5 |
| D | 1 | 52 | 146626 | 765.8 | 786 | 764 | 190.5 |
| D | 8 | 195 | 96812 | 504.27 | 786 | 764 | 190.5 |
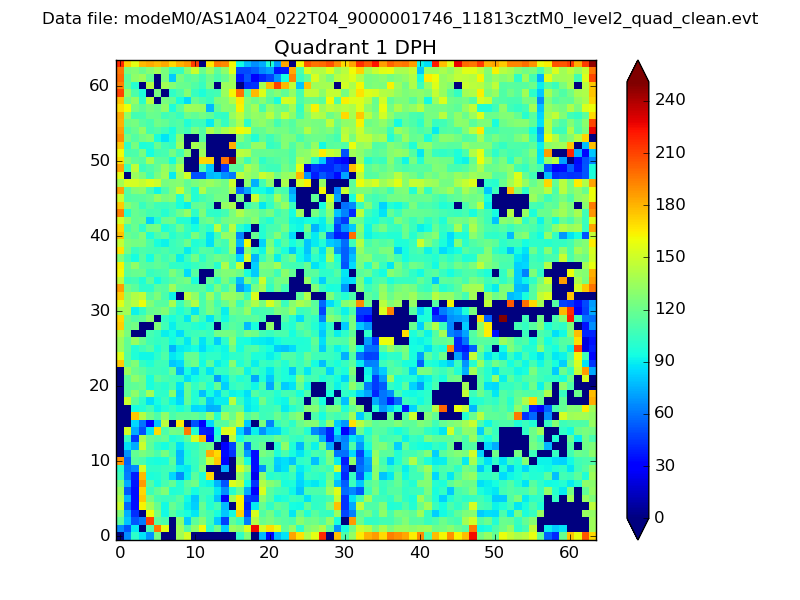
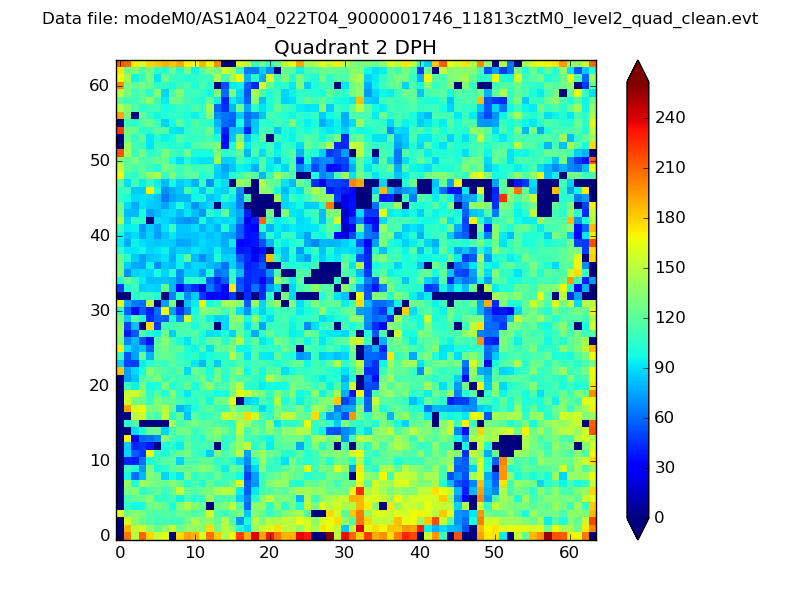
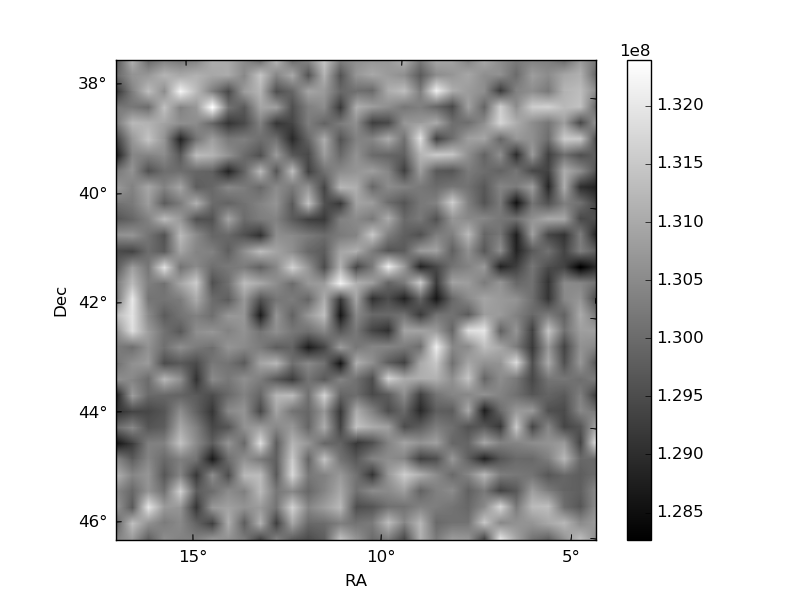
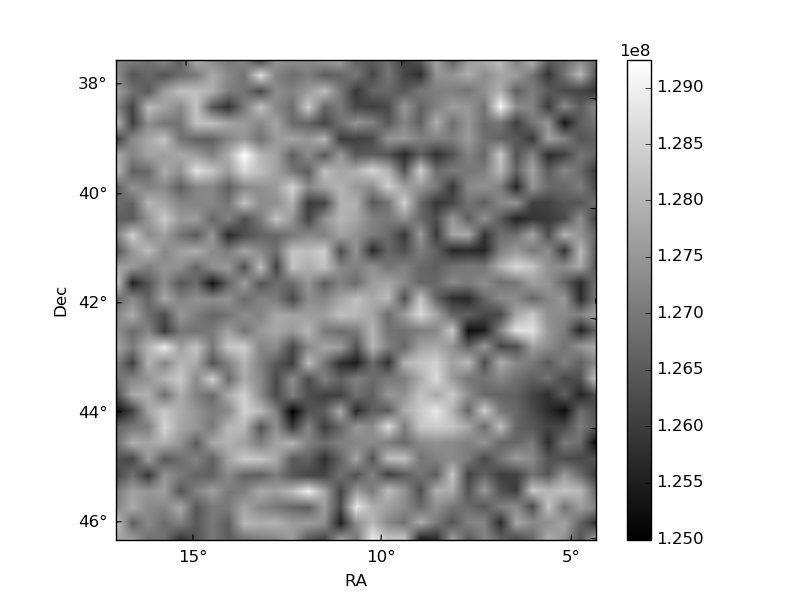
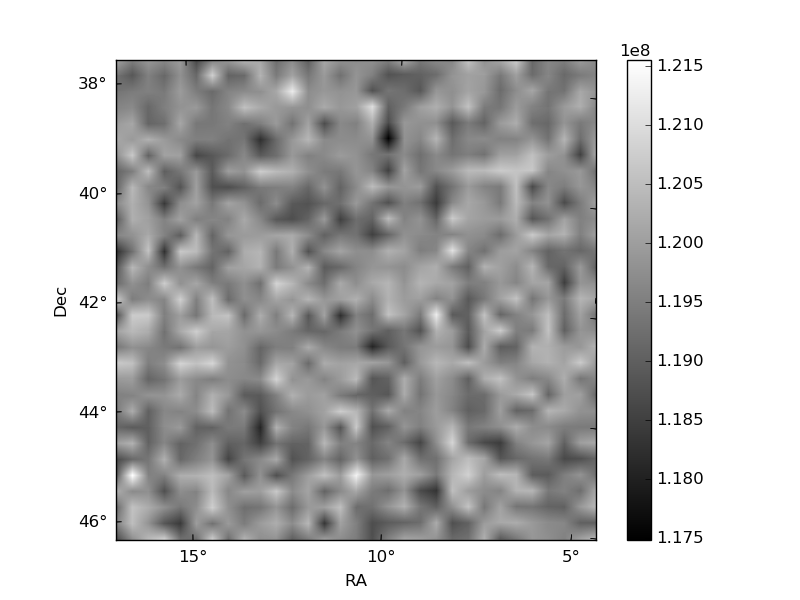
Histogram calculated using DETX and DETY for each event in the final _common_clean file
| Quadrant A | 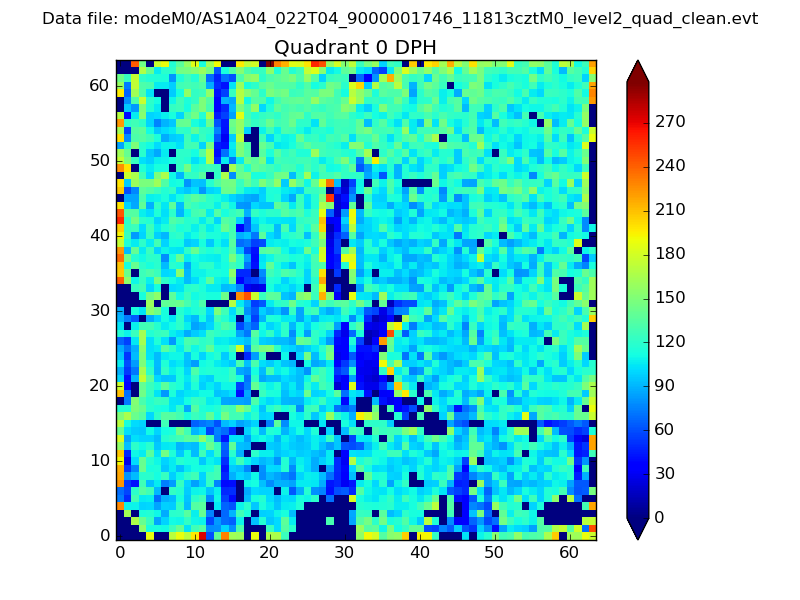 |
 |
Quadrant B |
|---|---|---|---|
| Quadrant D | 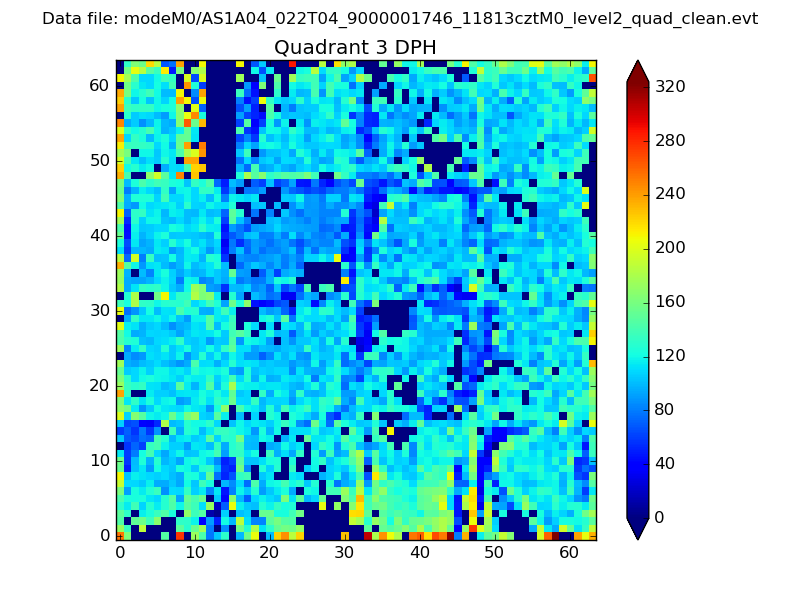 |
 |
Quadrant C |
| Plot type | Count rate plots | Images |
|---|---|---|
| Comparison with Poisson distribution Blue bars denote a histogram of data divided into 1 sec bins. Red curve is a Poisson curve with rate = median count rate of data. |
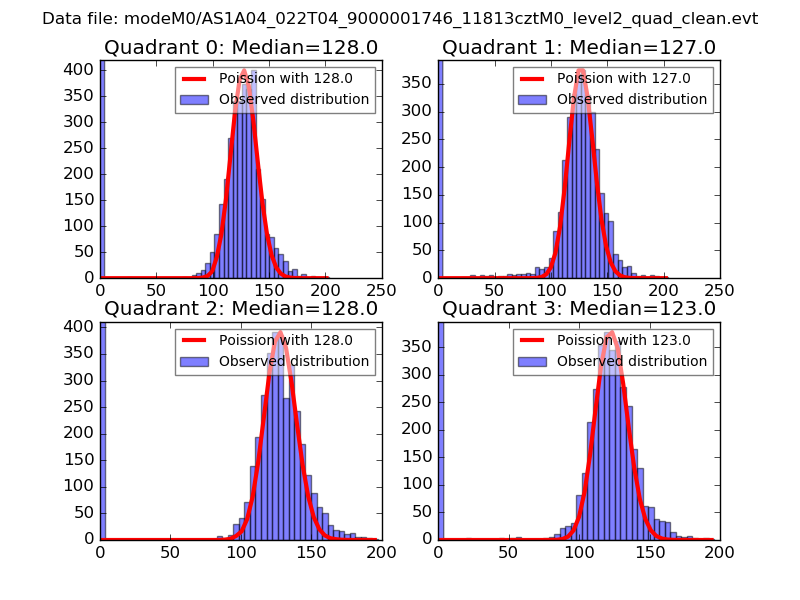 |
 |
| Quadrant-wise count rates Data is divided into 100 sec bins |
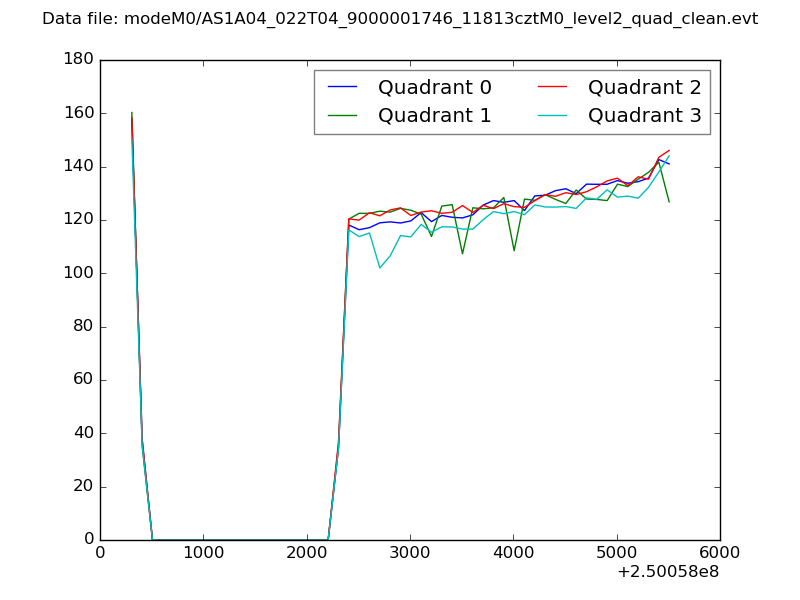 |
|
| Module-wise count rates for Quadrant A Data is divided into 100 sec bins |
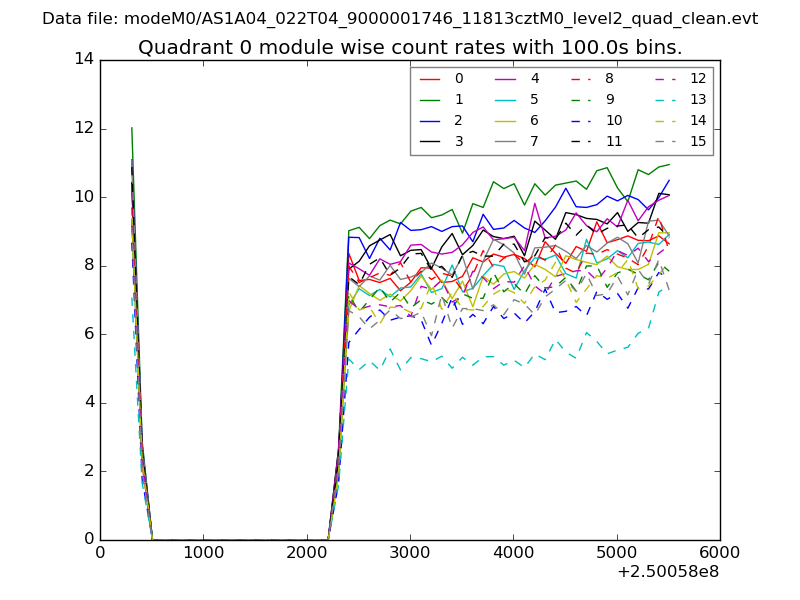 |
 |
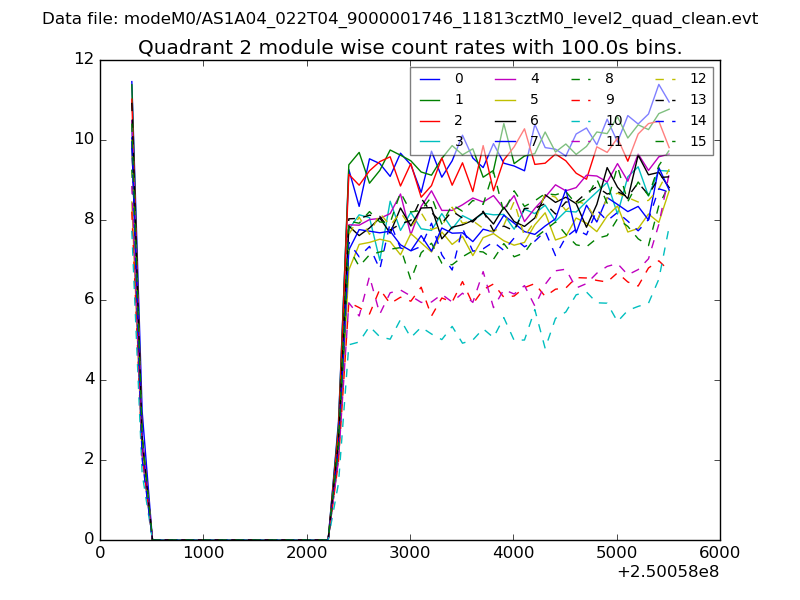
| Module-wise count rates for Quadrant B Data is divided into 100 sec bins |
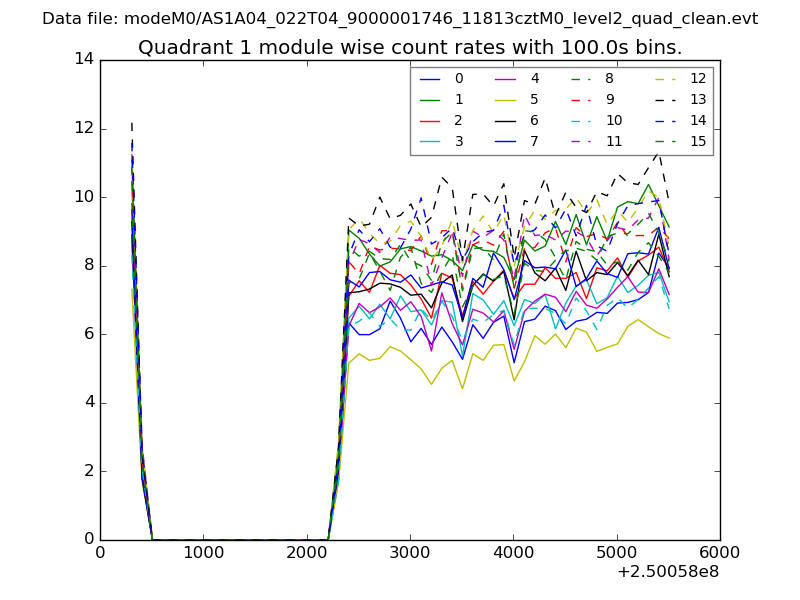 |
 |
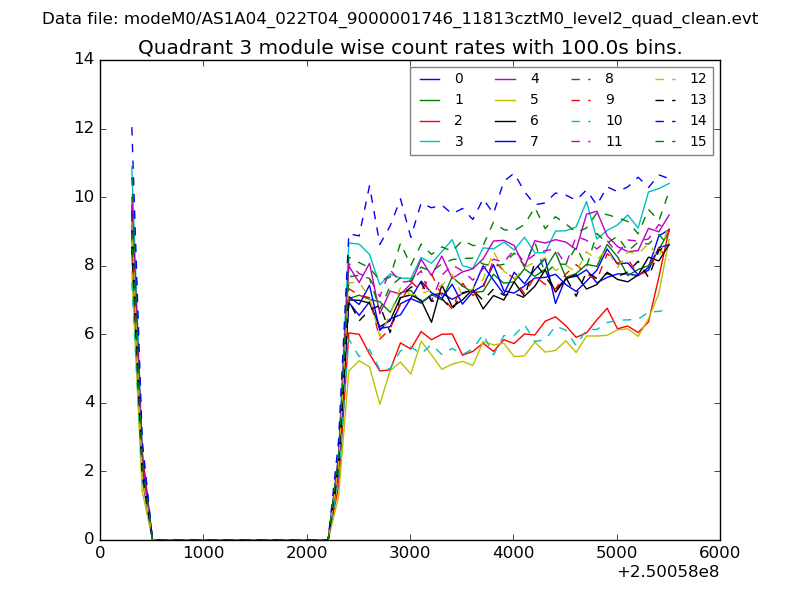
| Module-wise count rates for Quadrant C Data is divided into 100 sec bins |
 |
 |
| Module-wise count rates for Quadrant D Data is divided into 100 sec bins |
 |
 |
| Parameter | Plot |
|---|---|
| CZT HV Monitor | 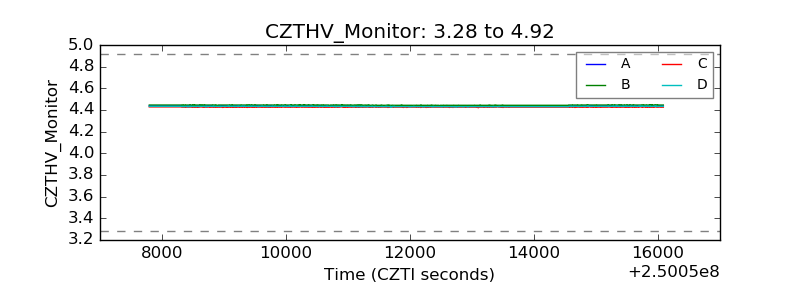 |
| D_VDD | 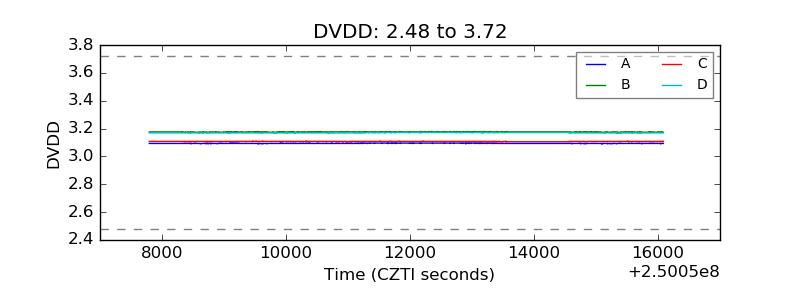 |
| Temperature 1 | 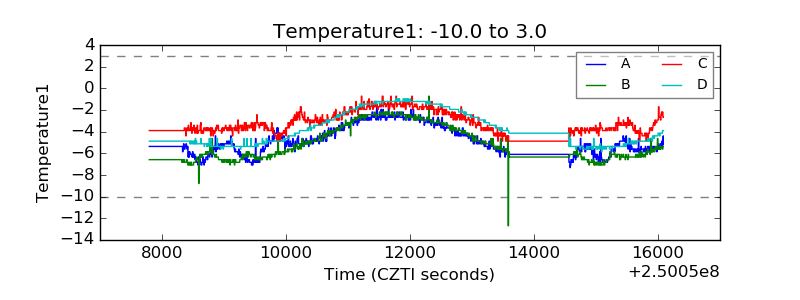 |
| Veto HV Monitor |  |
| Veto LLD | 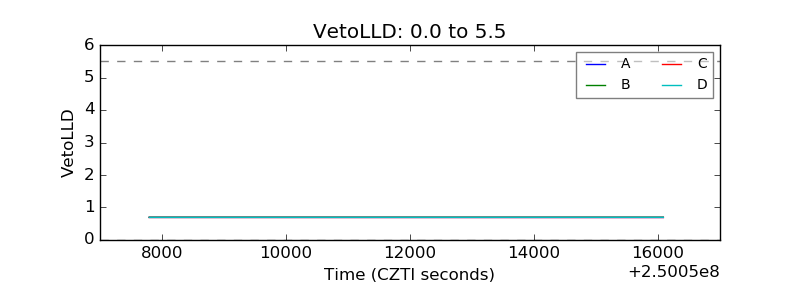 |
| Alpha Counter | 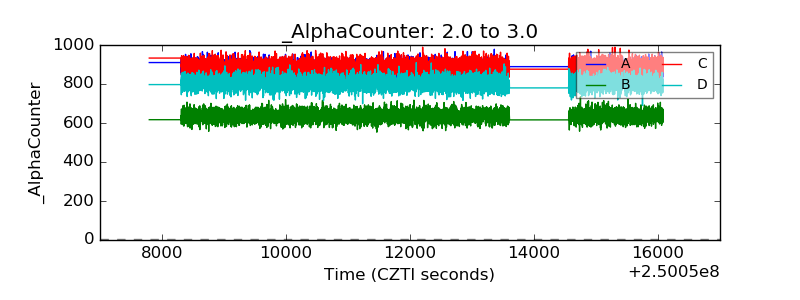 |
| _CPM_Rate | 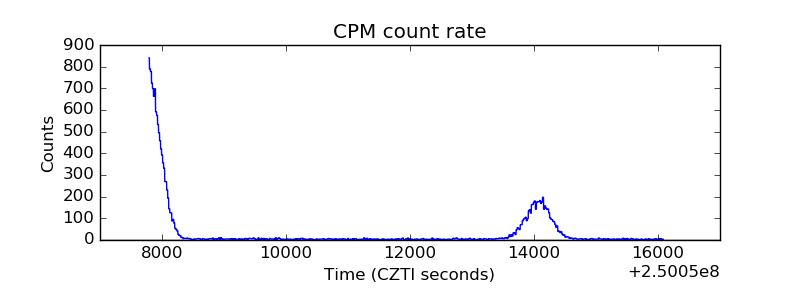 |
| CZT Counter | 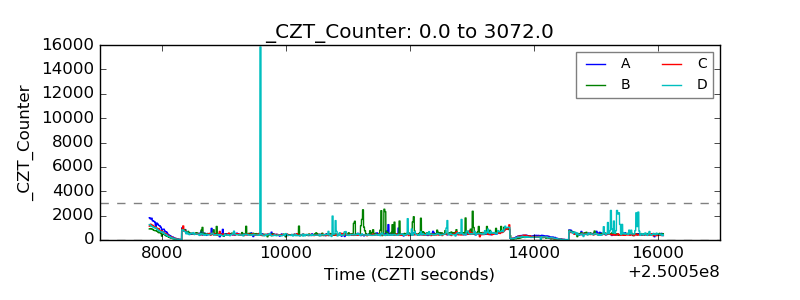 |
| +2.5 Volts monitor |  |
| +5 Volts monitor |  |
| _ROLL_ROT | 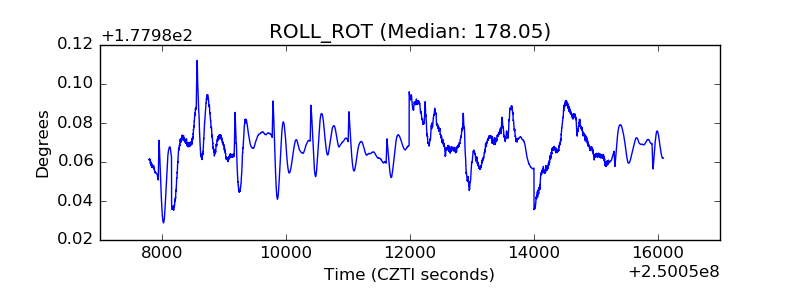 |
| _Roll_DEC | 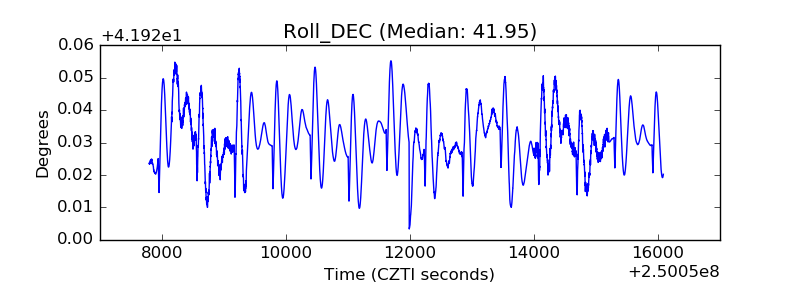 |
| _Roll_RA |  |
| Veto Counter | 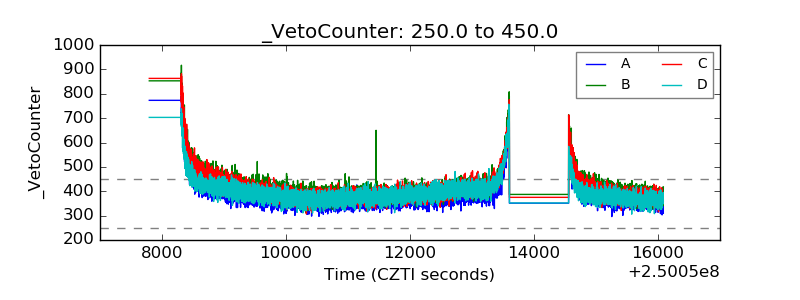 |